
News Release
Gross Domestic Product by Metropolitan Area, 2017
Professional and Business Services Led Growth Across Metropolitan Areas in 2017
Real gross domestic product (GDP) increased in 312 out of 383 metropolitan areas in 2017 according to statistics on the geographic breakout of GDP released today by the Bureau of Economic Analysis. The percent change in real GDP by metropolitan area ranged from 12.1 percent in Odessa, TX to -7.8 percent in Enid, OK (table 2).
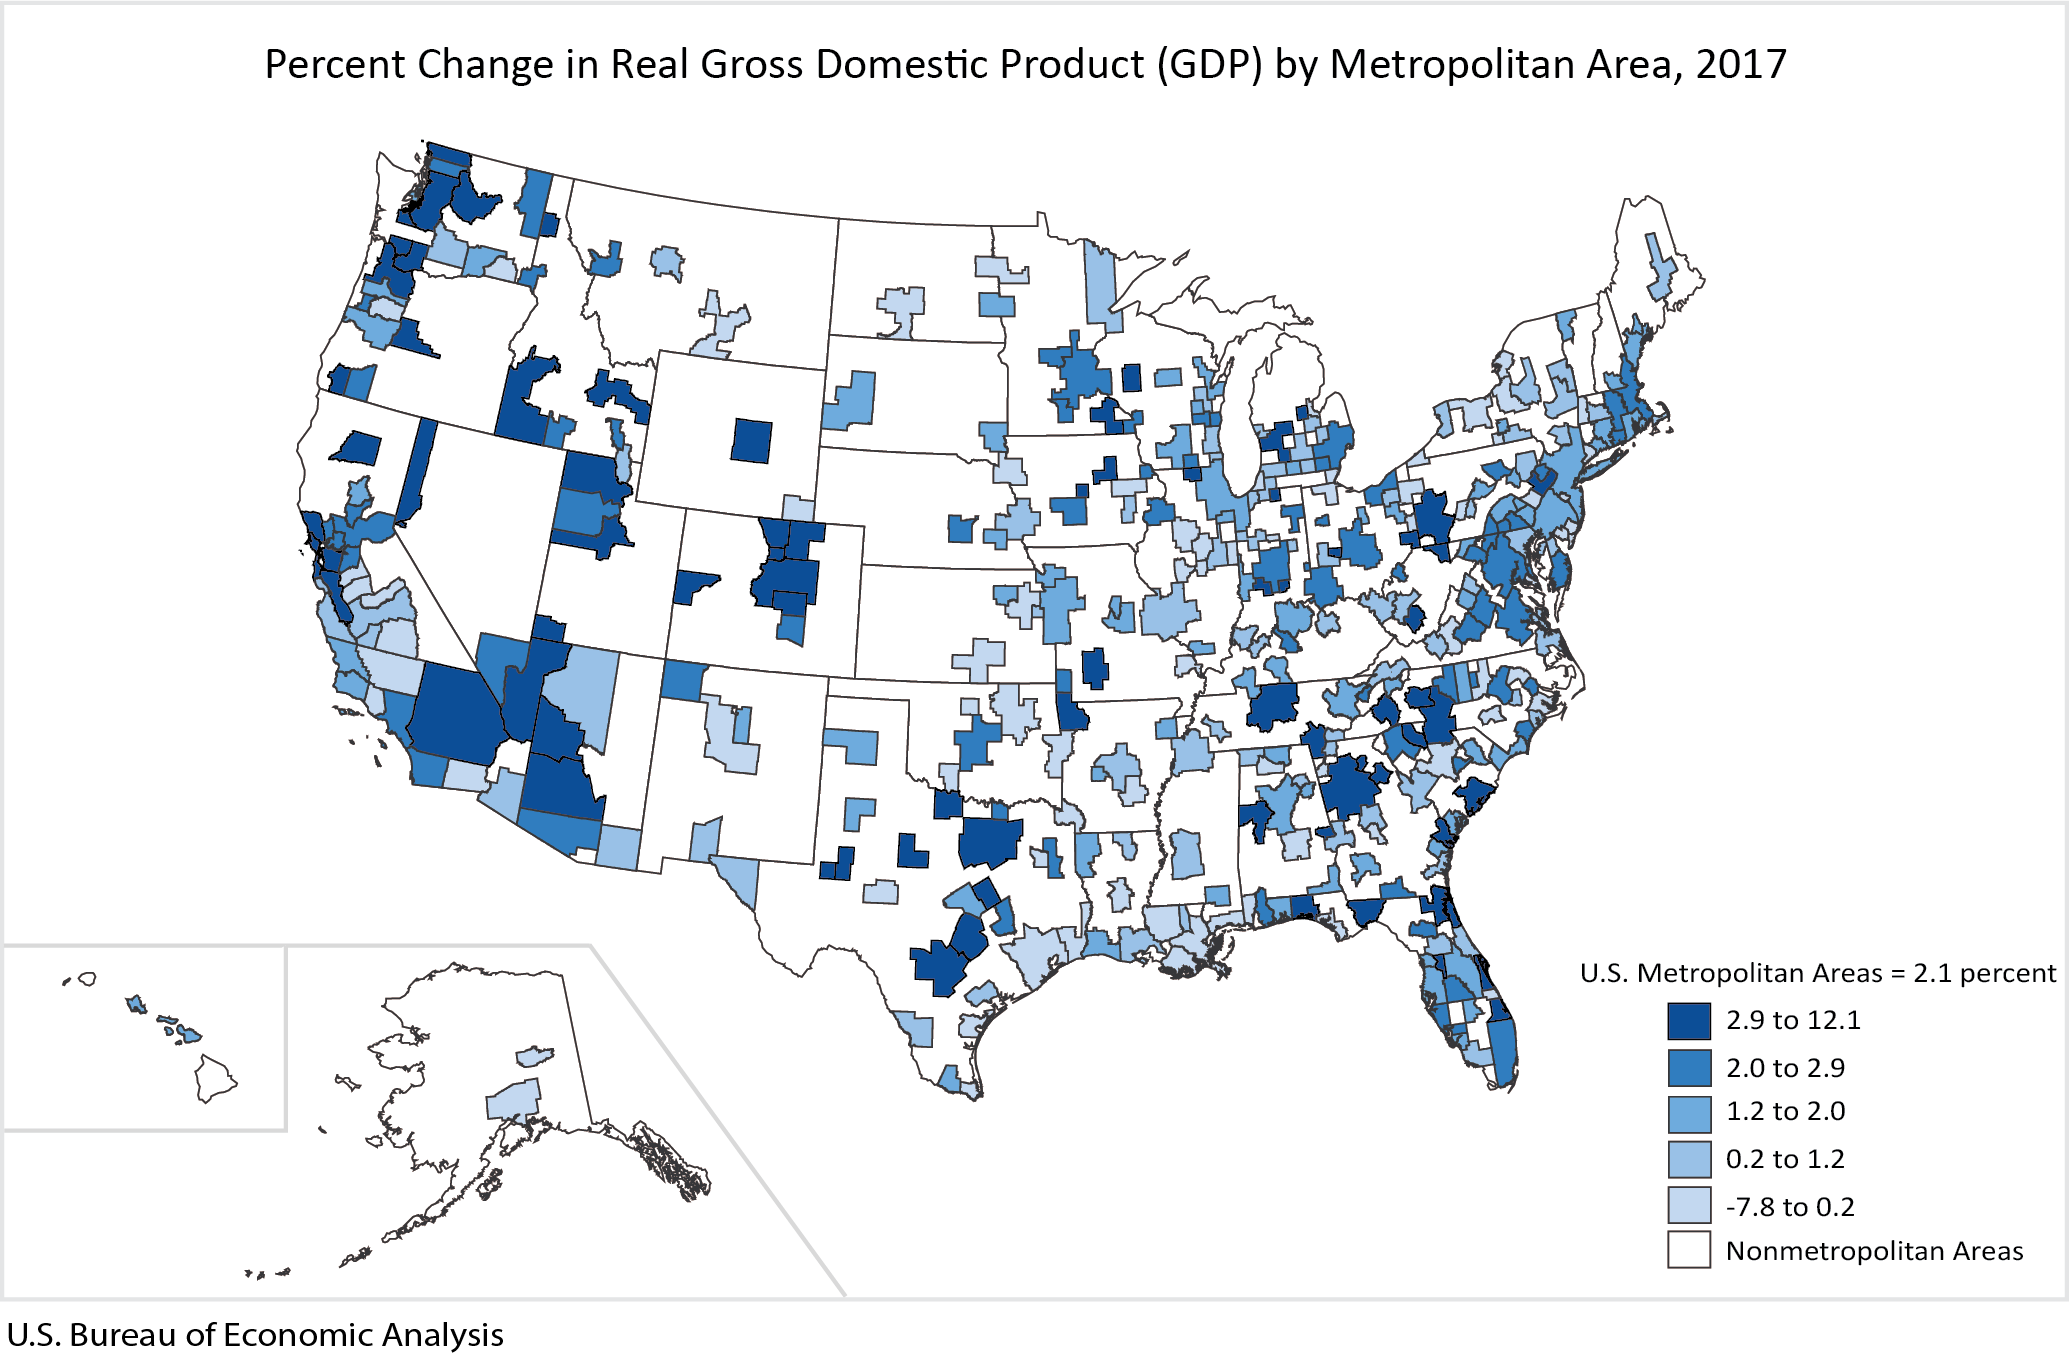
Real GDP for U.S. metropolitan areas increased 2.1 percent in 2017, led by growth in professional and business services; wholesale and retail trade; and finance, insurance, real estate, rental, and leasing (table 3).
Highlights
- Professional and business services increased 3.5 percent across the nation's metropolitan areas. This industry contributed to growth in 317 metropolitan areas, most notably in Midland, MI which increased 9.5 percent.
- Wholesale and retail trade increased 3.2 percent. This industry contributed to growth in 323 metropolitan areas, and was the leading contributor to growth in Lakeland-Winter Haven, FL and Seattle-Tacoma-Bellevue, WA, which increased 2.4 percent and 5.2 percent, respectively.
- Finance, insurance, real estate, rental, and leasing increased 1.5 percent. This industry contributed to growth in 237 metropolitan areas, and made major contributions to growth in Wheeling, WV-OH and Athens-Clark County, GA, which increased 10.9 percent and 4.9 percent, respectively.
- Natural resources and mining increased 2.2 percent. Although this industry wasn't a large contributor overall, it did make significant contributions in several metropolitan areas. Notable increases in this industry occurred in Beckley, WV and Odessa, TX, which increased 9.6 percent and 12.1 percent, respectively.
Large Metropolitan Area Highlights
- Of the large metropolitan areas, those with population greater than two million, Austin-Round Rock, TX (6.9 percent) and Seattle-Tacoma-Bellevue, WA (5.2 percent) had the largest increases in real GDP. Increases in Austin-Round Rock, TX and Seattle-Tacoma-Bellevue, WA were led by increases in wholesale and retail trade.
- Real GDP in Houston-The Woodlands-Sugarland, TX was unchanged from the previous year making it the only large metropolitan area not to increase. Professional and business services subtracted the most from growth in Houston-The Woodlands-Sugarland, TX offsetting notable contributions from natural resources and mining and nondurable-goods manufacturing.
Small Metropolitan Area Highlights
- Of the small metropolitan areas, those with population less than two million, Odessa, TX (12.1 percent) and Elkhart-Goshen, IN (11.3 percent) had the largest increases in real GDP. Odessa, TX was led by an increase in natural resources and mining, while Elkhart-Goshen, IN was led by an increase in durable goods manufacturing.
- The largest decreases in real GDP for small metropolitan areas were Enid, OK (-7.8 percent) and Visalia-Porterville, CA (-6.6 percent). Natural resources and mining subtracted from growth in Enid, OK, while finance, insurance, real estate, rental, and leasing subtracted from growth in Visalia-Porterville, CA.
Updates to Gross Domestic Product by Metropolitan Area
In addition to the statistics presented in this news release, BEA also revised GDP by metropolitan area statistics for 2001–2016. This update incorporated revised GDP by state statistics published in May 2018 and revised earnings statistics from BEA's Local Area Personal Income published in November 2017. These statistics do not yet reflect the revised benchmark NIPA statistics released in July 2018.
More metropolitan area highlights can be found on the regional highlights pages that accompany this release.