
News Release
Gross Domestic Product by Industry, 4th quarter and annual 2014
Nondurable Goods Manufacturing Led Growth in the Fourth Quarter
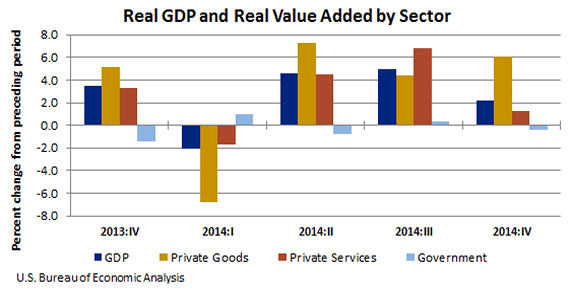
Nondurable goods manufacturing; professional, scientific, and technical services; and mining were the leading contributors to U.S. economic growth in the fourth quarter of 2014, according to statistics on the breakout of GDP by industry released today by the Bureau of Economic Analysis (BEA). Both the private goods- and services-producing sectors contributed to the increase, while the government sector decreased. Overall, 15 of 22 industry groups contributed to the 2.2 percent increase in real GDP.
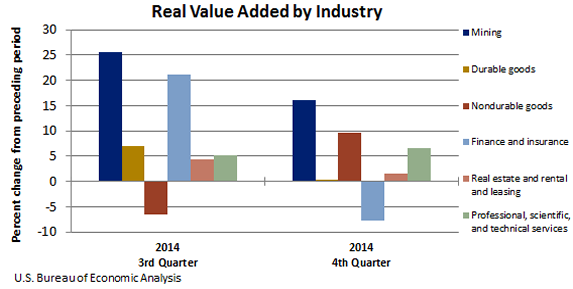
- Nondurable goods manufacturing real value added—a measure of an industry's contribution to GDP—increased 9.7 percent in the fourth quarter, after decreasing 6.6 percent.
- Professional, scientific, and technical services increased 6.5 percent, after increasing 5.2 percent in the third quarter. This was the 7th consecutive quarter of growth for the industry.
- Mining increased 16.0 percent in the fourth quarter, after increasing 25.6 percent.
Other highlights
- Real value added for manufacturing increased 4.5 percent, after increasing 0.5 percent. Durable goods increased 0.3 percent following an increase of 7.0 percent, while nondurable goods increased 9.7 percent.
- Finance and insurance decreased 7.7 percent, after increasing 21.2 percent.
- Real estate and rental and leasing increased 1.5 percent, after increasing 4.4 percent.
Gross output by industry
In addition to statistics on value added, BEA also includes measures of gross output by industry in its quarterly GDP by industry accounts. Real gross output—a measure of an industry's sales or receipts, which includes sales to final users in the economy (GDP) and sales to other industries (intermediate inputs)—increased in 18 of 22 industry groups, reflecting increases from the private goods-producing (0.3 percent) and private services-producing (4.4 percent) sectors.
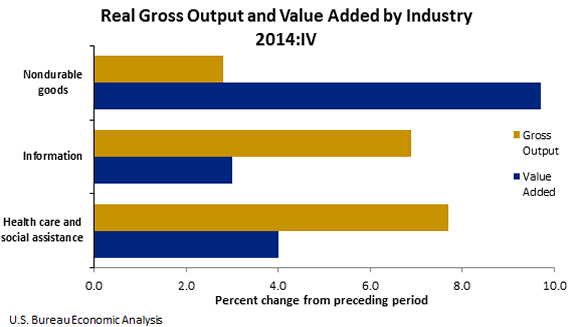
- Nondurable goods manufacturing real gross output increased 2.8 percent, reflecting growth in manufacturers' shipments, while real value added increased 9.7 percent. Intermediate inputs declined 0.3 percent.
- Real gross output for information services increased 6.9 percent, reflecting growth in receipts, marking the largest increase since the fourth quarter of 2013. Real value added increased 3.0 percent.
- Real gross output for private and nonprofit health care and social assistance increased 7.7 percent, reflecting growth in receipts. Real value added increased 4.0 percent, the largest increase since the first quarter of 2013.
2014 GDP by industry
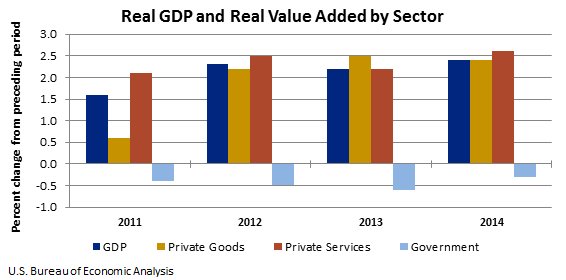
Real GDP increased 2.4 percent in 2014 (that is, from the 2013 annual level to the 2014 annual level). Both the private goods- and services-producing sectors contributed to the increase, while the government sector decreased. Growth was widespread, with 18 of 22 industry groups contributing to the increase. Professional, scientific, and technical services; nondurable goods manufacturing; and real estate and rental and leasing were the leading contributors to the increase in real GDP.
- Professional, scientific, and technical services real value added rose 4.2 percent in 2014, after increasing 0.7 percent in 2013. This was the largest increase since 2008 and the fifth consecutive increase for real value added.
- Nondurable goods manufacturing, which includes food and beverage products manufacturing and petroleum and coal products manufacturing, increased 4.2 percent in 2014. This was the largest increase since 2004.
- Construction decreased 0.7 percent in 2014, after increasing the previous two years. This was the seventh decrease in the past 9 years.
****
BEA's national, international, regional, and industry estimates; BEA news releases; and related articles in the Survey of Current Business are available for free on BEA's Web site at www.bea.gov. The entire historical time series for these estimates can be accessed in BEA's Interactive Data Application at www.bea.gov/itable/. Stay informed about BEA developments by signing up for our email subscription service or following us on Twitter @BEA_News. You also can access BEA data by registering for our Data Application Programming Interface, or API. (www.bea.gov/API/signup/index.cfm).
****
BEA's news release schedule is available at www.bea.gov/newsreleases/2015rd.htm.
Next release -- July 23, 2015 at 8:30 A.M. EDT for:
Gross Domestic Product by Industry: First Quarter 2015