
News Release
Gross Domestic Product by Metropolitan Area, 2016
Professional and Business Services Led Growth Across Metropolitan Areas in 2016
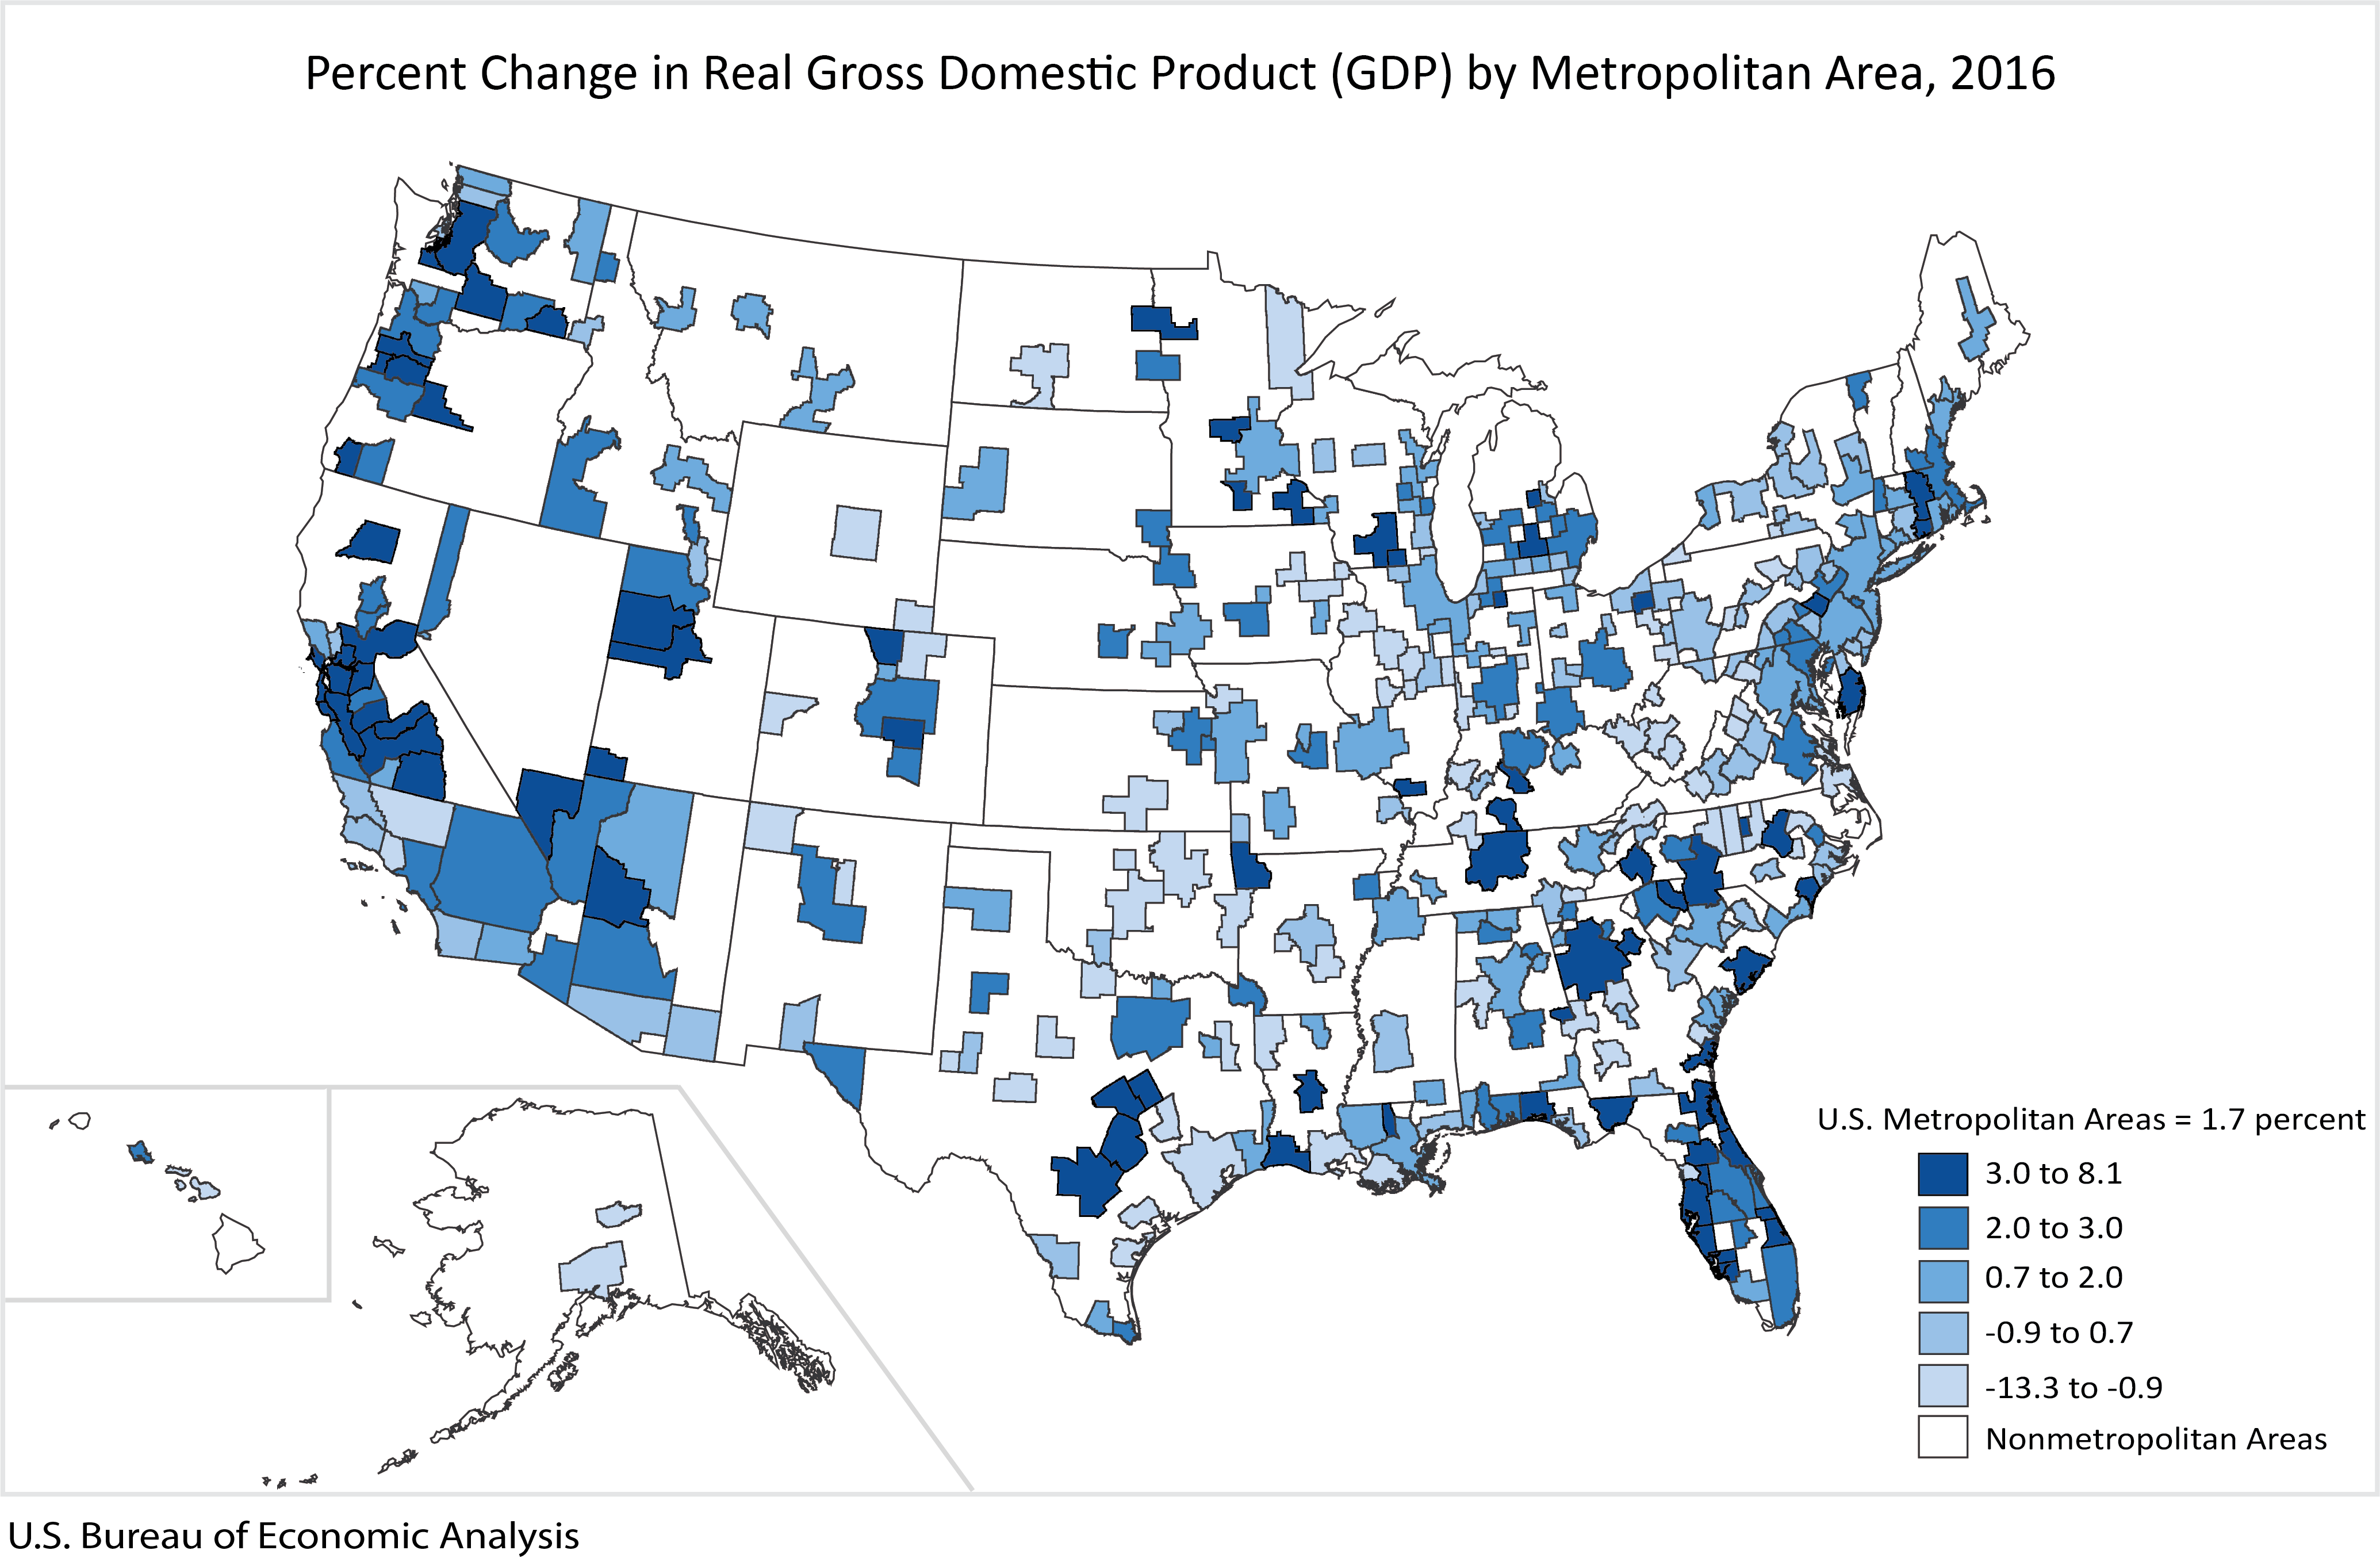
Real gross domestic product (GDP) increased in 267 out of 382 metropolitan areas in 2016 according to statistics on the geographic breakout of GDP released today by the Bureau of Economic Analysis. Real GDP by metropolitan area growth ranged from 8.1 percent in Lake Charles, LA and Bend-Redmond, OR to -13.3 percent in Odessa, TX (table 2).
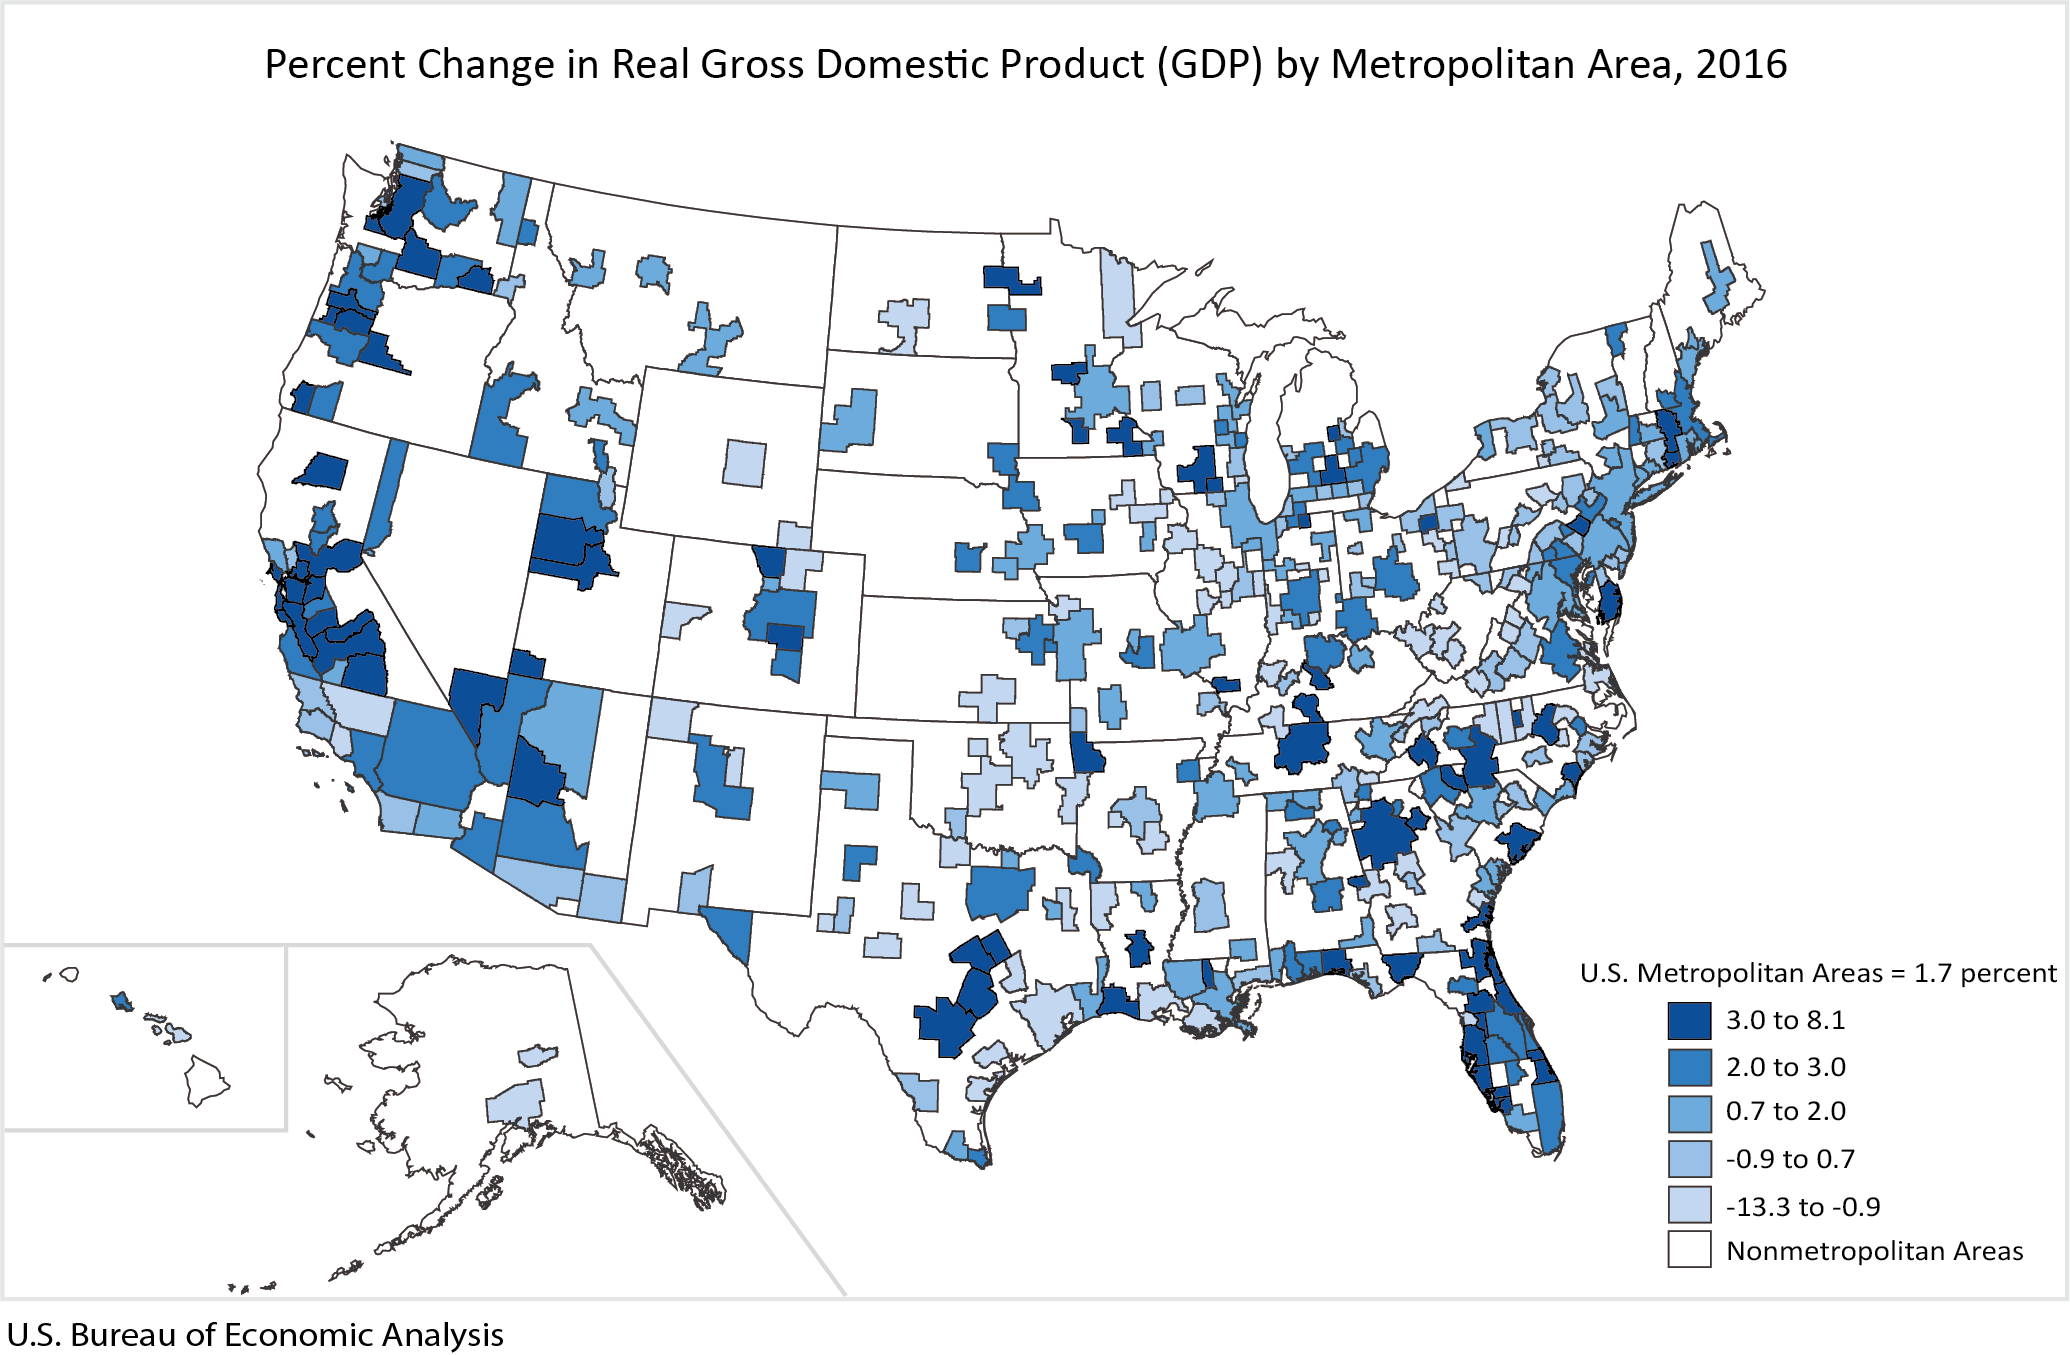
Real GDP for U.S. metropolitan areas grew 1.7 percent in 2016, led by growth in professional and business services; information services; and finance, insurance, real estate, rental, and leasing.
Highlights
- Professional and business services grew 2.7 percent across the nation's metropolitan areas in 2016 (table 3). This industry contributed to growth in 273 metropolitan areas, most notably in Oshkosk-Nennah, WI and Ocala, FL, which grew 2.6 percent and 5.0 percent, respectively.
- Information services grew 6.5 percent. This industry contributed to growth in 260 metropolitan areas, and was the leading contributor to growth in Provo-Orem, UT and Seattle-Tacoma-Bellevue, WA, which grew 6.1 percent and 4.3 percent, respectively.
- Finance, insurance, real estate, rental, and leasing grew 1.2 percent. This industry contributed to growth in 217 metropolitan areas, and made major contributions to growth in Elizabethtown-Fort Knox, KY and Saint Cloud, MN, which grew 4.6 percent and 5.3 percent, respectively.
- Natural resources and mining declined 5.3 percent. This industry subtracted from growth in 169 metropolitan areas. Notable declines in this industry occurred in Odessa, TX (-13.3) and Casper, WY (-11.6).
Large Metropolitan Area Highlights
- Of the large metropolitan areas, those with population greater than two million, San Francisco-Oakland-Hayward, CA (5.4 percent) and Austin-Round Rock, TX (4.9 percent) were the fastest growing metropolitan areas. Real GDP growth in San Francisco-Oakland-Hayward, CA was led by growth in finance, insurance, real estate, rental, and leasing, while growth in Austin-Round Rock, TX was led by professional and business services.
- The only large metropolitan area that declined was Houston-The Woodlands-Sugar Land, TX (-3.0 percent). The real GDP decline in Houston-The Woodlands-Sugar Land, TX was led by a decline in natural resources and mining.
Small Metropolitan Area Highlights
- Of the small metropolitan areas, those with population less than two million, Bend-Redmond, OR (8.1 percent) and Lake Charles, LA (8.1 percent) were the fastest growing metropolitan areas. Bend-Redmond, OR was led by growth in finance, insurance, real estate, rental, and leasing, while Lake Charles, LA was led by growth in nondurable-goods manufacturing.
- The largest declines in real GDP for small metropolitan areas were in Odessa, TX (-13.3 percent) and Casper, WY (-11.6 percent). Natural resources and mining subtracted from growth in each of these metropolitan areas.
Updates to Gross Domestic Product by Metropolitan Area
In addition to the statistics presented in this news release, BEA also revised GDP by metropolitan area statistics for 2001–2015. Updates incorporated revised earnings data from BEA's Local Area Personal Income release published in November 2016.
More metropolitan area highlights can be found on the regional highlights pages that accompany this release.
Next release – September 2018 for: Gross Domestic Product by Metropolitan Area, 2017