
News Release
Arts and Cultural Production Satellite Account, U.S. and States 2015
Arts and Culture Grow for Fourth Straight Year | New State-level Data Available for the First Time
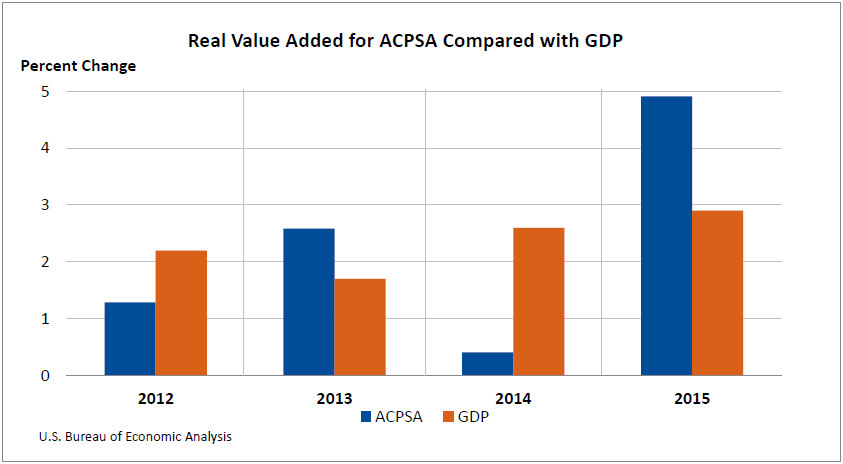
The Arts and Cultural Production Satellite Account (ACPSA) released today by the U.S. Department of Commerce's Bureau of Economic Analysis (BEA) show that arts and cultural economic activity nationwide increased an inflation-adjusted 4.9 percent in 2015. That compares with a 0.4 percent increase in 2014 (table 1). Arts and cultural economic activity accounted for 4.2 percent of gross domestic product (GDP), or $763.6 billion, in 2015 (table 2).
Information services was the leading contributor to the national growth in 2015. Core arts and cultural production industries, including performing arts, design services, fine arts education, and education services, increased 4.9 percent. Supporting arts and cultural production industries, including art support services and information services, increased 4.8 percent.
Real Value Added for Arts and Culture Industries Nationwide
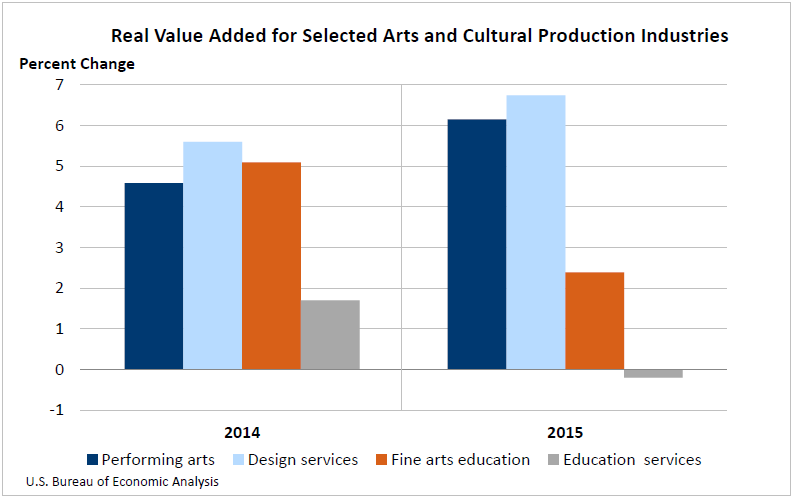
- For the performing arts aggregate, which includes performing arts companies, promoters of performing arts and similar events, agents/managers for artists, independent artists, writers, and performers, real valued added increased 6.2 percent in 2015, after increasing 4.6 percent in 2014. The increase was primarily attributed to an increase in independent artists, writers, and performers.
- For design services, which include seven industries ranging from advertising to all other design services, real value added increased 6.7 percent in 2015, after increasing 5.6 percent. The leading contributor to the increase was architectural services, which increased 10.0 percent.
- Fine arts education services increased 2.4 percent in 2015, after increasing 5.1 percent.
- Education services decreased 0.2 percent in 2015, after increasing 1.7 percent.
Nominal Value Added. Nominal value added (not adjusted for inflation) increased 6.3 percent nationally in 2015 (table 2). It increased 8.1 percent in the core arts and cultural production industries, to a level of $153.0 billion. The increase was primarily attributed to an increase in design services, which include advertising and architectural services (table 3).
Nominal value added increased 5.9 percent in the supporting arts and cultural production industries, to a level of $583.8 billion. The increase was primarily attributed to an increase in information services, which include the motion pictures and broadcasting industries.
Today's release marks the first time BEA has released statistics on arts and cultural value added for all 50 states and the District of Columbia. The arts and cultural share of total value added ranged from 8.4 percent in the District of Columbia to 1.3 percent in Delaware.
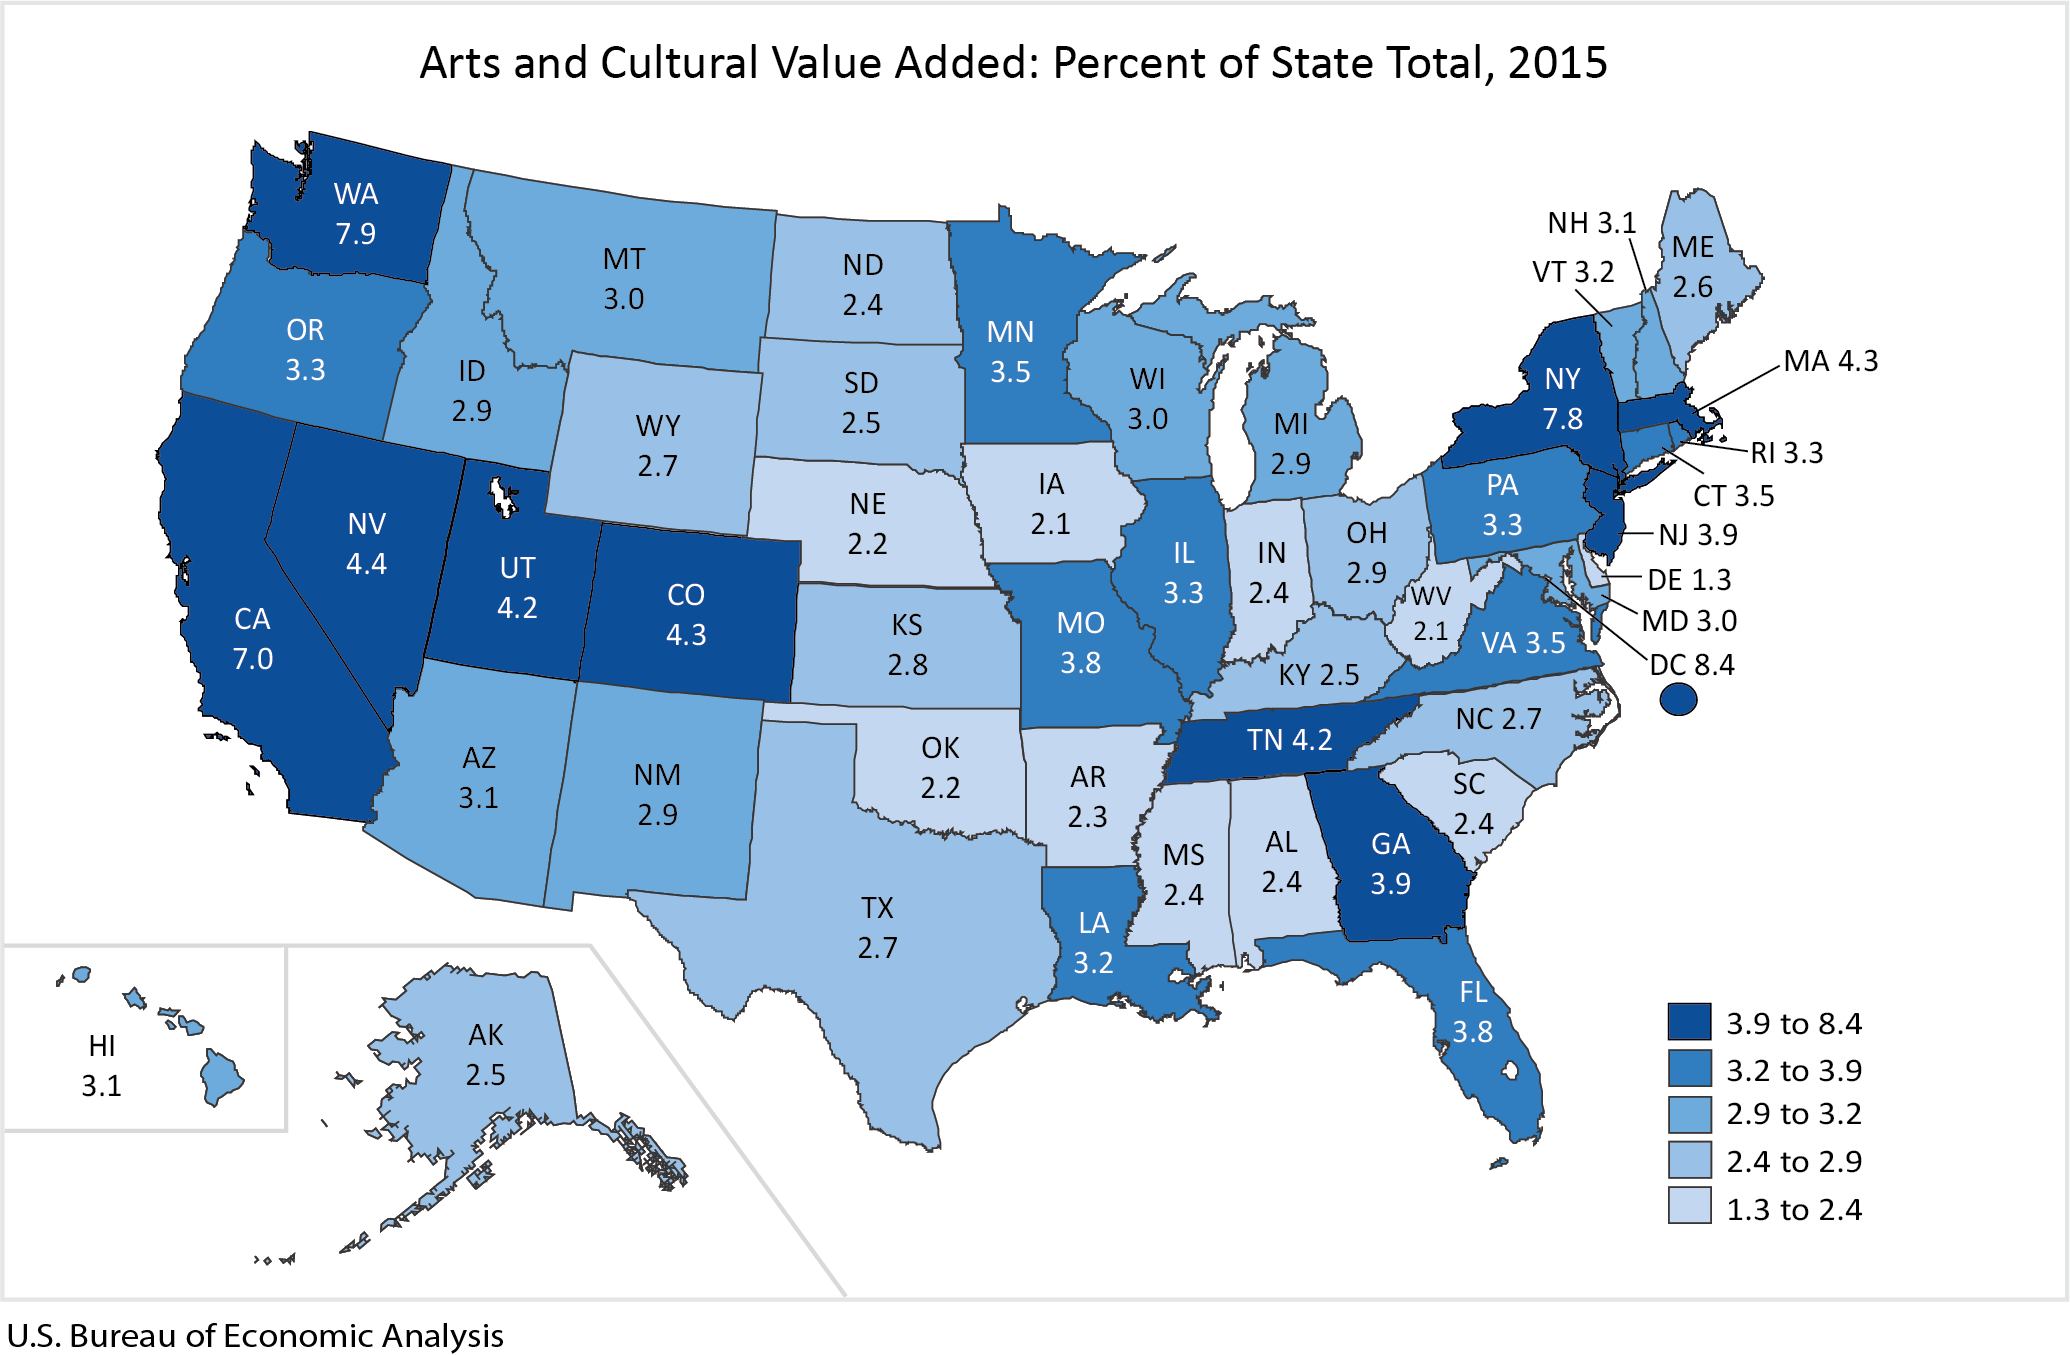
The top arts and cultural industries vary among the states. The top industries in the District of Columbia are government, broadcasting, and advertising (table 3). In New York, the top industries are motion pictures, broadcasting, and government. In California, the top industries are motion pictures, other information services, and broadcasting.
Value added in arts and cultural industries increased in 45 states and the District of Columbia in 2015. The percent change in value added in arts and cultural industries across all states ranged from 12.6 percent in Missouri to -5.9 percent in Kansas in 2015 (table 4).
- The broadcasting industry led growth in Missouri, Idaho, Florida, and Utah.
- The motion pictures industry led growth in Louisiana.
Employment. Arts and cultural employment nationwide increased 2.1 percent in 2015 (table 8). The total number of arts and cultural jobs for the nation was 4.92 million. Arts and cultural employment increased in 37 states and the District of Columbia. The percent change in arts and cultural employment across all states ranged from 5.5 percent in Georgia to -3.4 percent in Oklahoma.
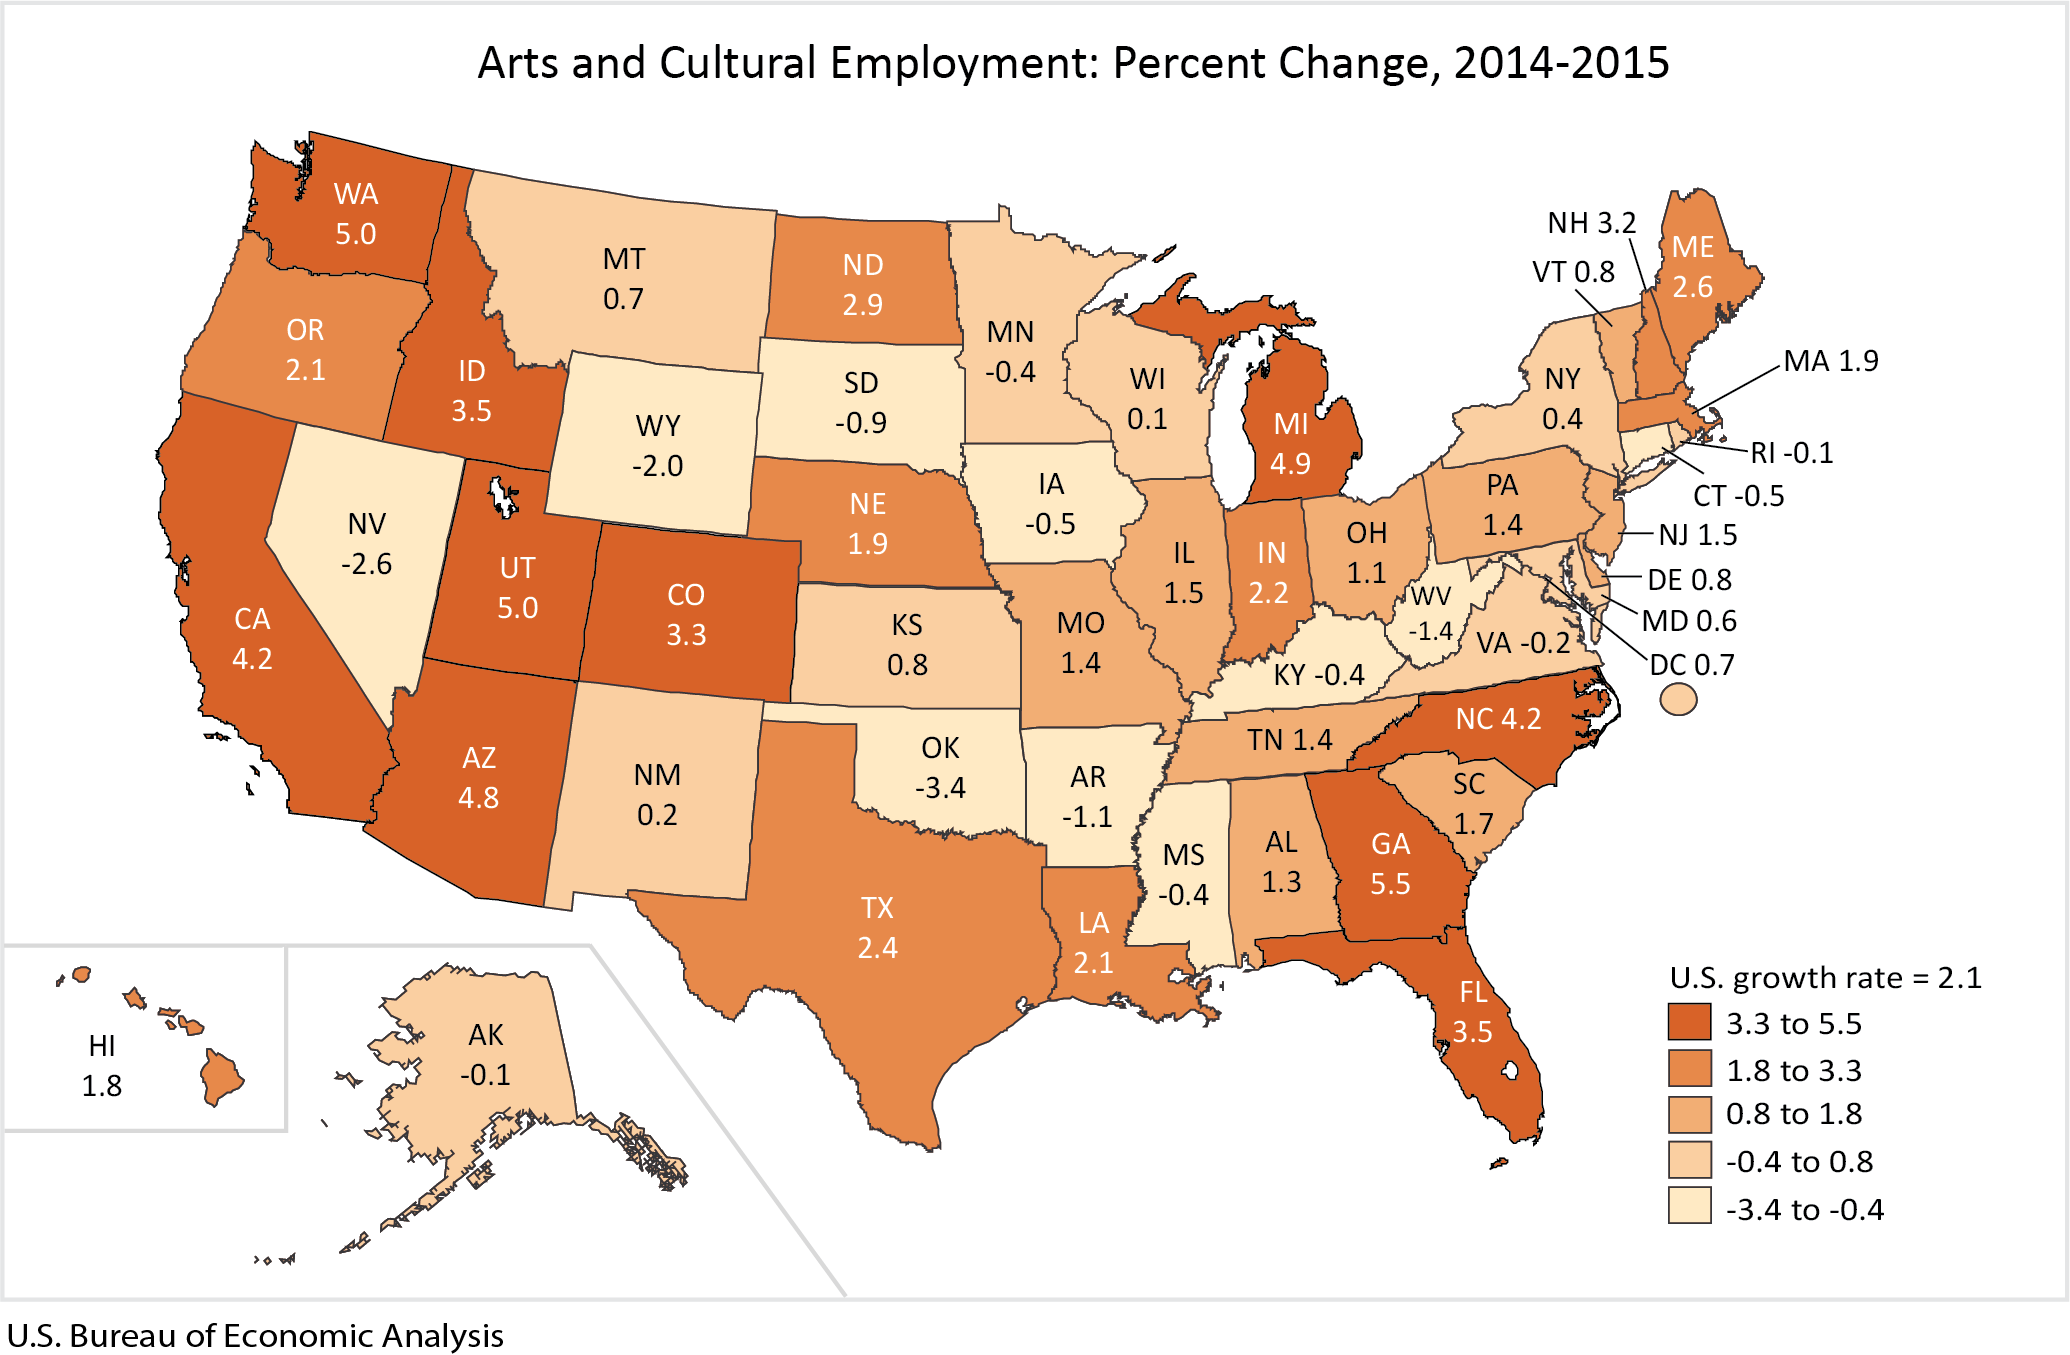
Arts and cultural employment increased faster in Georgia than in any other state in 2015. Georgia had 133,960 jobs related to arts and culture, representing 3.1 percent of all jobs in the state. The motion pictures industry was the leading contributor to the increase in total arts and cultural employment in Georgia (table 9).
Updates to the Arts and Cultural Production Satellite Account. Today, BEA also released updated estimates of output, value added, intermediate inputs, employment, and compensation for 2013 and 2014. The updated statistics incorporate the most recent data from BEA's Industry and Regional Economic Accounts.
Important Notice. BEA's Arts and Cultural Production Satellite Account (ACPSA) is supported by funding from the National Endowment for the Arts (NEA).
This release makes available, for the first time, prototype estimates of ACPSA state value added for 2001 to 2015. The estimates are being released for evaluation and comment, and BEA requests suggestions for refinement and improvement. Comments can be addressed to artsandculture@bea.gov.