
News Release
CNMI GDP Increases in 2017
Growth led by tourism and gaming industry revenues
CAPITOL HILL, SAIPAN (October 18, 2018) -- Today, the Bureau of Economic Analysis (BEA) is releasing estimates of gross domestic product (GDP) for the Commonwealth of the Northern Mariana Islands (CNMI) for 2017, in addition to estimates of GDP by industry and compensation by industry for 2016.1 These estimates were developed under the Statistical Improvement Program funded by the Office of Insular Affairs (OIA) of the U.S. Department of the Interior.
Revised estimates of GDP for 2013 to 2016, as well as revised estimates of GDP by industry and compensation by industry for 2013 to 2015, are also presented in this release.
Gross Domestic Product for 2017
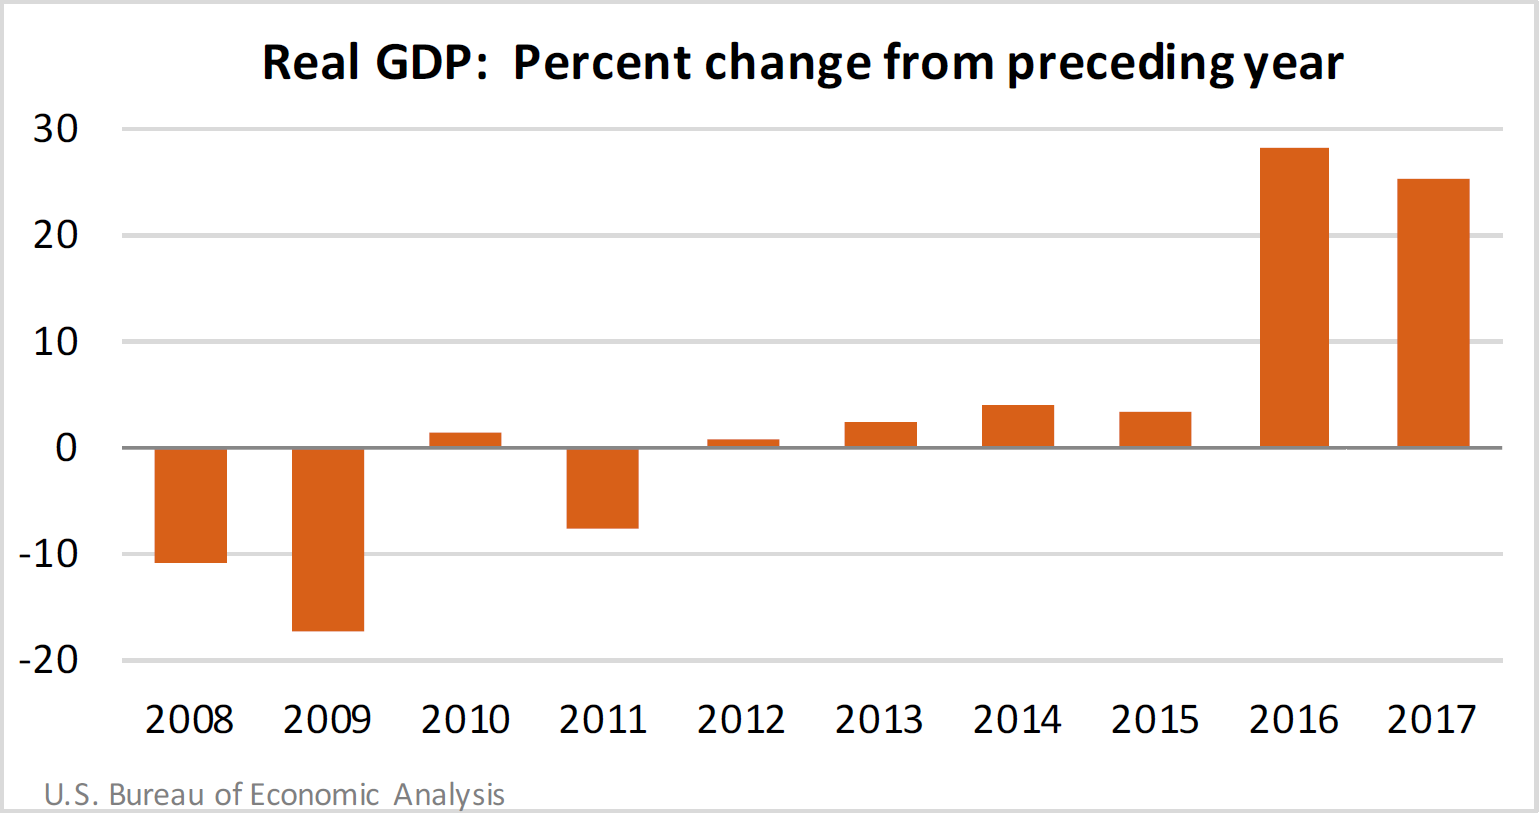
The estimates of GDP for the CNMI show that real GDP—GDP adjusted to remove price changes—increased 25.1 percent in 2017 after increasing 28.2 percent in 2016 (see Table 1.3). For comparison, real GDP for the United States (excluding the territories) increased 2.2 percent in 2017 after increasing 1.6 percent in 2016.
The largest contributor to growth in the CNMI economy was exports of services (see Table 1.4). The increase in exports of services reflected continued growth in visitor spending, particularly on casino gambling. The number of visitors to the CNMI grew 24 percent in 2017, following an increase of 11 percent in 2016.
Partly offsetting the growth in exports of services was a decline in private fixed investment, which decreased 8.9 percent after three consecutive years of double-digit growth. However, real business spending on construction and equipment remained at historically high levels, supported by continued development of the casino resort on Saipan (see Table 1.2).
Gross Domestic Product by Industry and Compensation by Industry for 2016
The estimates of GDP by industry for the CNMI show that the private sector was the source of the growth in real GDP in 2016 (see Table 2.5). The largest contributor to growth was the accommodations and amusement sector, reflecting growth in tourism and output of the casino industry.
The compensation by industry estimates, which are measured in current dollars, show trends in compensation for major industries (see Table 2.6). Total compensation increased in 2016, reflecting increases in all sectors shown in the table. The largest increase was in the accommodations and amusement sector.
The accompanying tables present estimates for GDP and its major components, GDP by industry, and compensation by industry. Also included in this release are estimates for the major components of gross domestic income.
Revisions to GDP
Estimates for 2013 to 2016 that were released on October 16, 2017 have been revised in order to incorporate improvements to source data, including:
- newly available data for territorial government spending from government financial statements,
- updated international trade data provided by the CNMI government, and
- the 2016 CNMI Consumer Price Index.
The revised estimates show a similar pattern of inflation-adjusted growth as the previously published estimates (see Table 1.7).
Future directions
Moving forward, an agreement between OIA and BEA will extend and improve the estimates of GDP for the CNMI. The information provided by the CNMI government will continue to be critical to the successful production of these estimates.
BEA currently plans to release GDP estimates for 2018 beginning in the summer of 2019. GDP by industry and compensation by industry estimates for 2017 will also be released at the same time.
1 These estimates are based on limited source data and are subject to revision.