
News Release
Direct Investment by Country and Industry, 2017
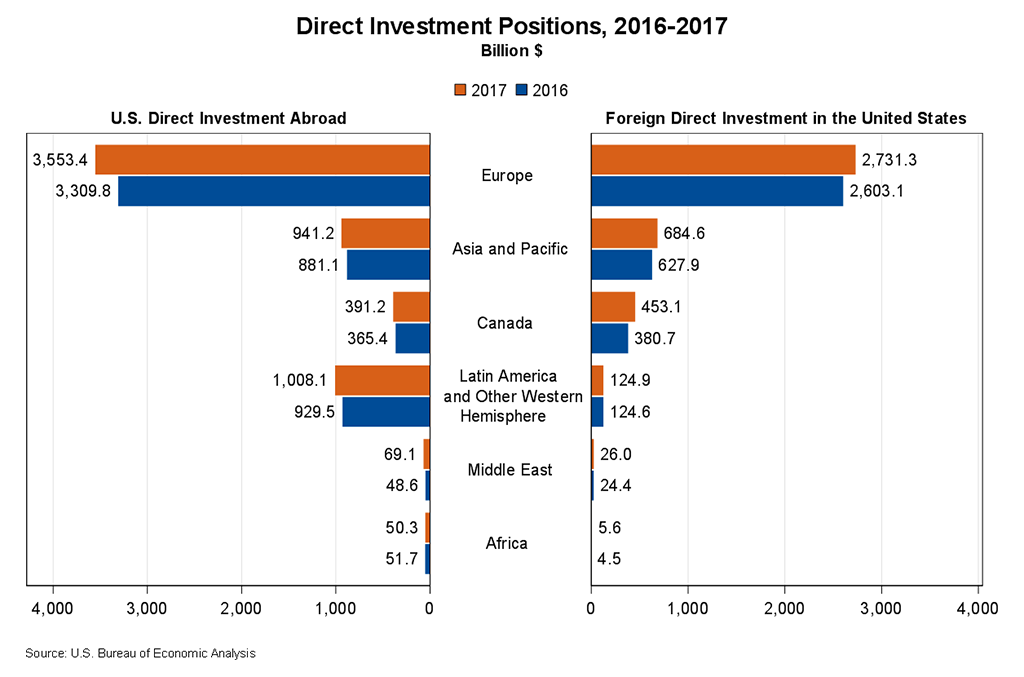
The U.S. direct investment abroad position, or cumulative level of investment, increased $427.3 billion to $6,013.3 billion at the end of 2017 from $5,586.0 billion at the end of 2016, according to statistics released by the Bureau of Economic Analysis (BEA). The increase mainly reflected a $243.6 billion increase in the position in Europe, primarily in Switzerland, the United Kingdom, Ireland, and the Netherlands. By industry, affiliates in manufacturing and holding companies accounted for the largest increases.
The foreign direct investment in the United States position increased $260.4 billion to $4,025.5 billion at the end of 2017 from $3,765.1 billion at the end of 2016. The increase mainly reflected a $128.2 billion increase in the position from Europe, primarily Ireland, Switzerland, and the Netherlands. By industry, affiliates in manufacturing and wholesale trade accounted for the largest increases.
The increase in the U.S. direct investment position abroad in 2017 mainly reflected financial transactions of $300.4 billion, primarily reinvestment of earnings. The increase in the foreign direct investment position in the United States in 2017 mainly reflected financial transactions of $277.3 billion, primarily equity investment other than reinvestment of earnings.
U.S. direct investment abroad (tables 1 – 4)
U.S. multinational enterprises (MNEs) invest in nearly every country, but their investment in foreign affiliates in five countries accounted for more than half of the total position at the end of 2017. The U.S. direct investment abroad position was largest in the Netherlands at $936.7 billion, followed by the United Kingdom ($747.6 billion), Luxembourg ($676.4 billion), Ireland ($446.4 billion), and Canada ($391.2 billion).
By industry of the immediate foreign affiliate, investment was highly concentrated in holding companies, which accounted for nearly half of the position in 2017. By industry of the U.S. parent, investment by manufacturing MNEs accounted for 55.6 percent of the position, followed by MNEs in finance and insurance (12.4 percent).
U.S. MNEs earned income of $470.9 billion on their investment abroad in 2017.
Foreign direct investment in the United States (tables 5 – 8)
By country of the immediate foreign parent, five countries accounted for more than half of the total position at the end of 2017. The United Kingdom was the top investing country with a position of $540.9 billion, followed by Japan ($469.0 billion), Canada ($453.1 billion), Luxembourg ($410.7 billion), and the Netherlands ($367.1 billion).
By country of the ultimate beneficial owner (UBO), the top five countries in terms of position were the United Kingdom ($614.9 billion), Canada ($523.8 billion), Japan ($476.9 billion), Germany ($405.6 billion), and Ireland ($328.7 billion). On this basis, investment from the Netherlands and Luxembourg was much lower than by country of foreign parent, indicating that much of the investment from these countries was ultimately owned by investors in other countries.
Foreign direct investment in the United States was concentrated in the U.S. manufacturing sector, which accounted for 39.9 percent of the position. There was also sizable investment in finance and insurance (13.4 percent).
Foreign MNEs earned income of $173.8 billion on their investment in the United States in 2017.
Updates to Direct Investment Statistics
BEA statistics for U.S. direct investment abroad for 2014–2016 and for foreign direct investment in the United States for 2015–2016 are revised to incorporate newly available and revised source data, including results of the 2014 benchmark survey of U.S. direct investment abroad. For more information on the benchmark survey, see "Worldwide Activities of U.S. Multinational Enterprises: Revised Results From the 2014 Benchmark Survey."
Next release: July 2019
Direct Investment by Country and Industry: 2018