
News Release
Gross Domestic Product, 2nd quarter 2018 (advance estimate), and comprehensive update
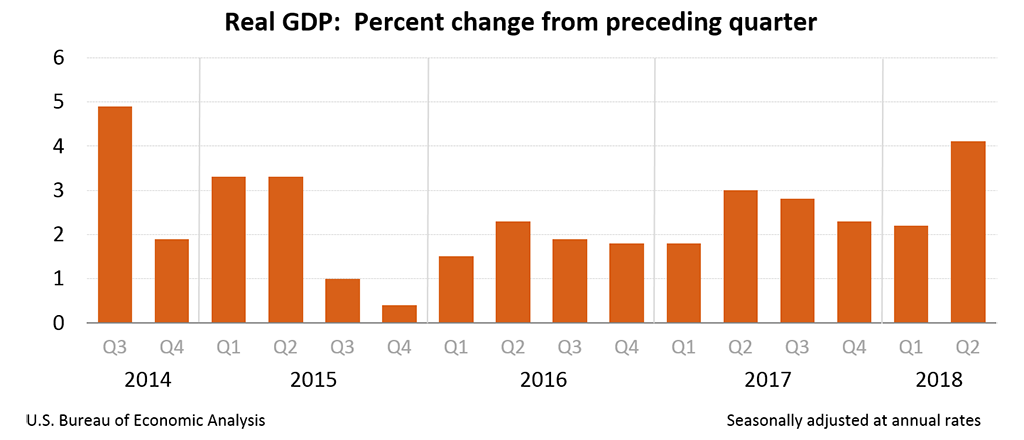
Real gross domestic product increased at an annual rate of 4.1 percent in the second quarter of 2018 (table 1), according to the "advance" estimate released by the Bureau of Economic Analysis. In the first quarter, real GDP increased 2.2 percent (revised).
The Bureau emphasized that the second-quarter advance estimate released today is based on source data that are incomplete or subject to further revision by the source agency (see "Source Data for the Advance Estimate" on page 2). The "second" estimate for the second quarter, based on more complete data, will be released on August 29, 2018.
The increase in real GDP in the second quarter reflected positive contributions from personal consumption expenditures (PCE), exports, nonresidential fixed investment, federal government spending, and state and local government spending that were partly offset by negative contributions from private inventory investment and residential fixed investment. Imports, which are a subtraction in the calculation of GDP, increased (table 2).
The acceleration in real GDP growth in the second quarter reflected accelerations in PCE and in exports, a smaller decrease in residential fixed investment, and accelerations in federal government spending and in state and local spending. These movements were partly offset by a downturn in private inventory investment and a deceleration in nonresidential fixed investment. Imports decelerated.
Current-dollar GDP increased 7.4 percent, or $361.5 billion, in the second quarter to a level of $20.4 trillion. In the first quarter, current-dollar GDP increased 4.3 percent, or $209.2 billion (table 1 and table 3A).
The price index for gross domestic purchases increased 2.3 percent in the second quarter, compared with an increase of 2.5 percent in the first quarter (table 4). The PCE price index increased 1.8 percent, compared with an increase of 2.5 percent. Excluding food and energy prices, the PCE price index increased 2.0 percent, compared with an increase of 2.2 percent (table 4).
Personal Income (table 8)
Current-dollar personal income increased $183.7 billion in the second quarter, compared with an increase of $215.8 billion in the first quarter. Decelerations in wages and salaries, government social benefits, personal interest income, and nonfarm proprietors' income were partly offset by accelerations in personal dividend income and rental income, a deceleration in contributions for government social insurance (a subtraction in the calculation of personal income), and an upturn in farm proprietors’ income.
Disposable personal income increased $167.5 billion, or 4.5 percent, in the second quarter, compared with an increase of $256.7 billion, or 7.0 percent, in the first quarter. Real disposable personal income increased 2.6 percent, compared with an increase of 4.4 percent.
Personal saving was $1,051.1 billion in the second quarter, compared with $1094.1 billion in the first quarter. The personal saving rate -- personal saving as a percentage of disposable personal income -- was 6.8 percent in the second quarter, compared with 7.2 percent in the first quarter.
Source Data for the Advance Estimate
Information on the source data and the key assumptions used for unavailable source data in the advance estimate is provided in a Technical Note that is posted with the news release on BEA’s Web site. A detailed "Key Source Data and Assumptions" file is also posted for each release. For information on updates to GDP, see the "Additional Information" section that follows.
Comprehensive Update of the National Income and Product Accounts
Comprehensive updates of the National Income and Product Accounts (NIPAs), which are carried out about every five years, are an important part of BEA’s regular process for improving and modernizing its accounts to keep pace with the ever-changing U.S. economy. Updates incorporate newly available and more comprehensive source data, as well as improved estimation methodologies. The timespan for this year's comprehensive update is 1929 through the first quarter 2018.
With today's release of these updated statistics, most NIPA tables are available on BEA's Web site (www.bea.gov). A complete schedule of the table release plan is also available on BEA’s Web site. An article describing the results will be published in the September 2018 issue of BEA’s monthly journal, the Survey of Current Business.
Updates for the first quarter of 2018
For the first quarter of 2018, real GDP is now estimated to have increased 2.2 percent (table 1); in the previously published estimates, first-quarter GDP was estimated to have increased 2.0 percent. The 0.2- percentage point upward revision to the percent change in first-quarter real GDP primarily reflected upward revisions to private inventory investment, nonresidential fixed investment, and federal government spending that were partly offset by downward revisions to PCE and residential fixed investment. Imports were revised down.
Real GDI is now estimated to have increased 3.9 percent in the first quarter (table 1); in the previously published estimates, first-quarter GDI was estimated to have increased 3.6 percent.
| First Quarter 2018 | |||||
|---|---|---|---|---|---|
| Previous Estimate | Revised | ||||
| (Percent change from preceding quarter) | |||||
| Real GDP | 2.0 | 2.2 | |||
| Current-dollar GDP | 4.2 | 4.3 | |||
| Real GDI | 3.6 | 3.9 | |||
| Average of Real GDP and GDI | 2.8 | 3.1 | |||
| Gross domestic purchases price index | 2.7 | 2.5 | |||
| PCE price index | 2.5 | 2.5 | |||
Summary of historical updates
The picture of the economy presented in the updated estimates is very similar to the picture presented in the previously published estimates.
- For 1929–2012, the average annual growth rate of real GDP was 3.2 percent, unrevised from the previously published estimates. For the more recent period, 2007–2017, the growth rate was 1.5 percent, 0.1 percentage point higher than in the previously published estimates.
- For 2012–2017, the average annual growth rate of real GDP was 2.2 percent, the same as in the previously published estimates. The percent change in real GDP was unrevised for 2012; revised up 0.1 percentage point for 2013; revised down 0.1 percentage point for 2014; unrevised for 2015; revised up 0.1 percentage point for 2016; and revised down 0.1 percentage point for 2017.
- For 2012–2017, the average rate of change in the prices paid by U.S. residents, as measured by the gross domestic purchasers’ price index, was 1.2 percent, 0.1 percentage point lower than in the previously published estimates.
- For the period of contraction from the fourth quarter of 2007 to the second quarter of 2009, real GDP decreased at an average annual rate of 2.7 percent; in the previously published estimates, it decreased 2.8 percent.
- For the period of expansion from the second quarter of 2009 to the first quarter of 2018, real GDP increased at an average annual rate of 2.2 percent, the same as previously published.
Improvements incorporated in this comprehensive update
Comprehensive updates encompass three major types of improvements:
- Changes in definitions and in classifications that update the accounts to more accurately portray the evolving U.S. economy,
- Changes in presentations that make the NIPA tables more informative, and
- Statistical changes that introduce new and improved methodologies and that bring in newly available and revised source data (see box below).
The improvements incorporated in the updated estimates were previewed in an article the April 2018 Survey of Current Business. Additional information regarding improvements introduced as part of the 2018 Comprehensive Update, including background materials and presentational changes, is available on BEA's Web site.
Changes in definitions, classifications, and presentations
The changes in definitions, in classifications, and in presentations introduced in this comprehensive update include the following:
- Expenditures for research and development (R&D) for software are reclassified from fixed investment in own-account software to fixed investment in R&D. The new treatment resolves an inconsistency between the NIPA measures and the primary source data underlying the estimates of investment in R&D and allows users to better understand the effects of innovation and intangible assets on the economy.
- The accuracy of measures of intangible investment is improved by incorporating the value of the return to fixed capital into the estimates of own account investment in software and R&D, consistent with international guidelines.
- Payments by the Federal Reserve banks to the U.S. government are reclassified from taxes on corporate income to dividend payments. This reclassification will improve the consistency of the NIPAs with international guidelines and with the practices of other countries.
- A new presentation of the estimates of federal and state and local government investment in structures for 1929–1996 is consistent with the estimates beginning in 1997.
- Updated tables present an improved, expanded presentation of taxes on production and imports.
- Updated descriptions of selected series in personal consumption expenditures (PCE) are introduced to better reflect the rapidly changing digital economy.
- The reference year for the chain-type quantity and price indexes and for the chained-dollar estimates is updated to 2012 from 2009.
Statistical changes. Important statistical changes that introduce new and improved methodologies and that bring in newly available source data include the following:
- BEA’s 2012 benchmark input-output (I-O) accounts, which incorporate results of the 2012 Economic Census and provide the most thorough and detailed information on the structure of the U.S. economy, are used to benchmark the expenditure components of GDP.
- Additional improvements to seasonal adjustment procedures are introduced, reflecting the findings of BEA’s detailed review of the components of GDP and gross domestic income (GDI). The revised NIPA estimates reflect updates to seasonal factors for 2002 forward, as well as updates to a more limited set of seasonal factors prior to 2002. An article in the August Survey of Current Business will describe BEA’s latest research on seasonal adjustment in GDP and GDI.
- BEA now provides quarterly estimates of GDP, GDI, and their major components that are not seasonally adjusted. These statistics are available in new tables in “Section 8: Not Seasonally Adjusted Estimates” of the NIPA tables presented in the interactive data application on BEA’s Web site.
- Improved price indexes for software, medical equipment, and communications equipment are incorporated into BEA’s estimates. The improved price indexes reflect recent research on rapid innovations and quality improvements of these products and provide a more accurate measure of their contribution to growth and productivity.
Footnote 1. See Moulton and Cowan, "Residual Seasonality in GDP and GDI: Findings and Next Steps" in the July 2016 Survey.
- More accurate current-dollar estimates of private investment in information and communications technology.
- Improved methods for measuring the implicit output of savings institutions and credit unions are introduced. The updated estimates are consistent with the methodology used for estimating the implicit output of commercial banks and provide a better measure of the activities of the financial sector.
- The treatment of state and local government defined pension plans is now harmonized with the treatment of federal plans; both plans are now measured using a similar, consistent approach.
Real GDP (Table 1A)
The updated statistics largely reflect the incorporation of newly available and revised source data (see the box below) and improvements to existing methodologies.
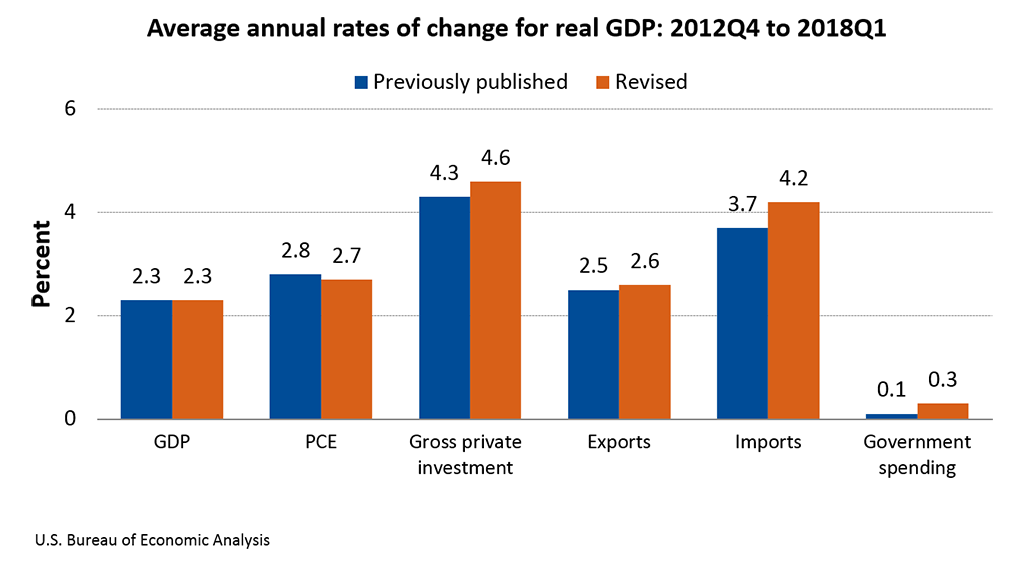
- From 2012 to 2017, real GDP increased at an average annual rate of 2.2 percent, the same as previously published. From the fourth quarter of 2012 to the first quarter of 2018, real GDP increased at an average annual rate of 2.3 percent, the same as in the previously published estimates.
- For 2012, real GDP growth was unrevised. Upward revisions to nonresidential fixed investment and inventory investment were offset by an upward revision to imports and by a downward revision to state and local government spending.
- For 2013, real GDP growth was revised up 0.1 percentage point. Upward revisions to nonresidential fixed investment, state and local government spending, inventory investment, and federal government spending were partly offset by an upward revision to imports.
- For 2014, real GDP growth was revised down 0.1 percentage point. An upward revision to imports and downward revisions to inventory investment and state and local government spending were partly offset by upward revisions to nonresidential fixed investment.
- For 2015, real GDP growth was unrevised. Upward revisions to state and local government spending, personal consumption expenditures (PCE), exports, and inventory investment were offset by an upward revision to imports and by a downward revision to nonresidential fixed investment.
- For 2016, real GDP growth was revised up 0.1 percentage point. Upward revisions to nonresidential fixed investment, state and local government spending, residential investment, exports, and federal government spending were partly offset by a downward revision to inventory investment and by an upward revision to imports.
- For 2017, real GDP growth was revised down 0.1 percentage point. A downward revision to PCE, an upward revision to imports, and downward revisions to state and local government spending and exports were partly offset by upward revisions to inventory investment, nonresidential fixed investment, residential investment, and federal government spending.
- From the first quarter of 2012 through the fourth quarter of 2017, the average revision (without regard to sign) in the percent change in real GDP was 0.4 percentage point. The revisions did not change the direction of the change in real GDP (increase or decrease) for any of these quarters.
- Current-dollar GDP was revised up for all years from 2012 to 2017: by $41.8 billion, or 0.3 percent, for 2012; $93.3 billion, or 0.6 percent, for 2013; $94.1 billion, or 0.5 percent, for 2014, $98.6 billion, or 0.5 percent, for 2015, $82.7 billion, or 0.4 percent, for 2016, and $94.8 billion, or 0.5 percent, for 2017.
Gross domestic income (GDI) and the statistical discrepancy (Table 1A)
- From 2012 to 2017, real GDI increased at an average annual rate of 2.0 percent, unrevised from the previous estimate. From the fourth quarter of 2012 to the fourth quarter of 2017, real GDI increased at an average annual rate of 2.1 percent; in the previously published estimates, real GDI increased at an average annual rate of 2.0 percent.
- The statistical discrepancy as a percentage of GDP was revised from -1.3 percent to -1.5 percent for 2012; was revised from -0.8 percent to -1.0 percent for 2013; was revised from -1.3 percent to -1.7 percent for 2014; was unrevised at -1.4 percent for 2015; was revised from -0.8 percent to -0.7 percent for 2016; and was revised from -0.2 percent to -0.7 percent for 2017.
- The average of GDP and GDI is a supplemental measure of U.S. economic activity. In real, or inflation-adjusted, terms this measure increased at an average annual rate of 2.1 percent from 2012 to 2017, the same as previously published.
Price measures (Table 4)
- Gross domestic purchases - From the fourth quarter of 2012 to the fourth quarter of 2017, the average annual rate of increase in the price index for gross domestic purchases was 1.2 percent, 0.1 percentage point lower than the previously published estimates.
- Personal consumption expenditures - From the fourth quarter of 2012 to the fourth quarter of 2017, the average annual rate of increase in the price index for PCE was 1.2 percent, the same as previously published. The increase in the “core” PCE price index, which excludes food and energy, was 1.6 percent, 0.1 percentage point higher than previously published.
Income and saving measures (Table 1A)
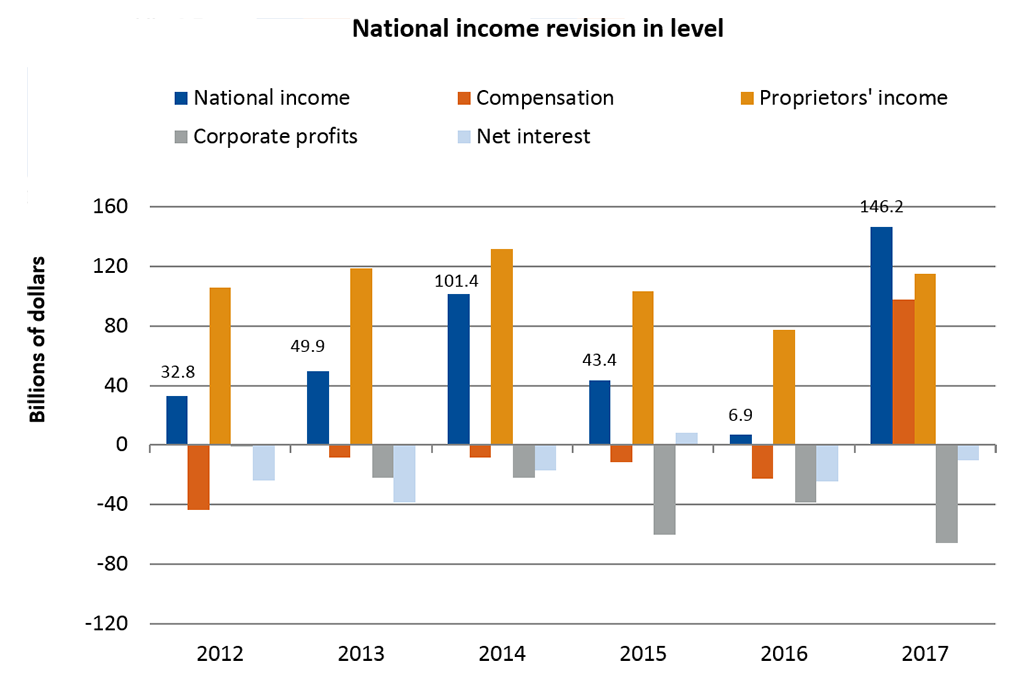
- National income was revised up $32.8 billion, or 0.2 percent, for 2012; was revised up $49.9 billion, or 0.3 percent, for 2013; was revised up $101.4 billion, or 0.7 percent, for 2014; was revised up $43.4 billion, or 0.3 percent, for 2015; was revised up $6.9 billion, or less than 0.1 percent, for 2016; and was revised up $146.2 billion, or 0.9 percent, for 2017.
- For 2012, an upward revision to proprietors’ income was partly offset by downward revisions to supplements to wages and salaries and to net interest.
- For 2013, upward revisions to proprietors’ income and to taxes on production and imports were partly offset by downward revisions to net interest, corporate profits, and rental income.
- For 2014, upward revisions to proprietors’ income and to taxes on production and imports were partly offset by downward revisions to corporate profits and net interest.
- For 2015, upward revisions to proprietors’ income and to taxes on production and imports were partly offset by downward revisions to corporate profits and rental income.
- For 2016, upward revisions to proprietors’ income and to taxes on production and imports were partly offset by downward revisions to corporate profits, net interest, supplements to wages and salaries and rental income.
Footnote 2. The statistical discrepancy is current dollar GDP less current dollar GDI. GDP measures final expenditures -- the sum of consumer spending, private investment, net exports, and government spending. GDI measures the incomes earned in the production of GDP. In concept, GDP is equal to GDI. In practice, they differ because they are estimated using different source data and different methods.
- For 2017, upward revisions to proprietors’ income, wages and salaries, and taxes on production and imports were partly offset by downward revisions to corporate profits, rental income, and net interest.
- Corporate profits was revised down $0.8 billion, or less than 0.1 percent, for 2012; was revised down $22.2 billion, or 1.1 percent, for 2013; was revised down $21.7 billion, or 1.0 percent, for 2014; was revised down $60.2 billion, or 2.8 percent, for 2015; was revised down $38.5 billion, or 1.9 percent, for 2016; and revised down $65.4 billion, or 3.0 percent, for 2017.
- Personal income was revised up $95.0 billion, or 0.7 percent, for 2012; was revised up $107.4 billion, or 0.8 percent, for 2013; was revised up $173.6 billion, or 1.2 percent, for 2014; was revised up $166.6 billion, or 1.1 percent, for 2015; was revised up $196.4 billion, or 1.2 percent, for 2016; and was revised up $401.9 billion, or 2.4 percent, for 2017.
- From 2012 to 2017, the average annual rate of growth of real disposable personal income was revised up 0.4 percentage point from 1.8 percent to 2.2 percent.
- The personal saving rate (personal saving as a percentage of disposable personal income) was revised up from 7.6 percent to 8.9 percent for 2012; was revised up from 5.0 percent to 6.4 percent for 2013; was revised up from 5.7 percent to 7.3 percent for 2014; was revised up from 6.1 percent to 7.6 percent for 2016; was revised up from 4.9 percent to 6.7 percent for 2016; and was revised up from 3.4 percent to 6.7 percent for 2017.
New and revised source data
The updated statistics incorporated data from the following major federal statistical sources:
Agency/Data                                               Years Covered and Vintage
Census Bureau
Annual capital expenditures survey                        2015 (revised); 2016 (new)
Annual wholesale trade survey                             2008-2015 (revised); 2016 (new)
Annual retail trade survey                                2011-2015 (revised); 2016 (new)
Annual survey of manufactures                             2015 (revised); 2016 (new)
Monthly indicators of manufactures, merchant
   wholesale trade, and retail trade                      2008–2017 (revised)
Service annual survey                                     2015 and 2016 (revised); 2017 (new)
Annual surveys of state and local government finances     Fiscal year (FY) 2015 (revised); FY 2016 (new)
Monthly survey of construction spending (value put in
place)                                                    2013–2017 (revised)
Quarterly services survey                                 2014–2017(revised)
Current population survey/housing vacancy survey          2015 and 2016 (revised); 2017 (new)

Office of Management and Budget Federal Budget            Fiscal years 2017 and 2018

Internal Revenue Service
Tabulations of tax returns for corporations               2015 (revised)
Tabulations of tax returns for sole proprietorships and
partnerships                                              2016 (new)

BLS
Quarterly census of employment and wages                  2016–2017 (revised)
Survey of occupational employment                         2017 (new)

Department of Agriculture Farm statistics                 2008–2017 (revised)

BEA
International transactions accounts                       1999-2017 (revised)
Next release: August 29, 2018 at 8:30 A.M. EDT
Gross Domestic Product: Second Quarter 2018 (Second Estimate)
Corporate Profits: Second Quarter 2018 (Preliminary Estimate)