
News Release
Guam GDP Increases in 2017
Consumer spending increases for the 7th year in a row
HAGÅTÑA, GUAM (November 14, 2018) -- Today, the Bureau of Economic Analysis (BEA) is releasing estimates of gross domestic product (GDP) for Guam for 2017, in addition to estimates of GDP by industry and compensation by industry for 2016.1 These estimates were developed under the Statistical Improvement Program funded by the Office of Insular Affairs (OIA) of the U.S. Department of the Interior.
Revised estimates of GDP for 2013 to 2016, as well as revised estimates of GDP by industry and compensation by industry for 2013 to 2015, are also presented in this release.
Gross Domestic Product for 2017
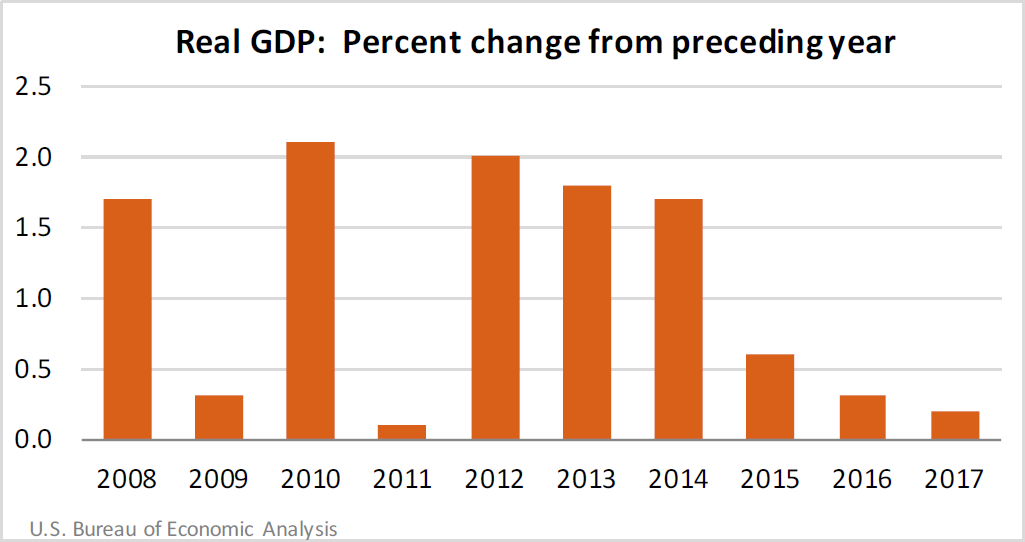
The estimates of GDP for Guam show that real GDP—GDP adjusted to remove price changes—increased 0.2 percent in 2017 after increasing 0.3 percent in 2016 (see Table 1.3). For comparison, real GDP for the United States (excluding the territories) increased 2.2 percent in 2017 after increasing 1.6 percent in 2016.
The growth in the Guam economy reflected an increase in consumer spending, which rose for the 7th year in a row (see Table 1.4). The increase in consumer spending largely reflected growth in retail trade activity.
Overall, investment spending contributed negatively to the economy. Although territorial government spending on construction and equipment increased, this growth was offset by a decline in construction activity on Defense and private sector projects.
Exports of services, which consists primarily of spending by tourists, decreased after increasing for 3 years. Although total arrivals increased slightly, tourism spending decreased, reflecting declines in average spending by visitors.
Gross Domestic Product by Industry and Compensation by Industry for 2016
The estimates of GDP by industry for Guam show that the private sector was the source of the growth in real GDP in 2016 (see Table 2.5). The growth in the distributive services and the accommodations and amusement sectors reflected increased spending by tourists and Guam residents.
The compensation by industry estimates, which are measured in current dollars, show trends in compensation for major industries (see Table 2.6). Total compensation decreased in 2016, primarily due to declines in the federal government and the construction industry.
The accompanying tables present estimates for GDP and its major components, GDP by industry, and compensation by industry. Also included in this release are estimates for the major components of gross domestic income.
Revisions to GDP
Estimates for 2013 to 2016 that were released on September 5, 2017 have been revised in order to incorporate improvements to source data, including:
- newly available data for territorial government spending from government financial statements,
- updated employment information from the Guam Bureau of Labor Statistics, and
- detailed wage and employment information from the Census Bureau’s County Business Patterns.
The revised estimates show a similar pattern of inflation-adjusted growth as the previously published estimates (see Table 1.7).
Future directions
Moving forward, an agreement between OIA and BEA will extend and improve the estimates of GDP for Guam. The information provided by the Guam government will continue to be critical to the successful production of these estimates.
BEA currently plans to release GDP estimates for 2018 beginning in the summer of 2019. GDP by industry and compensation by industry estimates for 2017 will also be released at the same time.
1 These estimates are based on limited source data and are subject to revision.