
News Release
Real Personal Income for States and Metropolitan Areas, 2016
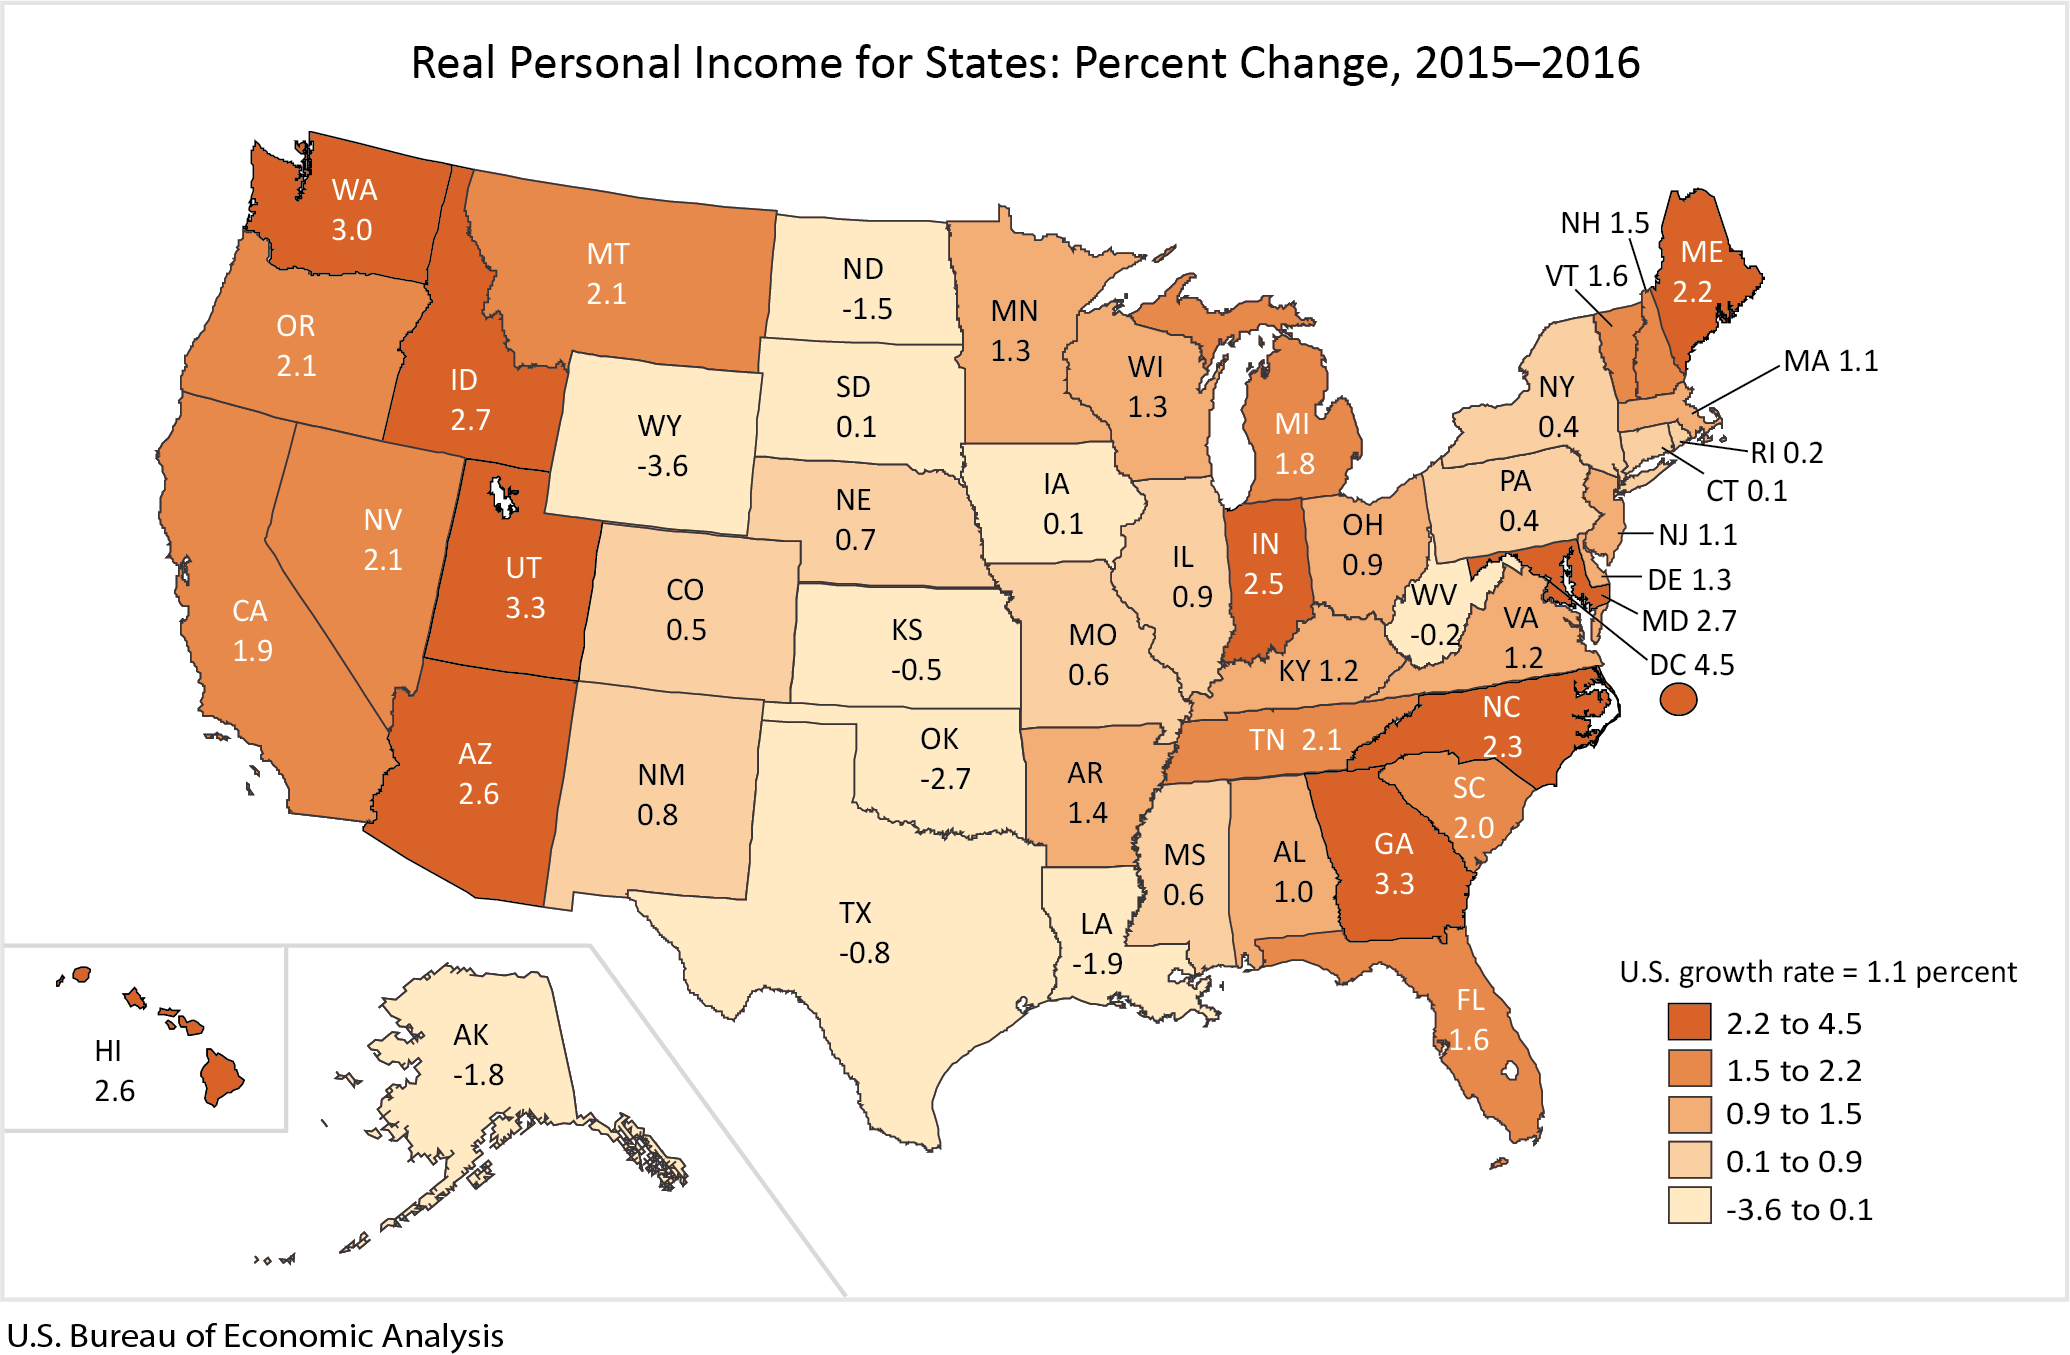
Real state personal income grew on average 1.1 percent in 2016, after increasing 4.7 percent in 2015, according to estimates released today by the Bureau of Economic Analysis. Real state personal income is a state's current-dollar personal income adjusted by the state's regional price parity and the national personal consumption expenditures price index. The percent change in real state personal income ranged from 3.3 percent in Utah and Georgia to -3.6 percent in Wyoming (table 1). In the District of Columbia, real personal income grew 4.5 percent. Across metropolitan areas, the percent change ranged from 6.6 percent in Jacksonville, NC to -8.1 percent in Midland, TX and Odessa, TX (table 4).
Real Personal Income in 2016
- States with the fastest growth in real personal income were Utah (3.3 percent), Georgia (3.3 percent), and Washington (3.0 percent). The District of Columbia's real personal income grew 4.5 percent.
- Eight states had declining real personal income. The largest percent declines were in Wyoming (-3.6 percent), Oklahoma (-2.7 percent), and Louisiana (-1.9 percent).
- Large metropolitan areas – those with population greater than two million – with the fastest growth in real personal income were Atlanta-Sandy Springs-Roswell, GA (3.4 percent), Orlando-Kissimmee-Sanford, FL (3.3 percent), and Charlotte-Concord-Gastonia, NC-SC (3.2 percent).
- The three large metropolitan areas with declining real personal income were Houston-The Woodlands-Sugar Land, TX (-3.3 percent), Denver-Aurora-Lakewood, CO (-0.7 percent), and Pittsburgh, PA (-0.4 percent).
Regional Price Parities in 2016
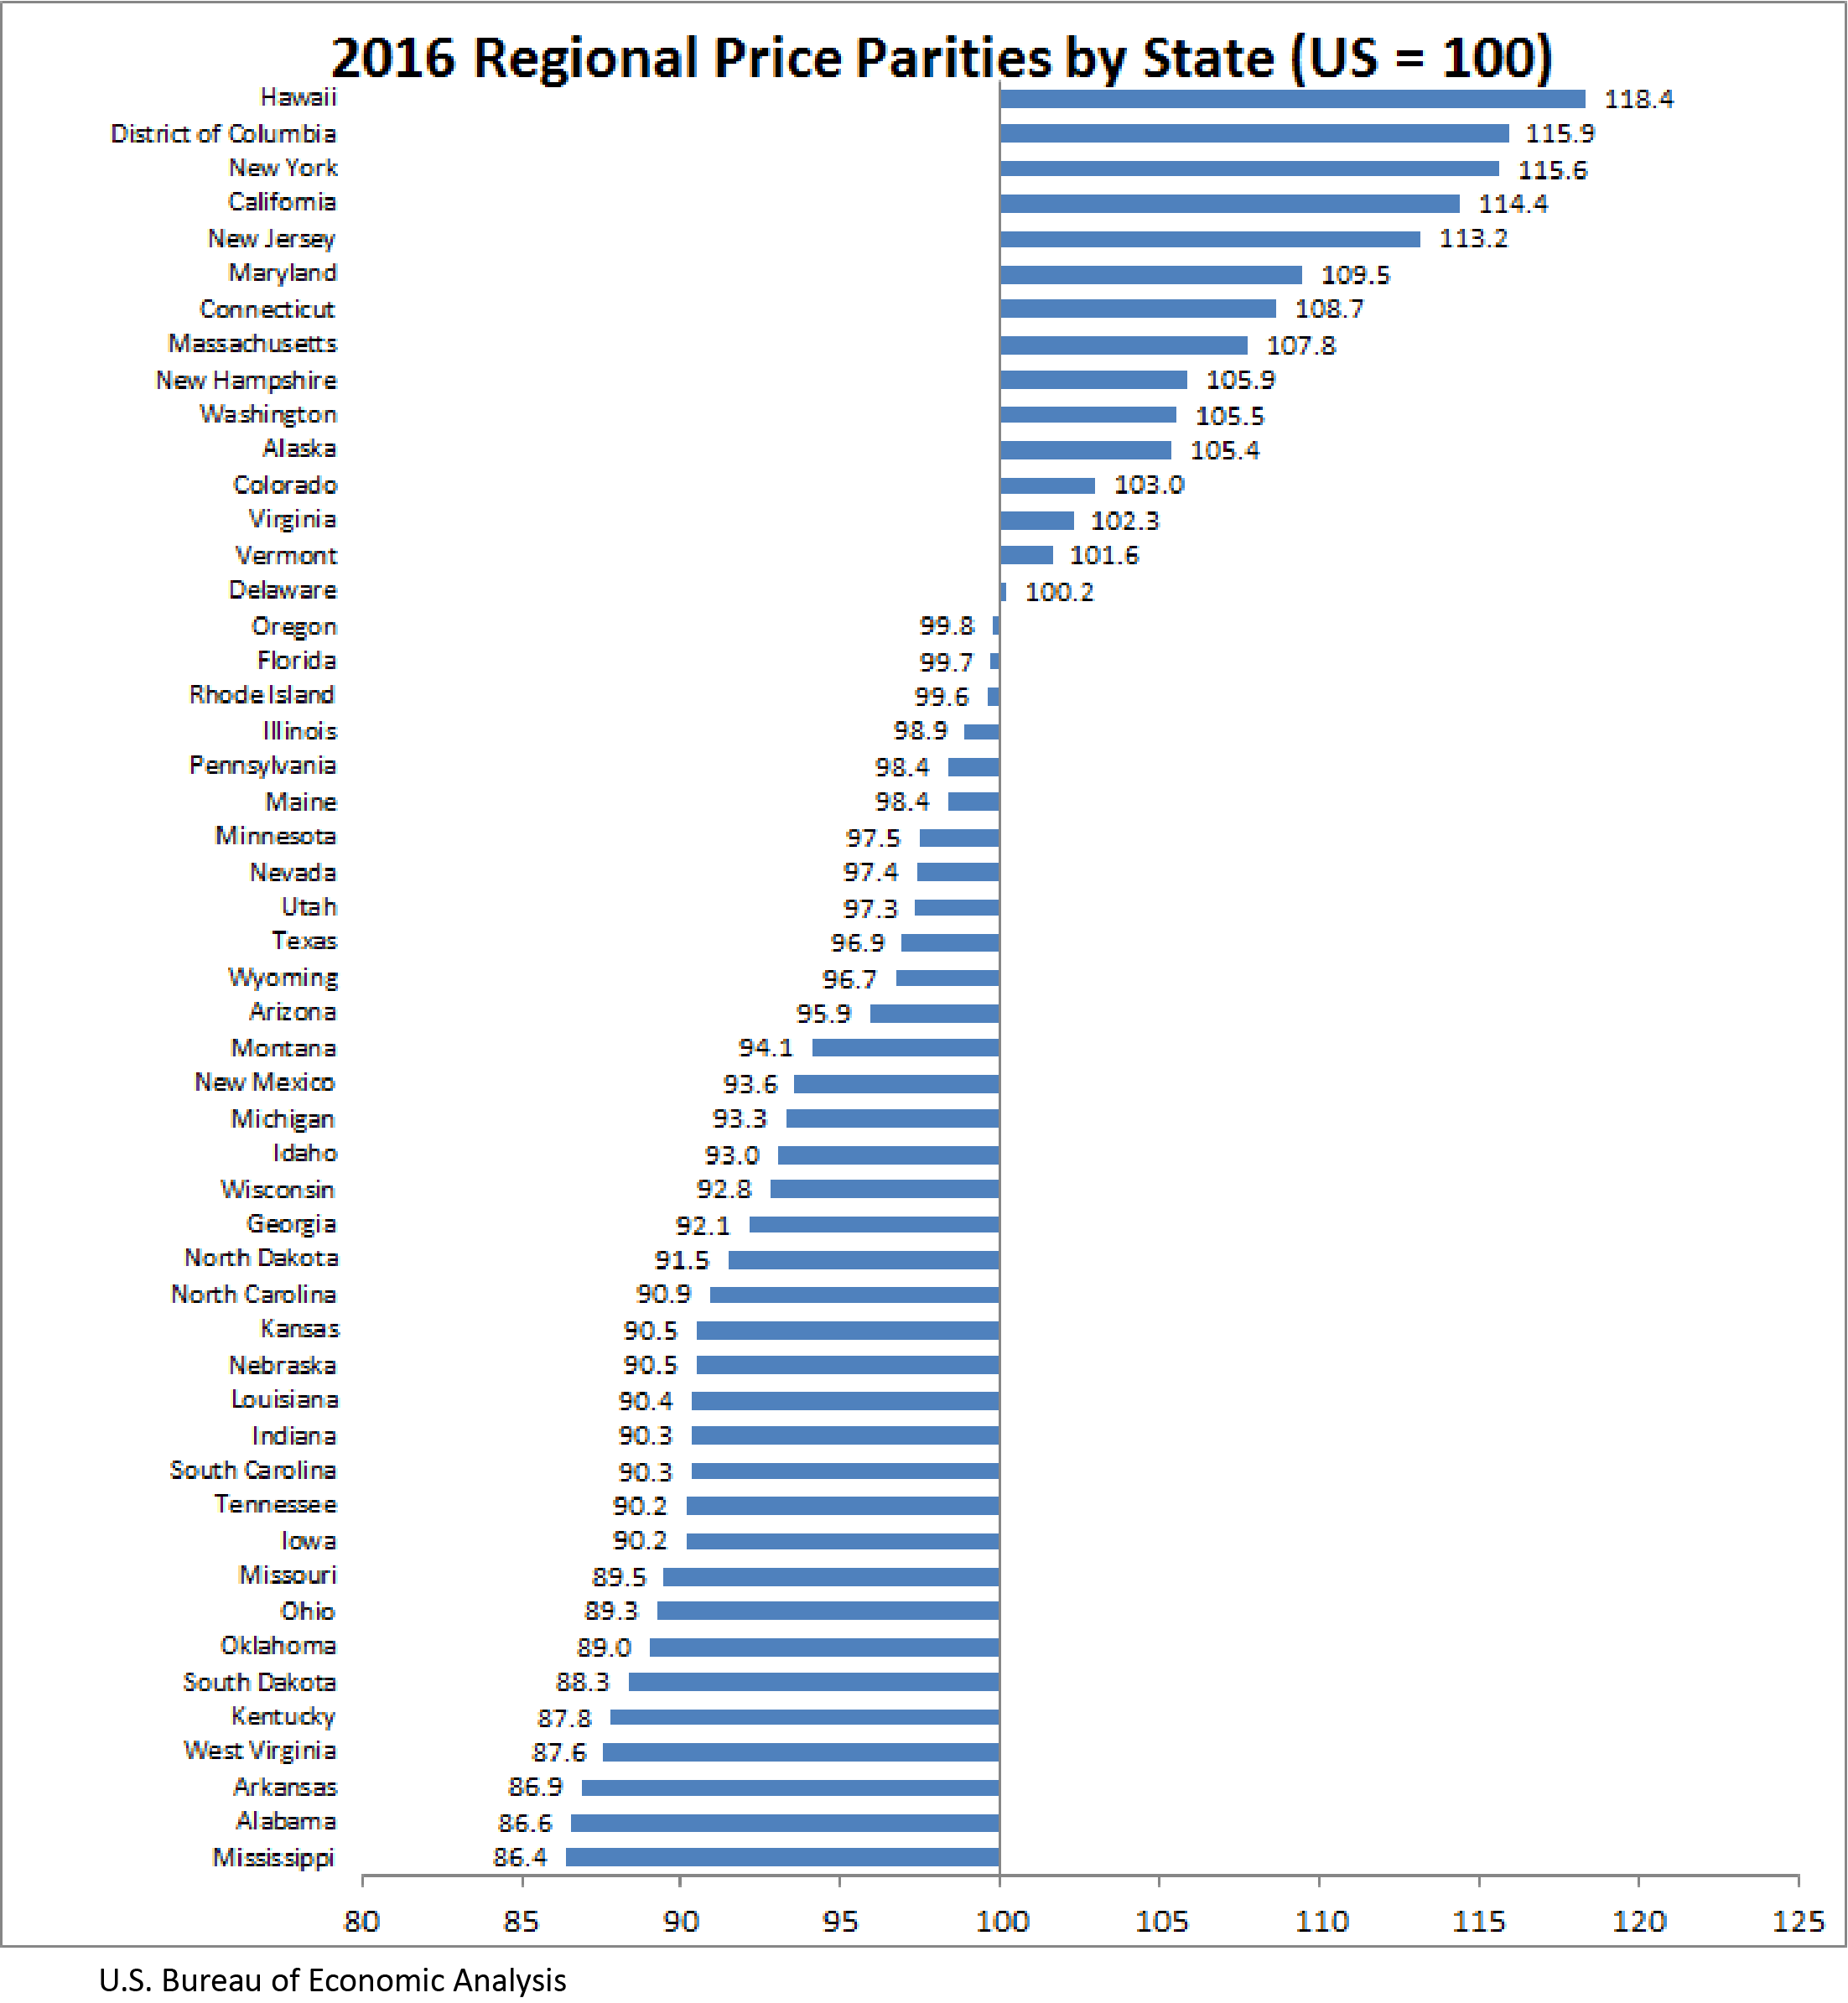
Regional Price Parities (RPPs) measure the differences in price levels across states and metropolitan areas for a given year and are expressed as a percentage of the overall national price level. All items RPPs cover all consumption goods and services, including rents. Areas with high/low RPPs typically correspond to areas with high/low price levels for rents.
- States with the highest RPPs were Hawaii (118.4), New York (115.6), and California (114.4) (table 3). The District of Columbia's RPP was 115.9.
- States with the lowest RPPs were Mississippi (86.4), Alabama (86.6), and Arkansas (86.9).
- Across states, Hawaii had the highest rents RPP (157.4) and Alabama and West Virginia had the lowest (63.2).
- Large metropolitan areas with the highest RPPs were San Francisco-Oakland-Hayward, CA (124.7), New York-Newark-Jersey City, NY-NJ-PA (122.0), and Washington-Arlington-Alexandria, DC-VA-MD-WV, (119.1) (table 6).
- Large metropolitan areas with the lowest RPPs were Cincinnati, OH-KY-IN (89.6), Cleveland-Elyria, OH (90.2), and St. Louis, MO-IL (90.8).
- Across large metropolitan areas, San Francisco-Oakland-Hayward, CA had the highest rents RPP (190.9) and Cleveland-Elyria, OH had the lowest (77.9).
- Across all metropolitan areas, San Jose-Sunnyvale-Santa Clara, CA had the highest rents RPP (213.3) and Gadsden, AL had the lowest (51.5).
Next release: May 2019 – Real Personal Income for States and Metropolitan Areas, 2017.
Technical Notes on Regional Price Parities and Implicit Regional Price Deflators
Price indexes commonly measure price changes over time. The BEA's personal consumption expenditures (PCE) price index and the Bureau of Labor Statistics' consumer price index (CPI) are two examples. Spatial price indexes measure price level differences across regions for one time period. An example of these type of indexes are purchasing power parities (PPPs), which measure differences in price levels across countries for a given period, and can be used to convert estimates of per capita GDP into comparable levels in a common currency. The regional price parities (RPPs) that BEA has developed compare regions within the United States, but without the need for currency conversion. An implicit regional price deflator (IRPD) can be derived by combining the RPPs and the U.S. PCE price index.
Regional Price Parities. The RPPs are calculated using price quotes for a wide array of items from the CPI, which are aggregated into broader expenditure categories (such as food, transportation or education)1. Data on rents are obtained separately from the Census Bureau's American Community Survey (ACS). The expenditure weights for each category are constructed using CPI expenditure weights, BEA's personal consumption expenditures, and ACS rents expenditures2.
The broader categories and the data on rents are combined with the expenditure weights using a multilateral aggregation method that expresses a region's price level relative to the U.S3.
For example, if the RPP for area A is 120 and for area B is 90, then on average, prices are 20 percent higher and 10 percent lower than the U.S. average for A and B, respectively. If the personal income for area A is $12,000 and for area B is $9,000, then RPP-adjusted incomes are $10,000 (or $12,000/1.20) and $10,000 (or $9,000/0.90), respectively. In other words, the purchasing power of the two incomes is equivalent when adjusted by their respective RPPs.
Implicit Regional Price Deflator. The IRPD is a regional price index derived as the product of two terms: the regional price parity and the U.S. PCE price index.
The implicit regional price deflator will equal current dollar personal income divided by real personal income in chained dollars. The growth rate or year-to-year change in the IRPDs is a measure of regional inflation4.
Detailed information on the methodology used to estimate the RPPs may be found on the regional methodology page of the BEA website: www.bea.gov/regional/methods.cfm.