
News Release
U.S. International Trade in Goods and Services, January 2018
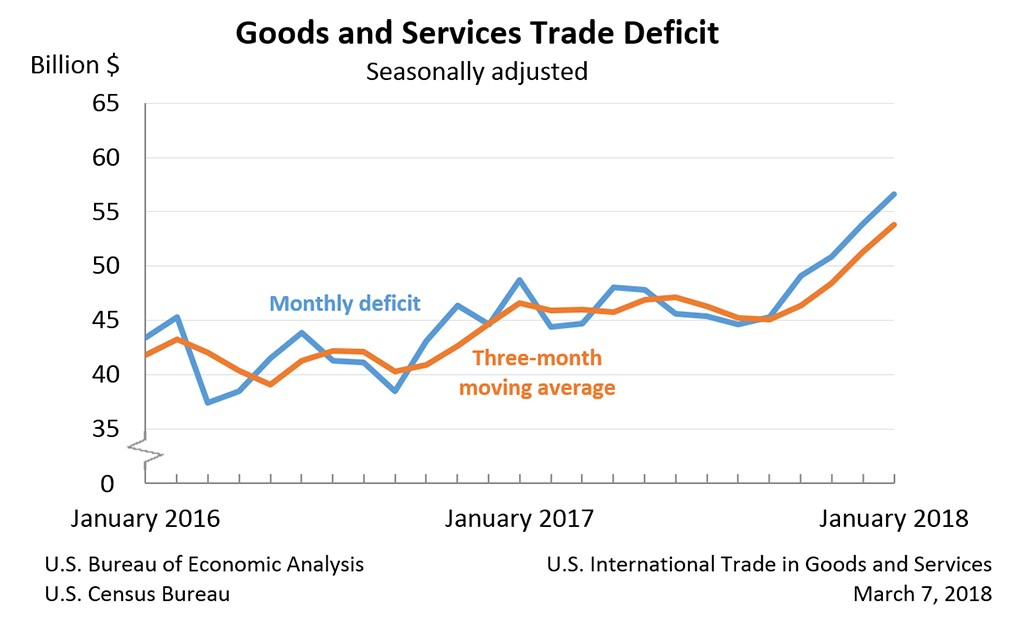
The U.S. Census Bureau and the U.S. Bureau of Economic Analysis announced today that the goods and services deficit was $56.6 billion in January, up $2.7 billion from $53.9 billion in December, revised.
Exports, Imports, and Balance (exhibit 1)
January exports were $200.9 billion, $2.7 billion less than December exports. January imports were $257.5 billion, down less than $0.1 billion from December imports.
The January increase in the goods and services deficit reflected an increase in the goods deficit of $2.8 billion to $76.5 billion and an increase in the services surplus of $0.1 billion to $19.9 billion.
Year-over-year, the goods and services deficit increased $7.9 billion, or 16.2 percent, from January 2017. Exports increased $9.7 billion or 5.1 percent. Imports increased $17.6 billion or 7.4 percent.
Three-Month Moving Averages (exhibit 2)
The average goods and services deficit increased $2.5 billion to $53.8 billion for the three months ending in January.
- Average exports increased $1.7 billion to $201.6 billion in January.
- Average imports increased $4.2 billion to $255.4 billion in January.
Year-over-year, the average goods and services deficit increased $7.2 billion from the three months ending in January 2017.
- Average exports increased $13.1 billion from January 2017.
- Average imports increased $20.3 billion from January 2017.
Exports (exhibits 3, 6, and 7)
Exports of goods decreased $3.0 billion to $134.2 billion in January.
Exports of goods on a Census basis decreased $3.3 billion.
- Capital goods decreased $2.6 billion.
- Civilian aircraft decreased $1.8 billion.
- Industrial supplies and materials decreased $1.3 billion.
- Fuel oil decreased $0.5 billion.
- Crude oil decreased $0.2 billion.
- Other chemicals decreased $0.2 billion.
- Other goods decreased $1.0 billion.
- Consumer goods increased $1.2 billion.
- Artwork, antiques, stamps, and other collectibles increased $0.5 billion.
- Pharmaceutical preparations increased $0.4 billion.
Net balance of payments adjustments increased $0.3 billion.
Exports of services increased $0.3 billion to $66.7 billion in January.
- The largest increase was in charges for the use of intellectual property ($0.1 billion).
- The only decrease was in maintenance and repair services ($0.1 billion).
Imports (exhibits 4, 6, and 8)
Imports of goods decreased $0.2 billion to $210.7 billion in January.
Imports of goods on a Census basis decreased $0.3 billion.
- Capital goods decreased $1.3 billion.
- Civilian aircraft decreased $0.9 billion.
- Semiconductors decreased $0.5 billion.
- Consumer goods decreased $0.9 billion.
- Cell phones and other household goods decreased $1.2 billion.
- Industrial supplies and materials increased $2.0 billion.
- Crude oil increased $2.2 billion.
Net balance of payments adjustments increased $0.2 billion.
Imports of services increased $0.2 billion to $46.8 billion in January.
- The largest increase was in other business services ($0.2 billion).
- The largest decrease was in travel (for all purposes including education) ($0.2 billion).
Real Goods in 2009 Dollars – Census Basis (exhibit 11)
The real goods deficit increased $1.3 billion to $69.7 billion in January.
- Real exports of goods decreased $4.3 billion to $126.9 billion.
- Real imports of goods decreased $3.0 billion to $196.6 billion.
Revisions
Exports and imports of goods and services were revised for July through December 2017 to incorporate more comprehensive and updated quarterly and monthly data. In addition to these revisions, seasonally adjusted data for all months in 2017 were revised so that the totals of the seasonally adjusted months equal the annual totals.
Revisions to December exports
- Exports of goods were revised down $0.3 billion.
- Exports of services were revised up $0.5 billion.
Revisions to December imports
- Imports of goods were revised up $0.1 billion.
- Imports of services were revised up $0.9 billion.
Goods by Selected Countries and Areas: Monthly – Census Basis (exhibit 19)
The January figures show surpluses, in billions of dollars, with Hong Kong ($2.6), South and Central America ($2.4), Singapore ($0.9), Brazil ($0.5), and United Kingdom ($0.3). Deficits were recorded, in billions of dollars, with China ($35.5), European Union ($15.0), Germany ($6.3), Mexico ($5.6), Japan ($5.6), Italy ($2.8), OPEC ($2.5), India ($1.8), Taiwan ($1.5), Canada ($1.5), South Korea ($1.5), France ($1.4), and Saudi Arabia ($0.6).
- The deficit with members of OPEC increased $2.0 billion to $2.5 billion in January. Exports decreased $1.2 billion to $4.1 billion and imports increased $0.7 billion to $6.6 billion.
- The deficit with China increased $1.5 billion to $35.5 billion in January. Exports decreased $1.3 billion to $10.5 billion and imports increased $0.2 billion to $46.0 billion.
- The deficit with the European Union decreased $2.1 billion to $15.0 billion in January. Exports decreased $0.4 billion to $24.7 billion and imports decreased $2.5 billion to $39.7 billion.
Goods and Services by Selected Countries and Areas: Quarterly – Balance of Payments Basis (exhibit 20)
The fourth quarter figures show surpluses, in billions of dollars, with South and Central America ($20.7), Hong Kong ($8.3), Brazil ($7.7), Singapore ($5.1), United Kingdom ($3.2), Saudi Arabia ($1.1), OPEC ($0.8), and Canada ($0.6). Deficits were recorded, in billions of dollars, with China ($89.4), European Union ($29.0), Mexico ($17.4), Germany ($16.7), Japan ($13.9), Italy ($10.0), India ($8.0), France ($4.5), Taiwan ($3.5), and South Korea ($2.6).
- The deficit with China increased $7.4 billion to $89.4 billion in the fourth quarter. Exports increased $0.4 billion to $48.0 billion and imports increased $7.7 billion to $137.4 billion.
- The deficit with the European Union increased $4.5 billion to $29.0 billion in the fourth quarter. Exports increased $4.7 billion to $136.0 billion and imports increased $9.2 billion to $165.0 billion.
- The deficit with Japan decreased $0.9 billion to $13.9 billion in the fourth quarter. Exports increased $1.6 billion to $30.0 billion and imports increased $0.7 billion to $43.8 billion.
All statistics referenced are seasonally adjusted; statistics are on a balance of payments basis unless otherwise specified. Additional statistics, including not seasonally adjusted statistics and details for goods on a Census basis, are available in Exhibits 1-20b of this release. For information on data sources, definitions, and revision procedures, see the explanatory notes in this release. The full release can be found at www.census.gov/foreign-trade/Press-Release/current_press_release/index.html or www.bea.gov/newsreleases/international/trade/tradnewsrelease.htm. The full schedule is available in the U.S. Census Bureau’s Economic Briefing Room at www.census.gov/economic-indicators/.
Next release: April 5, 2018, at 8:30 A.M. EDT U.S. International Trade in Goods and Services: February 2018
With this release of the "U.S. International Trade in Goods and Services" report, the U.S. Bureau of Economic Analysis (BEA) and the U.S. Census Bureau have implemented changes to the release layout to reflect recent changes to each bureau’s respective style guidelines for economic indicator news releases. These changes do not affect the statistics or the text contained in the release. The layout and format of the exhibits also are not impacted.
Substantive changes include:
- Adding a summary box that presents the goods and services trade deficit, exports of goods and services, imports of goods and services, and the percent change from the prior month for each of these series.
- Removing the "U.S. International Trade in Goods and Services" chart, which shows exports, imports, and the trade balance.
- Reorienting the chart on the goods and services trade balance to show the goods and services trade deficit.
- Relocating the "Information on Goods and Services" section to immediately after the release text and renaming this section as "Explanatory Notes."
If you have questions, please contact BEA, Balance of Payments Division, at InternationalAccounts@bea.gov or the Census Bureau, Economic Indicators Division, on (800) 549-0595, option 4, or at eid.international.trade.data@census.gov.