
News Release
U.S. International Transactions, 4th quarter and Year 2017
Current-Account Balance, Fourth Quarter
The U.S. current-account deficit increased to $128.2 billion (preliminary) in the fourth quarter of 2017 from $101.5 billion (revised) in the third quarter, according to statistics released by the Bureau of Economic Analysis (BEA). The deficit was 2.6 percent of current- dollar gross domestic product (GDP) in the fourth quarter, up from 2.1 percent in the third quarter.
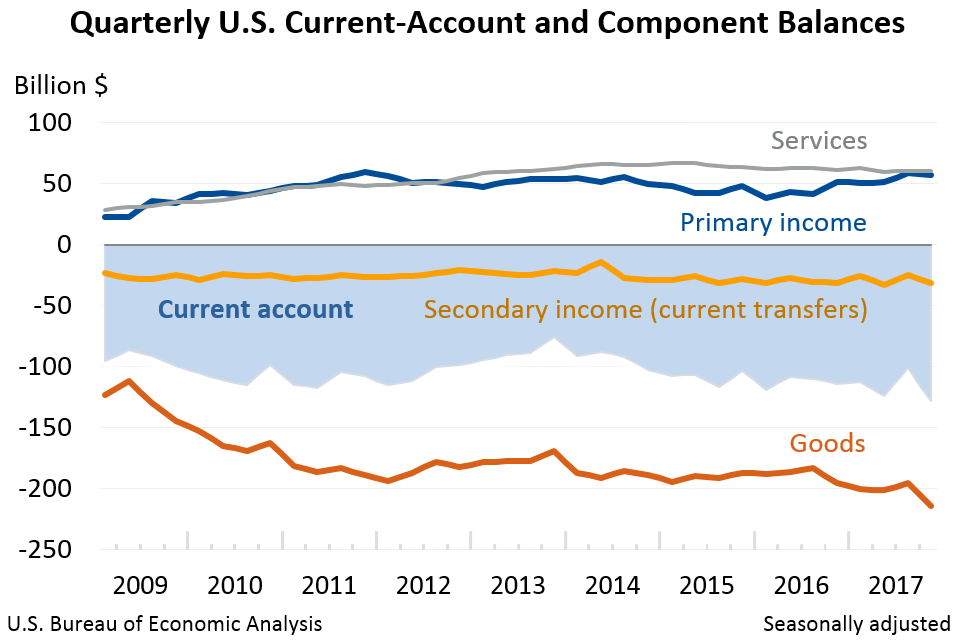
The $26.7 billion increase in the current-account deficit mostly reflected increases in the deficits on goods and secondary income and a decrease in the surplus on primary income.
Current-Account Transactions, Fourth Quarter (tables 1-5)
Exports of goods and services and income receipts
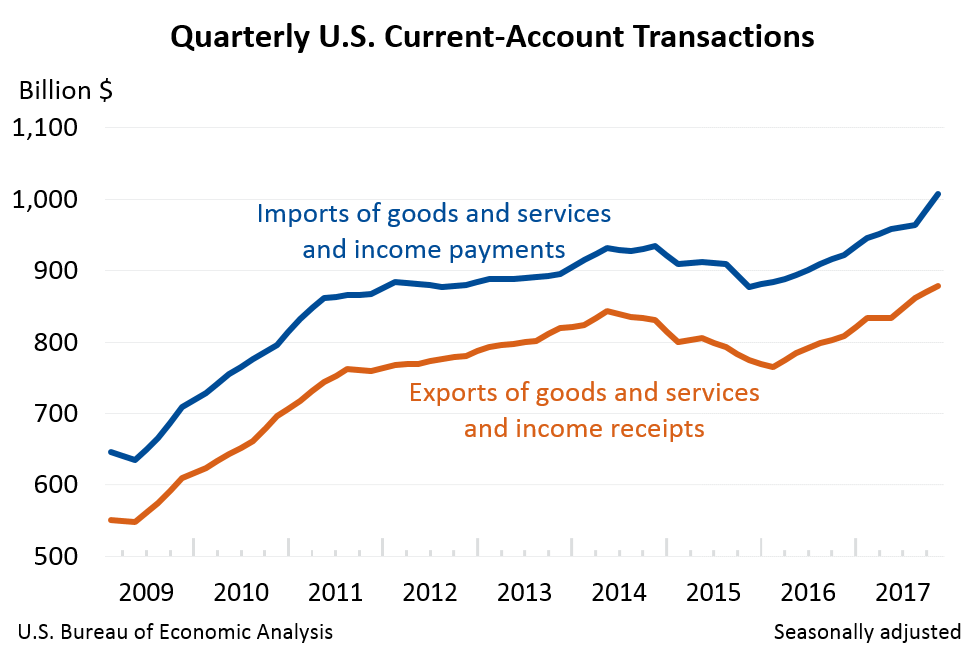
Exports of goods and services and income receipts increased $16.6 billion in the fourth quarter to $878.8 billion.
- Goods exports increased $14.2 billion to $400.7 billion, mostly reflecting an increase in industrial supplies and materials, primarily petroleum and products.
- Primary income receipts increased $6.0 billion to $243.9 billion, mostly reflecting increases in direct investment income and in portfolio investment income.
- Secondary income receipts decreased $5.9 billion to $35.3 billion, partly offsetting the increases in goods exports and in primary income receipts. The decrease in secondary income receipts mostly reflected a decrease in U.S. government transfers, primarily fines and penalties.
Imports of goods and services and income payments
Imports of goods and services and income payments increased $43.3 billion to $1,006.9 billion.
- Goods imports increased $33.1 billion to $614.9 billion, mostly reflecting increases in industrial supplies and materials, primarily petroleum and products, and in consumer goods except food and automotive.
- Primary income payments increased $7.3 billion to $186.7 billion, primarily reflecting an increase in direct investment income.
Capital Account, Fourth Quarter (table 1)
The balance on the capital account shifted to a deficit of less than $0.1 billion in the fourth quarter from a surplus of $24.9 billion in the third quarter. The third-quarter transactions reflected receipts from foreign insurance companies for losses resulting from hurricanes Harvey, Irma, and Maria. For more information, see "What are the effects of hurricanes and other disasters on the international economic accounts?"
Financial Account, Fourth Quarter (tables 1, 6, 7, and 8)
Net U.S. borrowing measured by financial-account transactions was $29.8 billion in the fourth quarter, a decrease from net borrowing of $121.8 billion in the third quarter.
Financial assets
Net U.S. acquisition of financial assets excluding financial derivatives decreased $172.8 billion to $177.9 billion.
- Net U.S. acquisition of portfolio investment assets decreased $95.9 billion to $83.3 billion, reflecting a shift to net U.S. sales of foreign equity and investment fund shares from third-quarter net purchases.
- Transactions in other investment assets shifted to net U.S. liquidation of $10.7 billion in the fourth quarter from net acquisition of $74.7 billion in the third quarter, mostly reflecting a shift to net foreign repayment of loans from third-quarter net U.S. provision of loans to foreigners.
Liabilities
Net U.S. incurrence of liabilities excluding financial derivatives decreased $282.6 billion to $208.4 billion.
- Net U.S. incurrence of portfolio investment liabilities decreased $211.5 billion to $84.9 billion, reflecting a decrease in net foreign purchases of U.S. long-term debt securities and a shift to net foreign sales of U.S. equity and investment fund shares from third- quarter net foreign purchases.
- Net U.S. incurrence of direct investment liabilities decreased $49.6 billion to $54.1 billion, primarily reflecting a shift to net U.S. repayment of debt instrument liabilities from third-quarter net incurrence.
- Net U.S. incurrence of other investment liabilities decreased $21.4 billion to $69.5 billion, reflecting largely offsetting changes in transactions in loan and deposit liabilities. In loans, transactions shifted to net U.S. repayment of loan liabilities from third-quarter net incurrence. In deposits, transactions shifted to net incurrence of deposit liabilities from third-quarter net foreign withdrawal of deposits in the United States.
Financial derivatives
Transactions in financial derivatives other than reserves reflected fourth-quarter net lending of $0.8 billion, a decrease of $17.8 billion from the third quarter.
Statistical Discrepancy, Fourth Quarter (table 1)
The statistical discrepancy was $98.4 billion in the fourth quarter, after a statistical discrepancy of -$45.2 billion in the third quarter.
Updates to Third Quarter 2017 International Transactions Accounts Aggregates
| Preliminary estimate | Revised estimate | |
|---|---|---|
| Current-account balance | -100.6 | -101.5 |
| Goods balance | -195.3 | -195.3 |
| Services balance | 60.9 | 60.0 |
| Primary-income balance | 57.0 | 58.5 |
| Secondary-income balance | -23.2 | -24.7 |
| Net lending (+)/borrowing (-) from financial-account transactions | -105.6 | -121.8 |
| Statistical discrepancy | -29.9 | -45.2 |
Current-Account Balance, Year 2017
The current-account deficit increased to $466.2 billion (preliminary) in 2017 from $451.7 billion in 2016. The deficit was 2.4 percent of current-dollar GDP in 2017, the same percentage as in 2016.
The $14.6 billion increase in the deficit reflected a $58.7 billion increase in the deficit on goods and a $4.9 billion decrease in the surplus on services that were partly offset by a $43.8 billion increase in the surplus on primary income and a $5.3 billion decrease in the deficit on secondary income.
Current-Account Transactions, Year 2017 (tables 1-5)
Exports of goods and services and income receipts
Exports of goods and services and income receipts increased $250.9 billion in 2017 to $3,408.2 billion.
- Primary income receipts increased $112.9 billion to $926.9 billion, led by an increase in direct investment income.
- Goods exports increased $95.0 billion to $1,550.7 billion, led by an increase in industrial supplies and materials.
- Services exports increased $28.5 billion to $780.9 billion, led by increases in other business services and in financial services.
Imports of goods and services and income payments
Imports of goods and services and income payments increased $265.5 billion to $3,874.4 billion.
- Goods imports increased $153.7 billion to $2,361.9 billion, led by increases in industrial supplies and materials and in capital goods except automotive.
- Primary income payments increased $69.1 billion to $709.9 billion, led by increases in portfolio investment income and in other investment income.
- Services imports increased $33.5 billion to $538.1 billion, led by increases in travel (for all purposes including education) and in other business services.
Capital Account, Year 2017 (table 1)
Capital transfer receipts were $24.9 billion in 2017. The transactions reflected receipts from foreign insurance companies for losses resulting from hurricanes Harvey, Irma, and Maria. For more information, see "What are the effects of hurricanes and other disasters on the international economic accounts?"
Financial Account, Year 2017 (tables 1, 6, 7, and 8)
Net U.S. borrowing measured by financial-account transactions was $349.2 billion in 2017, a decrease from net borrowing of $377.7 billion in 2016.
Financial assets
Net U.S. acquisition of financial assets excluding financial derivatives increased $864.5 billion to $1,212.4 billion.
- Net U.S. acquisition of portfolio investment assets increased $548.9 billion to $589.5 billion, reflecting increases in net U.S. purchases of foreign debt securities and in net purchases of foreign equity and investment fund shares.
- Transactions in other investment assets shifted to net U.S. acquisition of $200.1 billion in 2017 from net liquidation of $6.4 billion in 2016, primarily reflecting a shift to net U.S. acquisition of foreign deposits in 2017 from net withdrawal in 2016.
- Net U.S. acquisition of direct investment assets increased $112.8 billion to $424.4 billion, reflecting a shift to net U.S. acquisition of debt instruments in 2017 from net foreign repayment in 2016 and an increase in net acquisition of equity assets.
Liabilities
Net U.S. incurrence of liabilities excluding financial derivatives increased $846.5 billion to $1,587.9 billion.
- Net U.S. incurrence of portfolio investment liabilities increased $599.7 billion to $837.1 billion, reflecting a shift to net foreign purchases of U.S. equity and investment fund shares in 2017 from net foreign sales in 2016 and an increase in net foreign purchases of U.S. long-term debt securities.
- Net U.S. incurrence of other investment liabilities increased $377.6 billion to $402.2 billion, reflecting a shift to net U.S. incurrence of deposit liabilities in 2017 from net foreign withdrawal in 2016 and a shift to net U.S. incurrence of loan liabilities in 2017 from net repayment in 2016.
- Net U.S. incurrence of direct investment liabilities decreased $130.7 billion to $348.7 billion, partly offsetting the increases in net U.S. incurrence of portfolio investment liabilities and other investment liabilities. The decrease in net U.S. incurrence of direct investment liabilities reflected decreases in net incurrence of debt instrument liabilities and equity liabilities.
Financial derivatives
Transactions in financial derivatives other than reserves reflected net lending of $26.4 billion in 2017, an increase of $10.5 billion from 2016.
Statistical Discrepancy, Year 2017 (table 1)
The statistical discrepancy increased $18.1 billion in 2017 to $92.2 billion.
The annual update of the U.S. international transactions accounts will be released along with preliminary estimates for the first quarter of 2018 on June 20, 2018. An article previewing the annual update will appear in the May 2018 issue of the Survey of Current Business.
Next release: June 20, 2018 at 8:30 A.M. EDT U.S. International Transactions, First Quarter 2018 and Annual Update