
News Release
Local Area Gross Domestic Product, 2018
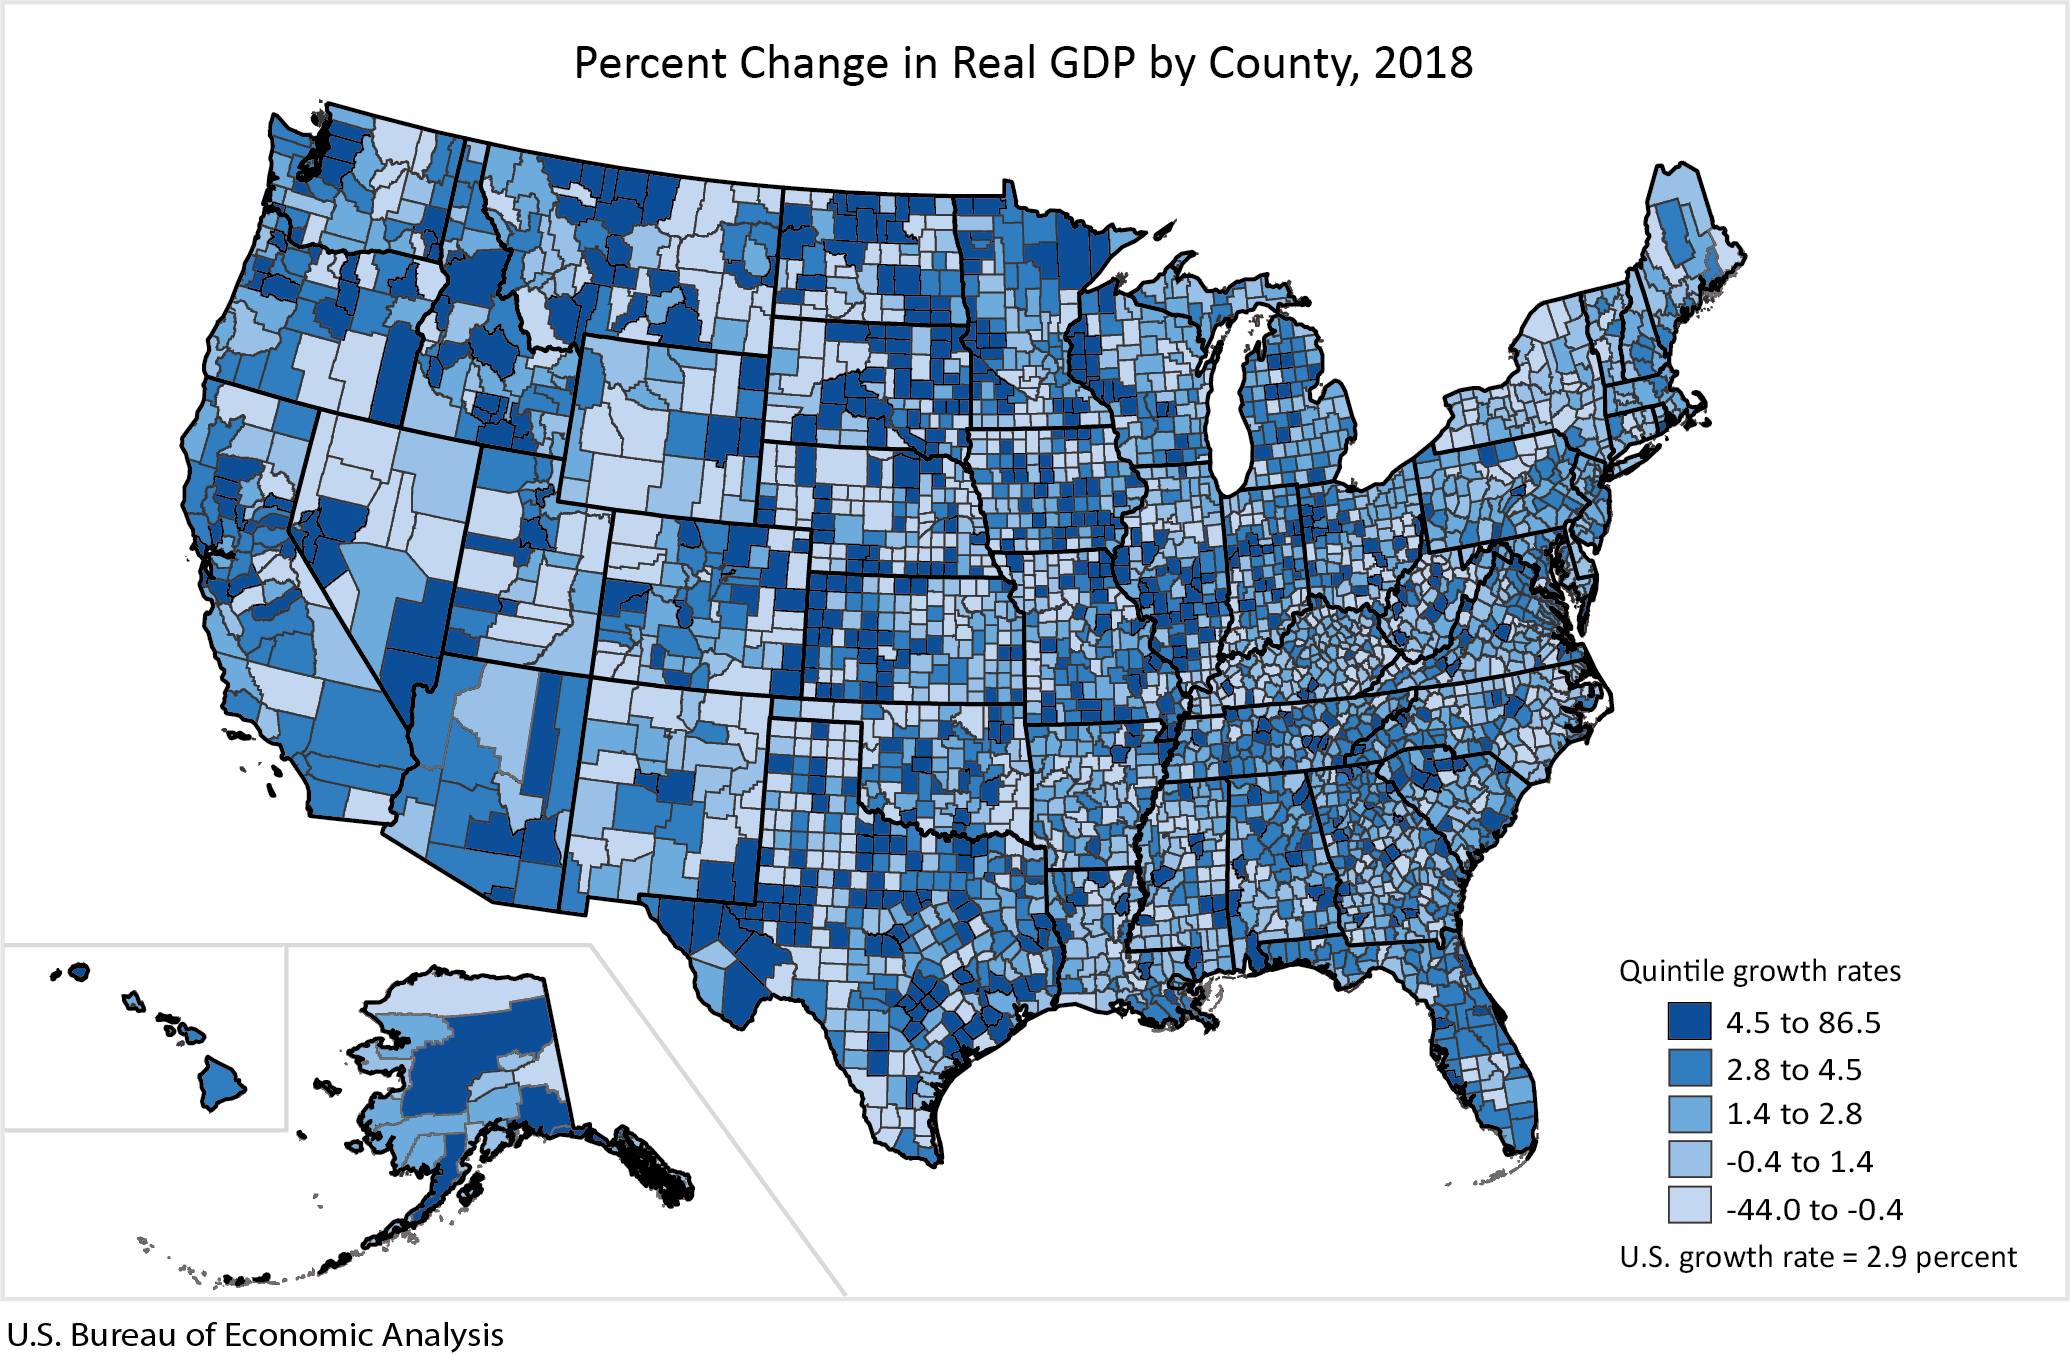
First Official Release of Gross Domestic Product by County, 2001-2018
Real gross domestic product (GDP) increased in 2,375 counties, decreased in 717, and was unchanged in 21 in 2018, according to estimates released today by the U.S. Bureau of Economic Analysis (BEA). The percentage change in real GDP ranged from 86.5 percent in Jackson County, WV, to -44.0 percent in Grant County, ND, (table 1).
GDP is the value of goods and services produced within a county. The size of a county's economy as measured by GDP varies considerably across the United States. In 2018, the total level of real GDP ranged from $18.4 million in Issaquena County, MS, to $710.9 billion in Los Angeles County, CA.
Highlights
Large Counties: 141 counties with populations greater than 500,000 in 2018
- Real GDP increased in 136 and decreased in 5.
- GDP ranged from $11.2 billion in Pasco County, FL, to $710.9 billion dollars in Los Angeles County, CA.
- Santa Clara County, CA, (10.2 percent) was the fastest growing large county. The information industry was the leading contributor to the county's growth.
- Kern County, CA, (-0.7 percent) had the largest percentage decrease in GDP. The mining, quarrying, and oil and gas extraction industry (primarily oil and gas extraction) was the leading contributor to the decrease.
Medium Counties: 464 counties with populations between 100,000 and 500,000 in 2018
- Real GDP increased in 433, decreased in 30, and was unchanged in 1.
- GDP ranged from $2.0 billion in Saline County, AR, to $52.6 billion dollars in Morris County, NJ.
- Canadian County, OK, (21.0 percent) was the fastest growing medium county. The mining, quarrying, and oil and gas extraction industry (primarily oil and gas extraction and support activities) was the leading contributor to the county's growth.
- San Juan County, NM, (-6.1 percent) had the largest percentage decrease in GDP. The mining, quarrying, and oil and gas extraction industry (primarily non-oil and gas mineral extraction) was the leading contributor to the decrease.
Small Counties: 2,508 counties with populations less than 100,000 in 2018
- Real GDP increased in 1,806, decreased in 682, and was unchanged in 20.
- GDP ranged from $18.4 million in Issaquena County, MS, to $13.3 billion dollars in Karnes County, TX.
- Jackson County, WV, (86.5 percent) was the fastest growing small county. The construction industry was the leading contributor to the county's growth.
- Grant County, ND, (-44.0 percent) had the largest percentage decrease in GDP. The agriculture, forestry, fishing, and hunting industry was the leading contributor to the decrease.
This is BEA's first official release of GDP by county statistics for 2001–2018 for all counties in the United States. The GDP by county statistics incorporate new and additional source data and methodology improvements to the December 2018 prototype GDP by county statistics. This release also expands the industry detail. The new GDP by county statistics along with BEA's county estimates of personal income offer a more complete picture of local area economic conditions.
The release of GDP by county statistics replaces the release of GDP by metropolitan area statistics, previously occurring each September. GDP by metropolitan area statistics will now be made available with the release of GDP by county statistics, as shown in table 2.
Additional information on the GDP by county statistics, including a brief overview of the estimating methodology and data sources, is available here. Additional in-depth information on the methodology will be available in the February 2020 issue of the Survey of Current Business.
Next release: December 9, 2020
Gross Domestic Product by County and Metropolitan Area, 2019