
News Release
U.S. International Trade in Goods and Services, December 2018
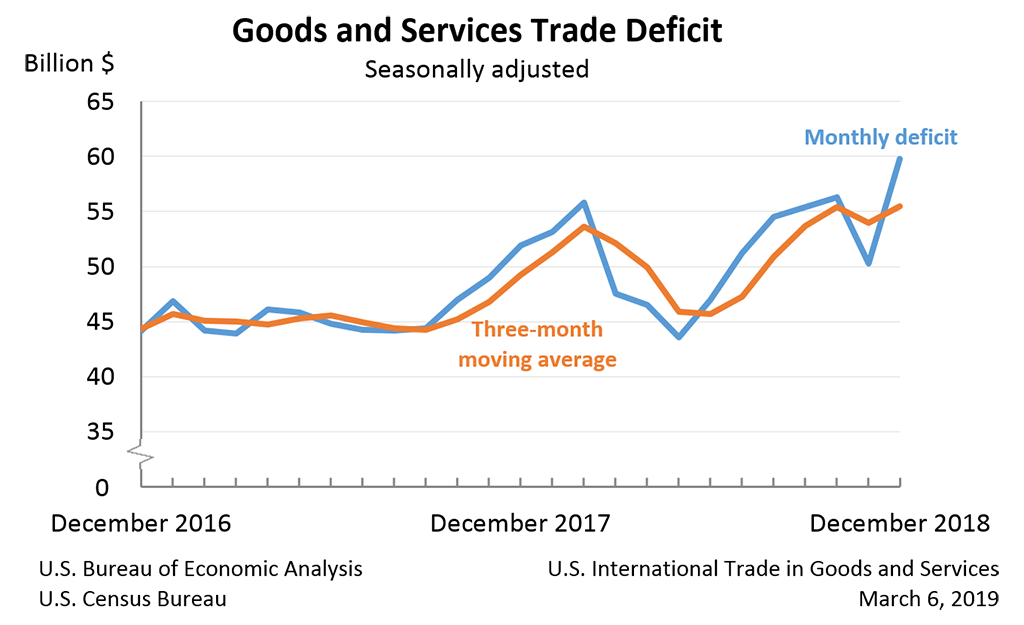
The U.S. Census Bureau and the U.S. Bureau of Economic Analysis announced today that the goods and services deficit was $59.8 billion in December, up $9.5 billion from $50.3 billion in November, revised.
| Deficit: | $59.8 Billion | +18.8%° |
| Exports: | $205.1 Billion | -1.9%° |
| Imports: | $264.9 Billion | +2.1%° |
|
Next release: March 27, 2019 (°) Statistical significance is not applicable or not measurable. Data adjusted for seasonality but not price changes Source: U.S. Census Bureau, U.S. Bureau of Economic Analysis; U.S. International Trade in Goods and Services, March 6, 2019 |
||
Exports, Imports, and Balance (exhibit 1)
December exports were $205.1 billion, $3.9 billion less than November exports. December imports were $264.9 billion, $5.5 billion more than November imports.
The December increase in the goods and services deficit reflected an increase in the goods deficit of $9.0 billion to $81.5 billion and a decrease in the services surplus of $0.5 billion to $21.8 billion.
For 2018, the goods and services deficit increased $68.8 billion, or 12.5 percent, from 2017. Exports increased $148.9 billion or 6.3 percent. Imports increased $217.7 billion or 7.5 percent.
Three-Month Moving Averages (exhibit 2)
The average goods and services deficit increased $1.5 billion to $55.5 billion for the three months ending in December.
- Average exports decreased $1.8 billion to $208.2 billion in December.
- Average imports decreased $0.4 billion to $263.7 billion in December.
Year-over-year, the average goods and services deficit increased $6.2 billion from the three months ending in December 2017.
- Average exports increased $6.2 billion from December 2017.
- Average imports increased $12.4 billion from December 2017.
Exports (exhibits 3, 6, and 7)
Exports of goods decreased $3.9 billion to $135.6 billion in December.
Exports of goods on a Census basis decreased $3.7 billion.
- Industrial supplies and materials decreased $2.1 billion.
- Other petroleum products decreased $0.9 billion.
- Crude oil decreased $0.5 billion.
- Fuel oil decreased $0.4 billion.
- Capital goods decreased $1.7 billion.
- Civilian aircraft decreased $1.0 billion.
Net balance of payments adjustments decreased $0.2 billion.
Exports of services decreased less than $0.1 billion to $69.5 billion in December.
- Transport decreased $0.2 billion.
- Financial services increased $0.1 billion.
Imports (exhibits 4, 6, and 8)
Imports of goods increased $5.1 billion to $217.2 billion in December.
Imports of goods on a Census basis increased $5.2 billion.
- Capital goods increased $2.7 billion.
- Computer accessories increased $0.7 billion.
- Computers increased $0.7 billion.
- Consumer goods increased $2.4 billion.
- Household and kitchen appliances increased $0.7 billion.
- Cell phones and other household goods increased $0.6 billion.
Net balance of payments adjustments decreased $0.2 billion.
Imports of services increased $0.5 billion to $47.7 billion in December.
- Transport increased $0.4 billion.
Real Goods in 2012 Dollars – Census Basis (exhibit 11)
The real goods deficit increased $10.0 billion to $91.6 billion in December.
- Real exports of goods decreased $2.2 billion to $146.8 billion.
- Real imports of goods increased $7.9 billion to $238.4 billion.
Revisions
In addition to revisions to source data for the November statistics, October imports of electric energy, a component of industrial supplies and materials, were revised to incorporate a $0.2 billion correction to source data. Also, the seasonally adjusted goods data were revised for January through November so that the totals of the seasonally adjusted months equal the annual totals.
Revisions to November exports
- Exports of goods were revised down $0.8 billion.
- Exports of services were revised down less than $0.1 billion.
Revisions to November imports
- Imports of goods were revised up $0.2 billion.
- Imports of services were revised up less than $0.1 billion.
Goods by Selected Countries and Areas: Monthly – Census Basis (exhibit 19)
The December figures show surpluses, in billions of dollars, with South and Central America ($3.5), Hong Kong ($2.2), Brazil ($0.8), United Kingdom ($0.6), and Singapore ($0.4). Deficits were recorded, in billions of dollars, with China ($38.7), European Union ($15.8), Mexico ($8.8), Germany ($5.7), Japan ($5.5), Italy ($3.0), South Korea ($1.7), Taiwan ($1.6), France ($1.5), India ($1.4), OPEC ($1.3), Saudi Arabia ($1.2), and Canada ($0.7).
- The deficit with China increased $3.2 billion to $38.7 billion in December. Exports increased $0.4 billion to $7.7 billion and imports increased $3.6 billion to $46.4 billion.
- The deficit with Mexico increased $2.1 billion to $8.8 billion in December. Exports decreased $1.3 billion to $21.1 billion and imports increased $0.8 billion to $29.9 billion.
- The deficit with India decreased $0.4 billion to $1.4 billion in December. Exports increased $0.6 billion to $3.3 billion and imports increased $0.3 billion to $4.7 billion.
Annual Summary for 2018
Exports, Imports, and Balance (exhibit 1)
For 2018, the goods and services deficit was $621.0 billion, up $68.8 billion from $552.3 billion in 2017. Exports were $2,500.0 billion in 2018, up $148.9 billion from 2017. Imports were $3,121.0 billion, up $217.7 billion from 2017.
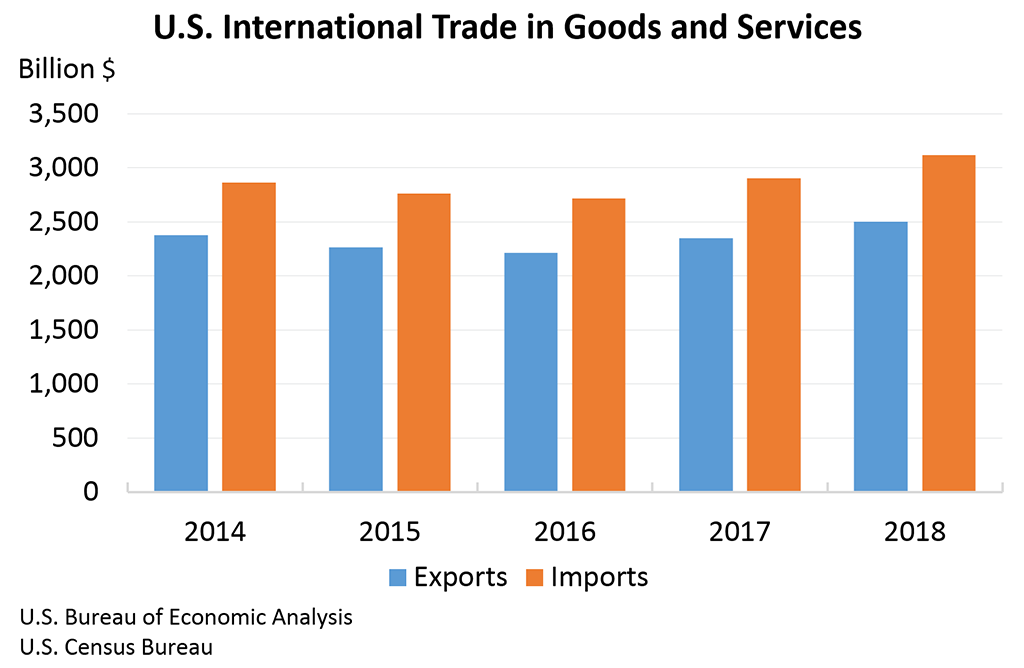
The 2018 increase in the goods and services deficit reflected an increase in the goods deficit of $83.8 billion, or 10.4 percent, to $891.3 billion and an increase in the services surplus of $15.0 billion, or 5.9 percent, to $270.2 billion.
As a percentage of U.S. gross domestic product, the goods and services deficit was 3.0 percent in 2018, up from 2.8 percent in 2017.
Exports (exhibits 3, 6, and 7)
Exports of goods increased $118.5 billion to $1,671.8 billion in 2018.
Exports of goods on a Census basis increased $117.8 billion.
- Industrial supplies and materials increased $74.2 billion.
- Crude oil increased $24.6 billion.
- Other petroleum products increased $14.4 billion.
- Capital goods increased $28.7 billion.
- Civilian aircraft engines increased $7.9 billion.
- Other industrial machines increased $2.9 billion.
- Computer accessories increased $2.5 billion.
Net balance of payments adjustments increased $0.6 billion.
Exports of services increased $30.4 billion to $828.1 billion in 2018.
- Other business services, which includes research and development services; professional and management services; and technical, trade-related, and other services, increased $8.5 billion.
- Financial services increased $4.6 billion.
- Travel (for all purposes including education) increased $4.3 billion.
Imports (exhibits 4, 6, and 8)
Imports of goods increased $202.2 billion to $2,563.1 billion in 2018.
Imports of goods on a Census basis increased $200.8 billion.
- Industrial supplies and materials increased $68.4 billion.
- Crude oil increased $24.6 billion.
- Capital goods increased $52.7 billion.
- Computers increased $8.7 billion.
- Electric apparatus increased $5.4 billion.
- Computer accessories increased $5.4 billion.
- Other industrial machines increased $5.1 billion.
- Consumer goods increased $46.1 billion.
- Pharmaceutical preparations increased $23.7 billion.
Net balance of payments adjustments increased $1.4 billion.
Imports of services increased $15.4 billion to $557.9 billion in 2018.
- Travel (for all purposes including education) increased $10.1 billion.
- Other business services increased $7.0 billion.
- Transport increased $6.5 billion.
- Insurance services decreased $13.0 billion.
Goods by Selected Countries and Areas – Census Basis (exhibits 14 and 14a)
The 2018 figures show surpluses, in billions of dollars, with South and Central America ($41.5), Hong Kong ($31.1), Netherlands ($24.8), Australia ($15.2), and Belgium ($14.2). Deficits were recorded, in billions of dollars, with China ($419.2), European Union ($169.3), Mexico ($81.5), Germany ($68.3), Japan ($67.6), Ireland ($46.8), Italy ($31.6), Malaysia ($26.5), India ($21.3), OPEC ($21.2), Canada ($19.8), Thailand ($19.3), Switzerland ($18.9), South Korea ($17.9), France ($16.2), Taiwan ($15.5), Russia ($14.1), Indonesia ($12.6), and Saudi Arabia ($10.5).
- The deficit with China increased $43.6 billion to $419.2 billion in 2018. Exports decreased $9.6 billion to $120.3 billion and imports increased $34.0 billion to $539.5 billion.
- The deficit with the European Union increased $17.9 billion to $169.3 billion in 2018. Exports increased $35.4 billion to $318.6 billion and imports increased $53.3 billion to $487.9 billion.
- The surplus with South and Central America increased $7.3 billion to $41.5 billion in 2018. Exports increased $13.6 billion to $163.8 billion and imports increased $6.3 billion to $122.3 billion.
* * *
All statistics referenced are seasonally adjusted; statistics are on a balance of payments basis unless otherwise specified. Additional statistics, including not seasonally adjusted statistics and details for goods on a Census basis, are available in exhibits 1-20b of this release. For information on data sources, definitions, and revision procedures, see the explanatory notes in this release. The full release can be found at www.census.gov/foreign-trade/Press-Release/current_press_release/index.html or www.bea.gov/data/intl-trade-investment/international-trade-goods-and-services. The full schedule is available in the Census Bureau's Economic Briefing Room at www.census.gov/economic-indicators/ or on BEA's Web site at www.bea.gov/news/schedule.
* * *
Next release: March 27, 2019, at 8:30 A.M. EDT
U.S. International Trade in Goods and Services, January 2019
* * *
Revised Release Schedule
The release schedule for the "U.S. International Trade in Goods and Services" report for the remainder of 2019 has been revised to reflect delays related to the recent lapse in federal funding. New dates are as follows:
| Report | Original Release Date | New Release Date |
|---|---|---|
| January 2019 | Thursday, March 7 | Wednesday, March 27 |
| February 2019 | Wednesday, April 3 | Wednesday, April 17 |
| March 2019 | Tuesday, May 7 | Thursday, May 9 |
The "U.S. International Trade in Goods and Services, April 2019" and "U.S. International Trade in Goods and Services, Annual Revision" reports will be released as originally scheduled on Thursday, June 6, 2019.
Change to OPEC
With the release of the "U.S. International Trade in Goods and Services, January 2019" report (FT-900), statistics for OPEC will exclude Qatar, which exited OPEC effective January 1, 2019. This change will affect exhibits 14, 17a, and 19 of the FT-900 and exhibit 4 of the FT-900 Supplement.
If you have questions or need additional information, please contact the Census Bureau, Economic Indicators Division, on (800) 549-0595, option 4, or at eid.international.trade.data@census.gov.