Bureau of Economic Analysis
New Foreign Direct Investment in the United States, 2024
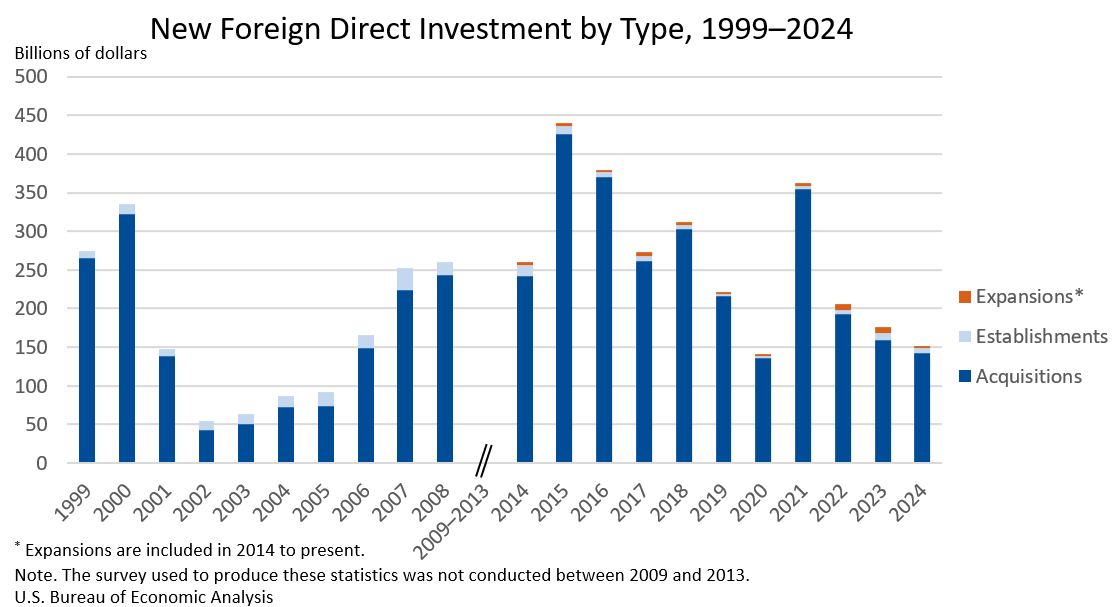
Expenditures by foreign direct investors to acquire, establish, or expand U.S. businesses totaled $151.0 billion in 2024, according to preliminary statistics released today by the U.S. Bureau of Economic Analysis. Expenditures decreased $24.9 billion, or 14.2 percent, from $176.0 billion (revised) in 2023 and were below the annual average of $277.2 billion for 2014–2023. As in previous years, acquisitions of existing U.S. businesses accounted for most of the expenditures.
Principal Federal Economic Indicators
Noteworthy
- 2025 News Release Schedule
- Innovation at BEA
- 2025 Annual Updates
- New! Services Trade Data for More Countries
- Data Tool: Trade in Value Added
- Distribution of State Personal Income
- Updated: RIMS II Regional Multipliers
- Arts and Culture
- Space Economy
- FDI Now in State BEARFACTS
- Quick Guide: Price Indexes
The Latest
Personal Consumption Expenditures by State, 2022
Nationally, personal consumption expenditures (PCE), in current dollars, increased 9.2 percent in 2022 after increasing 12.9 percent in 2021. PCE increased in all 50 states and the District of Columbia, with the percent change ranging from 11.8 percent in Idaho to 6.4 percent in Louisiana.
BEA Milestone: We’ve Got Your ‘Harmonized’ Number
A blog post from BEA Director Vipin Arora
I recently bought a pair of shorts that fit just right. They were so good that I bought a pair of jeans from the same brand. Somehow—and we've all been here—the jeans fit tighter than the shorts, even though they were made by the same company. This isn't too different from what I sometimes go through as a data user.
Personal Income by State, 2nd Quarter 2023
Personal income, in current dollars, increased in 49 states and the District of Columbia in the second quarter of 2023, with the percent change ranging from 6.1 percent in New York and the District of Columbia to –2.7 percent in Maine.
Personal Income by State, 2nd Quarter 2023
Personal income, in current dollars, increased in 49 states and the District of Columbia in the second quarter of 2023, with the percent change ranging from 6.1 percent in New York and the District of Columbia to –2.7 percent in Maine (table 1), according to statistics released today by the U.S. Bureau of Economic Analysis (BEA).
Personal Income and Outlays, August 2023
Personal income increased $87.6 billion (0.4 percent at a monthly rate) in August. Disposable personal income (DPI)—personal income less personal current taxes— increased $46.6 billion (0.2 percent). Personal outlays—the sum of personal consumption expenditures (PCE), personal interest payments, and personal current transfer payments—increased $86.0 billion (0.4 percent) and consumer spending increased $83.6 billion (0.4 percent). Personal…
Gross Domestic Product (Third Estimate) and Corporate Profits (Revised Estimate), Second Quarter 2023
Real gross domestic product (GDP) increased at an annual rate of 2.1 percent in the second quarter of 2023, according to the “third” estimate. In the first quarter, real GDP increased 2.2 percent (revised). The increase in the second quarter primarily reflected increases in business investment, consumer spending, and state and local government spending that were partly offset by a decrease in exports. Imports, which are a subtraction in the…
Gross Domestic Product (Third Estimate), Corporate Profits (Revised Estimate), Second Quarter 2023 and Comprehensive Update
Real gross domestic product (GDP) increased at an annual rate of 2.1 percent in the second quarter of 2023, according to the “third” estimate. In the first quarter, real GDP increased 2.2 percent (revised). The increase in the second quarter primarily reflected increases in business investment, consumer spending, and state and local government spending that were partly offset by a decrease in exports. Imports, which are a subtraction in the…
U.S. International Investment Position, 2nd Quarter 2023
The U.S. net international investment position, the difference between U.S. residents’ foreign financial assets and liabilities, was –$18.00 trillion at the end of the second quarter of 2023, according to statistics released today by the U.S. Bureau of Economic Analysis (BEA). Assets totaled $33.58 trillion, and liabilities were $51.58 trillion. At the end of the first quarter, the net investment position was –$16.74 trillion (revised).
U.S. International Investment Position, 2nd Quarter 2023
The U.S. net international investment position, the difference between U.S. residents’ foreign financial assets and liabilities, was -$18.00 trillion at the end of the second quarter of 2023, according to statistics released today by the U.S. Bureau of Economic Analysis (BEA). Assets totaled $33.58 trillion, and liabilities were $51.58 trillion. At the end of the first quarter, the net investment position was -$16.74 trillion (revised).


