Bureau of Economic Analysis
New Foreign Direct Investment in the United States, 2024
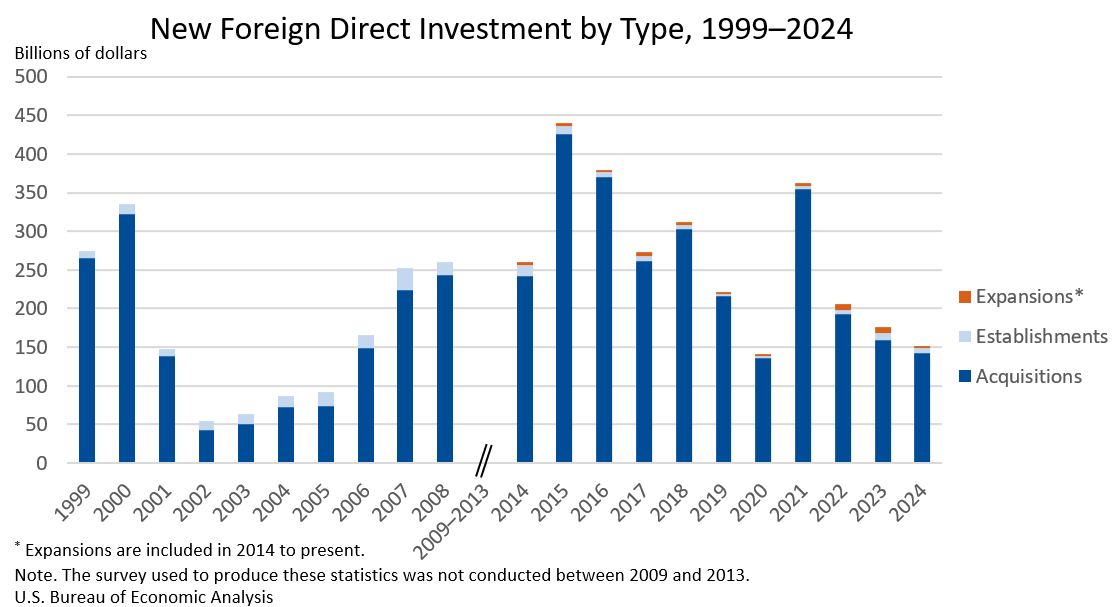
Expenditures by foreign direct investors to acquire, establish, or expand U.S. businesses totaled $151.0 billion in 2024, according to preliminary statistics released today by the U.S. Bureau of Economic Analysis. Expenditures decreased $24.9 billion, or 14.2 percent, from $176.0 billion (revised) in 2023 and were below the annual average of $277.2 billion for 2014–2023. As in previous years, acquisitions of existing U.S. businesses accounted for most of the expenditures.
Principal Federal Economic Indicators
Noteworthy
- 2025 News Release Schedule
- Innovation at BEA
- 2025 Annual Updates
- New! Services Trade Data for More Countries
- Data Tool: Trade in Value Added
- Distribution of State Personal Income
- Updated: RIMS II Regional Multipliers
- Arts and Culture
- Space Economy
- FDI Now in State BEARFACTS
- Quick Guide: Price Indexes
The Latest
Personal Income and Outlays, December 2016
Personal income increased $50.2 billion (0.3 percent) in December according to estimates released today by the Bureau of Economic Analysis. Disposable personal income (DPI) increased $43.6 billion (0.3 percent) and personal consumption expenditures (PCE) increased $63.1 billion (0.5 percent). Real DPI increased 0.1 percent in December and Real PCE increased 0.3 percent. The PCE price index increased 0.2 percent.
GDP Increases in Fourth Quarter
Real gross domestic product (GDP) increased 1.9 percent in the fourth quarter of 2016, according to the “advance” estimate released by the Bureau of Economic Analysis. In the third quarter, real GDP increased 3.5 percent.
Gross Domestic Product, 4th quarter and annual 2016 (advance estimate)
Real gross domestic product (GDP) increased at an annual rate of 1.9 percent in the fourth quarter of 2016 (table 1), according to the "advance" estimate released by the Bureau of Economic Analysis. In the third quarter, real GDP increased 3.5 percent. The Bureau emphasized that the fourth-quarter advance estimate released today is based on source data that are incomplete or subject to further revision by the source agency (see “Source Data…
Gross Domestic Product by Industry: Third Quarter 2016
Finance and insurance; wholesale trade; and information services were the leading contributors to the increase in U.S. economic growth in the third quarter of 2016. Overall, 20 of 22 industry groups contributed to the 3.5 percent increase in real GDP in the third quarter.
Gross Domestic Product by Industry, 3rd quarter 2016
Finance and insurance; wholesale trade; and information services were the leading contributors to the increase in U.S. economic growth in the third quarter of 2016. According to gross domestic product (GDP) by industry statistics released by the Bureau of Economic Analysis, 20 of 22 industry groups contributed to the overall 3.5 percent increase in real GDP in the third quarter.
BEA's API Expands Access to International Services Trade Data
More good news for developers and other “power users” of BEA data: The most detailed data on U.S. international trade in services published by the Bureau of Economic Analysis are now accessible through our application programming interface, or API. This includes detailed annual statistics on U.S.
November 2016 Trade Gap is $45.2 Billion
The U.S. monthly international trade deficit increased in November 2016 according to the U.S. Bureau of Economic Analysis and the U.S. Census Bureau. The deficit increased from $42.4 billion in October (revised) to $45.2 billion in November, as exports decreased and imports increased. The previously published October deficit was $42.6 billion. The goods deficit increased $3.4 billion in November to $66.6 billion. The services surplus…
U.S. International Trade in Goods and Services, November 2016
U.S. Census Bureau U.S. Bureau of Economic Analysis NEWS U.S. Department of Commerce * Washington, DC 20230 U.S. INTERNATIONAL TRADE IN GOODS AND SERVICES November 2016 The U.S. Census Bureau and the U.S.
U.S. Net International Investment Position Third Quarter 2016
The U.S. net international investment position increased to −$7,781.1 billion (preliminary) at the end of the third quarter of 2016 from −$8,026.9 billion (revised) at the end of the second quarter.
U.S. International Investment Position, 3rd quarter 2016
The U.S. net international investment position increased to -$7,781.1 billion (preliminary) at the end of the third quarter of 2016 from -$8,026.9 billion (revised) at the end of the second quarter, according to statistics released today by the Bureau of Economic Analysis (BEA). The $245.8 billion increase in the net investment position reflected a $346.2 billion increase in U.S. assets and a $100.5 billion increase in U.S.…


