
News Release
U.S. International Investment Position, First Quarter 2022 and Annual Update
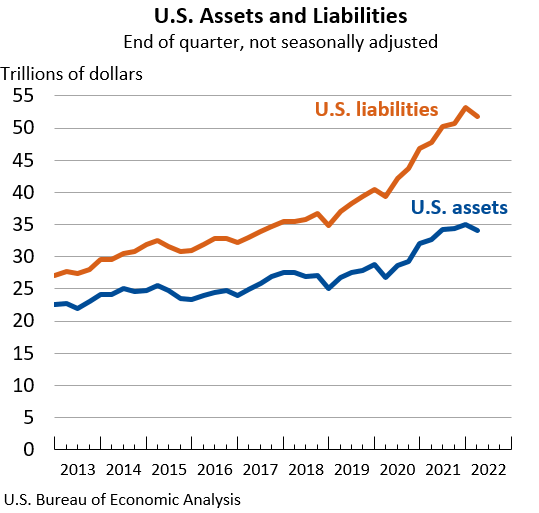
The U.S. net international investment position (IIP), the difference between U.S. residents’ foreign financial assets and liabilities, was –$17.75 trillion at the end of the first quarter of 2022, according to statistics released today by the U.S. Bureau of Economic Analysis (BEA). Assets totaled $34.00 trillion, and liabilities were $51.75 trillion. At the end of the fourth quarter, the net investment position was –$18.12 trillion. The net investment positions and components of assets and liabilities are presented in table 1.
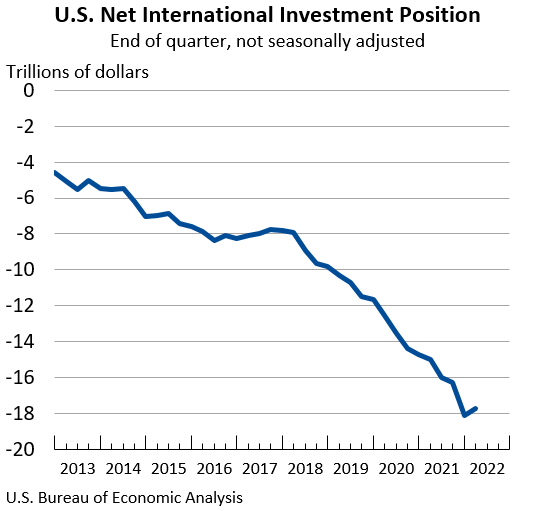
The $375.8 billion change in the net investment position from the fourth quarter of 2021 to the first quarter of 2022 came from net financial transactions of –$251.8 billion and net other changes in position, such as price and exchange-rate changes, of $627.6 billion. Net other changes mostly reflected decreases in U.S. stock and bond prices that exceeded decreases in foreign stock and bond prices, which lowered the value of U.S. liabilities more than U.S. assets (table A).
Table A. Quarterly Change in the U.S. Net International Investment Position
Billions of dollars, not seasonally adjusted
| End of quarter position, 2021:Q4 |
Change in position in 2022:Q1 | End of quarter position, 2022:Q1 |
|||
| Total | Attributable to: | ||||
| Financial transactions |
Other changes in position 1 |
||||
| U.S. net international investment position | -18,124.3 | 375.8 | -251.8 | 627.6 | -17,748.5 |
| Net position excluding financial derivatives | -18,144.2 | -333.3 | -257.6 | 590.9 | -17,810.9 |
| Financial derivatives other than reserves, net | 19.9 | 42.5 | 5.8 | 36.8 | 62.4 |
| U.S. assets | 35,065.5 | -1,066.3 | (2) | (2) | 33,999.2 |
| Assets excluding financial derivatives | 33,078.0 | -1,337.3 | 367.8 | -1,705.1 | 31,740.6 |
| Financial derivatives other than reserves | 1,987.5 | 271.0 | (2) | (2) | 2,258.5 |
| U.S. liabilities | 53,189.7 | -1,442.1 | (2) | (2) | 51,747.6 |
| Liabilities excluding financial derivatives | 51,222.1 | -1,670.6 | 625.4 | -2,296.0 | 49,551.5 |
| Financial derivatives other than reserves | 1,967.6 | 228.5 | (2) | (2) | 2,196.1 |
|
1. Disaggregation of other changes in position into price changes, exchange-rate changes, and other changes in volume and valuation is presented for annual statistics released in March and revised in June each year. 2. Financial transactions and other changes in financial derivatives positions are available on a net basis; they are not separately available for U.S. assets and U.S. liabilities. |
|||||
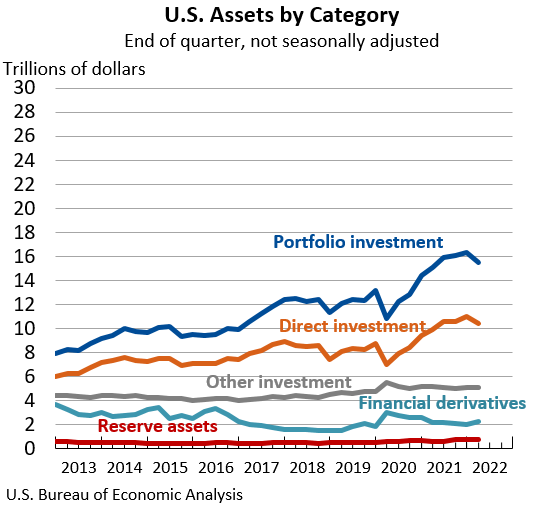
U.S. assets decreased by $1.07 trillion to a total of $34.00 trillion at the end of the first quarter, mostly reflecting price decreases in portfolio investment and direct investment assets. Portfolio investment assets decreased by $817.4 billion to $15.49 trillion, driven mainly by decreases in foreign stock and bond prices. Direct investment assets decreased by $557.9 billion to $10.41 trillion, driven mainly by decreases in foreign stock prices that lowered the market value of direct investment equity assets.
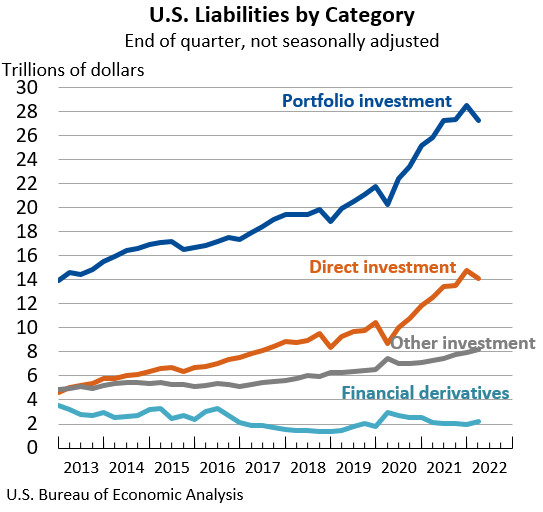
U.S. liabilities decreased by $1.44 trillion to a total of $51.75 trillion at the end of the first quarter, mostly reflecting price decreases in portfolio investment and direct investment liabilities. Portfolio investment liabilities decreased by $1.27 trillion to $27.21 trillion, driven mainly by decreases in U.S. stock and bond prices. Direct investment liabilities decreased by $682.6 billion to $14.13 trillion, driven mainly by decreases in U.S. stock prices that lowered the market value of direct investment equity liabilities.
Annual Update of the IIP Accounts
The statistics in this release reflect the annual update of the U.S. IIP Accounts. With this update, BEA has incorporated newly available and revised source data for 2019–2021 (table 2). In addition, there are two updates that are beyond the scope of updated source data:
- The investment positions and financial transactions for short-term portfolio investment assets for 2012–2021 have been revised to incorporate improved methodology and source data for foreign commercial paper and other short-term securities assets.
- For long-term portfolio investment assets and liabilities, BEA has revised the investment positions and financial transactions for 2019–2021 to address a large series break in the source data provided to BEA on holdings of long-term portfolio investment that resulted from unusually large data revisions by respondents on the monthly “Aggregate Holdings of Long-Term Securities by U.S. and Foreign Residents” (SLT) report for June 2021. For more information about the SLT revisions, see footnote 5 in the “Footnotes and Notices” section of “Securities (B): Portfolio Holdings of U.S. and Foreign Securities | U.S. Department of the Treasury.”
Newly Available and Revised Source Data: Key Providers and Years Affected
With this annual update of the IIP Accounts, BEA has added the two IIP tables 2.2 and 4.1, which were introduced in the IIP release on December 30, 2021, to the existing standard IIP table presentation in BEA’s Interactive Data Application and Data Application Programming Interface.
Table 2.2, which was introduced with statistics on U.S. special purpose entities (SPEs), has been expanded to include foreign SPEs for 2019–2021. Table 2.2 features annual statistics on direct investment positions in foreign and U.S. SPEs, which are legal entities with little or no employment or physical presence.
Table 4.1 has been updated to include new statistics for the first quarter of 2022 and revised statistics for the first quarter of 2020 to the fourth quarter of 2021. Table 4.1 features quarter-end position statistics on U.S. debt positions by currency, sector, and maturity for U.S. assets and liabilities.
More information on the annual update is available in “Preview of the 2022 Annual Update of the International Economic Accounts” in the April 2022 issue of the Survey of Current Business, and additional information will be published in July. The U.S. International Economic Accounts: Concepts and Methods has also been updated to reflect changes implemented with this annual update.
* * *
Next release: September 28, 2022, at 8:30 a.m. EDT
U.S. International Investment Position, Second Quarter 2022
* * *