
News Release
These data have been superseded. Please see our latest releases for current estimates and contact information.
Gross Domestic Product, 4th quarter and annual 2017 (advance estimate)
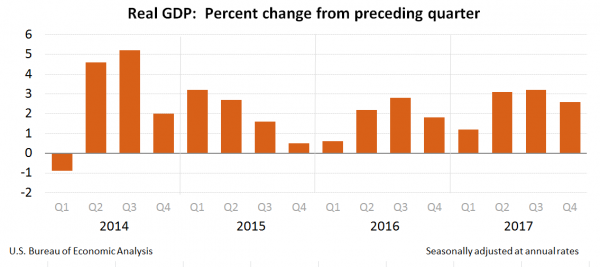
Real gross domestic product (GDP) increased at an annual rate of 2.6 percent in the fourth quarter of
2017 (table 1), according to the "advance" estimate released by the Bureau of Economic Analysis. In the
third quarter, real GDP increased 3.2 percent.

The Bureau emphasized that the fourth-quarter advance estimate released today is based on source
data that are incomplete or subject to further revision by the source agency (see "Source Data for the
Advance Estimate" on page 3). The "second" estimate for the fourth quarter, based on more complete
data, will be released on February 28, 2018.
The increase in real GDP in the fourth quarter reflected positive contributions from personal
consumption expenditures (PCE), nonresidential fixed investment, exports, residential fixed investment,
state and local government spending, and federal government spending that were partly offset by a
negative contribution from private inventory investment. Imports, which are a subtraction in the
calculation of GDP, increased (table 2).

The deceleration in real GDP growth in the fourth quarter reflected a downturn in private inventory
investment that was partly offset by accelerations in PCE, exports, nonresidential fixed investment, state
and local government spending, and federal government spending, and an upturn in residential fixed
investment. Imports, which are a subtraction in the calculation of GDP, turned up.

Current-dollar GDP increased 5.0 percent, or $238.3 billion, in the fourth quarter to a level of $19,738.9
billion. In the third quarter, current-dollar GDP increased 5.3 percent, or $250.6 billion (table 1 and table
3).

The price index for gross domestic purchases increased 2.5 percent in the fourth quarter, compared
with an increase of 1.7 percent in the third quarter (table 4). The PCE price index increased 2.8 percent,
compared with an increase of 1.5 percent. Excluding food and energy prices, the PCE price index
increased 1.9 percent, compared with an increase of 1.3 percent (appendix table A).


Personal Income (table 10)

Current-dollar personal income increased $178.9 billion in the fourth quarter, compared with an
increase of $112.3 billion in the third. The acceleration in personal income primarily reflected an upturn
in personal interest income and an acceleration in nonfarm proprietors’ income.

Disposable personal income increased $139.0 billion, or 3.9 percent, in the fourth quarter, compared
with an increase of $73.8 billion, or 2.1 percent, in the third. Real disposable personal income increased
1.1 percent, compared with an increase of 0.5 percent.

Personal saving was $384.4 billion in the fourth quarter, compared with $478.3 billion in the third. The
personal saving rate -- personal saving as a percentage of disposable personal income -- was 2.6 percent
in the fourth quarter, compared with 3.3 percent in the third.


2017 GDP

Real GDP increased 2.3 percent in 2017 (that is, from the 2016 annual level to the 2017 annual level),
compared with an increase of 1.5 percent in 2016 (table 1).

The increase in real GDP in 2017 primarily reflected positive contributions from PCE, nonresidential fixed
investment, and exports. Imports, which are a subtraction in the calculation of GDP, increased (table 2).

The acceleration in real GDP from 2016 to 2017 reflected upturns in nonresidential fixed investment and
in exports and a smaller decrease in private inventory investment.  These movements were partly offset
by decelerations in residential fixed investment and in state and local government spending. Imports,
which are a subtraction in the calculation of GDP, accelerated.

Current-dollar GDP increased 4.1 percent, or $762.3 billion, in 2017 to a level of $19,386.8 billion,
compared with an increase of 2.8 percent, or $503.8 billion, in 2016 (table 1 and table 3).

The price index for gross domestic purchases increased 1.8 percent in 2017, compared with an increase
of 1.0 percent in 2016 (table 4). The PCE price index increased 1.7 percent, compared with an increase
of 1.2 percent. Excluding food and energy prices, the PCE price index increased 1.5 percent, compared
with an increase of 1.8 percent (appendix table A).

During 2017 (measured from the fourth quarter of 2016 to the fourth quarter of 2017), real GDP
increased 2.5 percent, compared with an increase of 1.8 percent during 2016.  The price index for gross
domestic purchases increased 1.9 percent during 2017, compared with an increase of 1.4 percent during
2016 (table 7).


Source Data for the Advance Estimate

Information on the assumptions used for unavailable source data in the advance estimate is provided in
a Technical Note that is posted with the news release on BEA’s Web site. A detailed "Key Source Data
and Assumptions" file is also posted for each release. For information on updates to GDP, see the
"Additional Information" section that follows.

                                   *          *          *
                     Next release:  February 28, 2018 at 8:30 A.M. EST
                Gross Domestic Product:  Fourth Quarter 2017 (Second Estimate)
                                   *          *          *

Additional Information

                                        Release Dates in 2018


      Estimate                   2017: IV and annual    2018: I           2018: II           2018: III
Gross Domestic Product
 Advance                         January 26             April 27          July 27            October 26
 Second                          February 28            May 30            August 29          November 28
 Third                           March 28               June 28           September 27       December 21

Corporate Profits
 Preliminary                     …                      May 30            August 29          November 28
 Revised                         March 28               June 28           September 27       December 21