
News Release
U.S. International Transactions: Second Quarter 2018
Current-Account Balance
The U.S. current-account deficit decreased to $101.5 billion (preliminary) in the second quarter of 2018 from $121.7 billion (revised) in the first quarter of 2018, according to statistics released by the Bureau of Economic Analysis (BEA). The deficit was 2.0 percent of current-dollar gross domestic product (GDP) in the second quarter, down from 2.4 percent in the first quarter.
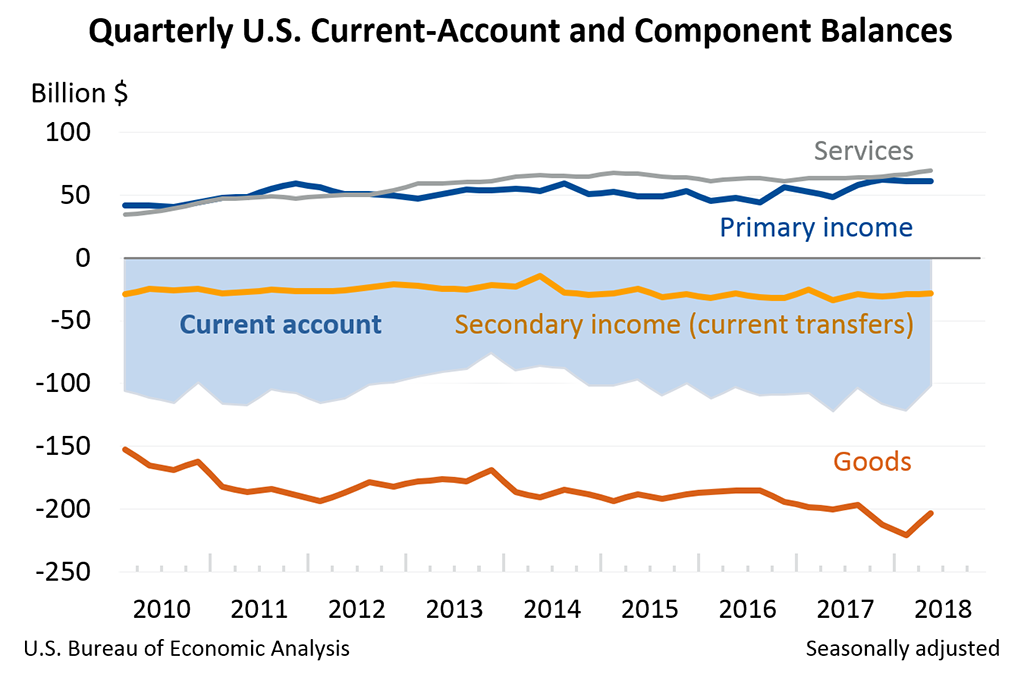
The $20.3 billion decrease in the current-account deficit reflected a $17.6 billion decrease in the deficit on goods, a $2.5 billion increase in the surplus on services, and relatively small and offsetting changes in the balances on primary income and secondary income.
Current-Account Transactions (tables 1-5)
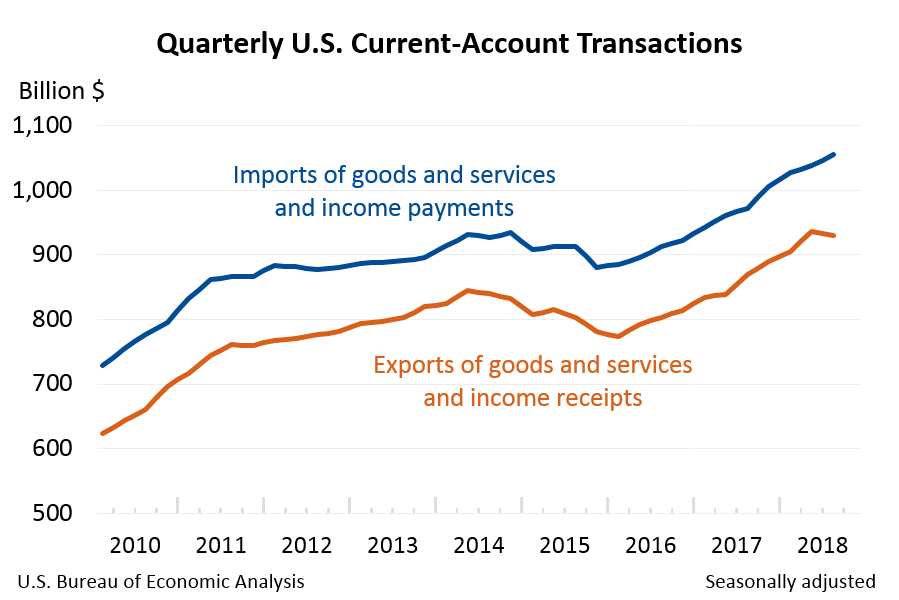
Exports of goods and services and income receipts
Exports of goods and services and income receipts increased $28.0 billion in the second quarter to $933.3 billion.
- Goods exports increased $17.8 billion to $429.2 billion, mostly reflecting increases in industrial supplies and materials, primarily petroleum and products, and in foods, feeds, and beverages, primarily soybeans.
- Primary income receipts increased $3.9 billion to $259.9 billion, primarily reflecting increases in portfolio investment income and in other investment income. A decrease in direct investment income partly offset the increases. For more information on direct investment income, see the box "Effects of the 2017 Tax Cuts and Jobs Act on Components of the International Transactions Accounts."
- Services exports increased $3.2 billion to $209.2 billion, mainly reflecting increases in other business services, led by professional and management consulting services, in financial services, and in charges for the use of intellectual property.
Imports of goods and services and income payments
Imports of goods and services and income payments increased $7.7 billion in the second quarter to $1,034.7 billion.
- Primary income payments increased $4.2 billion to $199.1 billion, mainly reflecting increases in other investment income and in portfolio investment income. A decrease in direct investment income partly offset the increases.
- Secondary income payments increased $2.7 billion to $63.4 billion, primarily reflecting an increase in U.S. government grants.
Effects of the 2017 Tax Cuts and Jobs Act on Components of the International Transactions Accounts
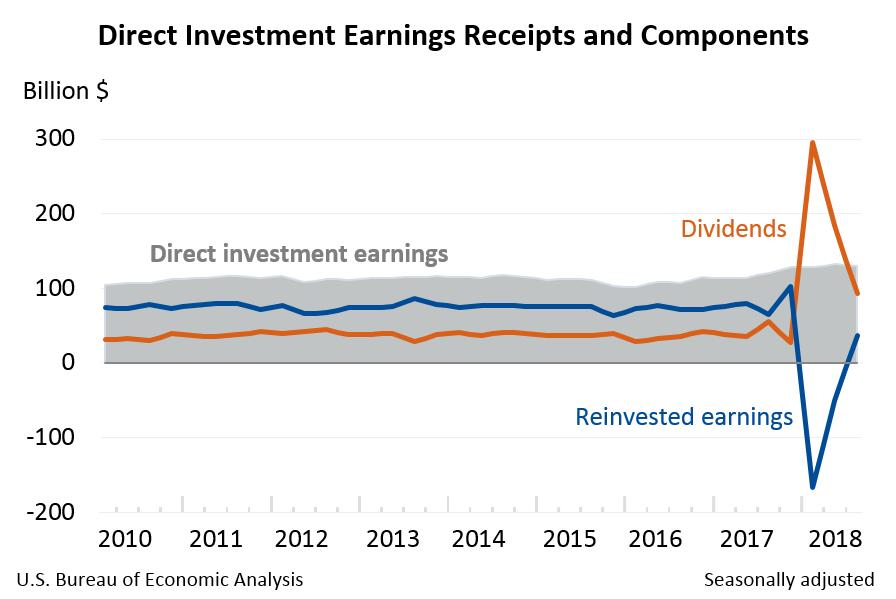
In the international transactions accounts, income on equity, or earnings, of foreign affiliates of U.S. multinational enterprises in a period typically consists of a portion that is repatriated to the parent company in the United States in the form of dividends and a portion that is reinvested in foreign affiliates. At times, repatriation of dividends exceeds current-period earnings, resulting in negative values being recorded for reinvested earnings. With the revised statistics for the first quarter of 2018, earnings were $128.1 billion, with dividends and withdrawals of $294.9 billion and reinvested earnings of −$166.8 billion. With the preliminary statistics for the second quarter, earnings were $126.8 billion, with dividends and withdrawals of $169.5 billion and reinvested earnings of −$42.7 billion (table 4).
The large magnitudes for dividends and withdrawals and the negative reinvested earnings reflect the repatriation of accumulated earnings by foreign affiliates of U.S. multinational enterprises to their parent companies in the United States in response to the 2017 Tax Cuts and Jobs Act (TCJA). The TCJA requires U.S. parent companies to pay a one-time tax on their accumulated earnings held abroad, but generally eliminates taxes on repatriated earnings. The negative reinvested earnings in the first and second quarters reflect the fact that dividends exceeded earnings and U.S. parent companies withdrew accumulated prior earnings from their foreign affiliates. The negative reinvested earnings are also reflected in the net acquisition of direct investment assets in the financial account, which was −$139.3 billion in the first quarter and −$29.0 billion in the second quarter (table 6).
For more information, see "How does the 2017 Tax Cuts and Jobs Act affect BEA's business income statistics?" and "How are the international transactions accounts affected by an increase in direct investment dividend receipts?"
In addition to the repatriation of accumulated earnings, some companies made other changes to their business practices in reaction to the TCJA. For example, some insurance companies changed how they operate in response to the base erosion and anti-abuse tax (BEAT) provision of the TCJA. BEAT is a tax on certain payments from a U.S. company to a related foreign party, which can include premium payments for reinsurance. In response to the new tax, many U.S. insurance companies terminated these intracompany reinsurance contracts. As a result, premiums paid by U.S. insurers to foreign insurers in the first and second quarters of 2018, at $24.0 billion and $23.7 billion respectively, were down from $31.4 billion in the fourth quarter of 2017 and other recent quarters (table 3). Similarly, insurance services imports in the first and second quarters, at $9.8 billion and $9.2 billion respectively, were down from $12.4 billion in the fourth quarter of 2017 and other recent quarters.
For more information on the estimation methods used to compile insurance services, see the insurance section in "U.S. International Economic Accounts: Concepts and Methods."
Financial Account (tables 1, 6, 7, and 8)
Net U.S. borrowing measured by financial-account transactions was $134.3 billion in the second quarter, a decrease from net borrowing of $160.9 billion in the first quarter.
Financial assets
Net U.S. liquidation of financial assets excluding financial derivatives was $175.1 billion in the second quarter following net U.S. acquisition of $251.1 billion in the first quarter.
- Net U.S. sales of portfolio investment assets was $23.7 billion following net U.S. purchases of $304.1 billion in the first quarter. This change mostly reflected net U.S. sales of foreign equity and investment fund shares following net purchases in the first quarter.
- Net U.S. liquidation of other investment assets was $125.5 billion following net U.S. acquisition of $86.4 billion in the first quarter. This change mostly reflected net foreign repayment of loans following net U.S. provision of loans to foreigners in the first quarter.
- Net U.S. withdrawal of direct investment assets decreased $110.4 billion to $29.0 billion. The net withdrawal of direct investment assets reflected U.S. parent repatriation of previously reinvested earnings in response to the TCJA. For more information, see the box "Effects of the 2017 Tax Cuts and Jobs Act on Components of the International Transactions Accounts."
Liabilities
Net U.S. repayment of liabilities excluding financial derivatives was $57.7 billion in the second quarter following net U.S. incurrence of $441.1 billion in the first quarter.
- Net U.S. incurrence of portfolio investment liabilities decreased $291.4 billion to $10.1 billion, reflecting both net foreign sales of U.S. equity and investment fund shares following net purchases in the first quarter and a decrease in net foreign purchases of U.S. long-term debt securities.
- Net U.S. repayment of other investment liabilities was $92.4 billion following net incurrence of $81.6 billion in the first quarter. This change mostly reflected net U.S. repayment of loan liabilities following net incurrence of loans in the first quarter.
Financial derivatives
Transactions in financial derivatives other than reserves reflected second-quarter net borrowing of $17.0 billion following net lending of $29.0 billion in the first quarter.
Statistical Discrepancy (table 1)
The statistical discrepancy was −$32.9 billion in the second quarter following a statistical discrepancy of −$39.2 billion in the first quarter.
Updates to First Quarter 2018 International Transactions Accounts Aggregates
Billions of dollars, seasonally adjusted
| Preliminary estimate | Revised estimate | |
|---|---|---|
| Current-account balance | −124.1 | −121.7 |
| Goods balance | −220.5 | −220.8 |
| Services balance | 64.9 | 66.8 |
| Primary-income balance | 62.0 | 61.2 |
| Secondary-income balance | −30.5 | −28.9 |
| Net lending (+)/borrowing (−) from financial-account transactions | −180.6 | −160.9 |
| Statistical discrepancy | −56.5 | −39.2 |
Next release: December 19, 2018 at 8:30 A.M. EST
U.S. International Transactions, Third Quarter 2018