
 Anyone interested in economic growth in, let’s say, West Virginia can check state GDP data from the U.S. Bureau of Economic Analysis. Want to zoom in on a metro area, such as Charleston, W.Va., and its surroundings? BEA has gross domestic product by metropolitan areas, too.
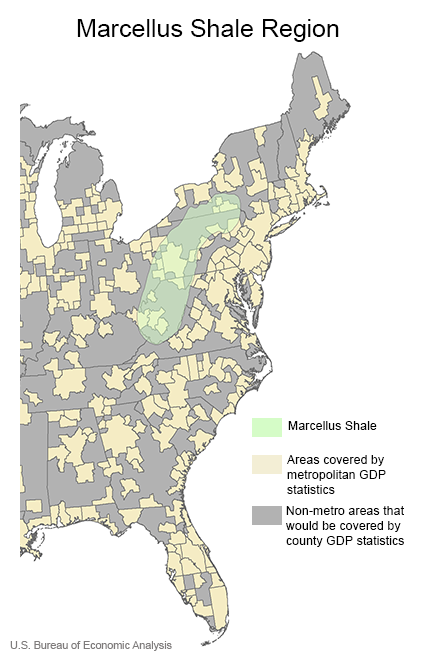
But what if you’re interested in the Marcellus Shale natural gas field that stretches beneath West Virginia and into several other states? The Marcellus doesn’t follow state lines, or stick to metropolitan areas. How to measure its economic footprint?
BEA is exploring an idea that would be a big help: county-by-county GDP.
A recent study by BEA economists concluded that producing statistics on the performance of the nation’s more than 3,000 counties would provide a much fuller picture of U.S. economic activity. That’s because the experiences of many counties don’t match statewide economic patterns or what’s happening in the nearest cities.
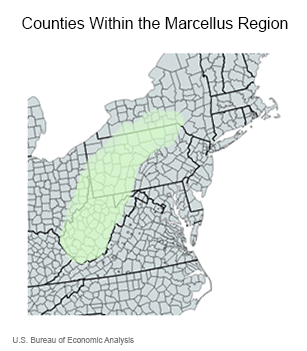
In the case of the Marcellus Shale, county GDP statistics could enable data users to map the natural resources and mining industry in that region by combining data from selected counties in West Virginia, Pennsylvania, New York and surrounding states.
 Other potential benefits of producing county GDP include:
- Aiding efforts to attract jobs and investment. Officials who plan local economic development efforts currently rely on BEA’s county-level personal income statistics. Adding a measure of the value of the goods and services produced in each county would give policymakers a much more complete picture of a county’s needs and its economic strengths and weaknesses.
- Capturing the local impact of industries. That could mean charting the growing value of housing services during a tourism boom in Teton County, Wyo., for example, or seeing the economic differences between Texas counties with lots of manufacturing and those that rely more on oil and gas.
- Revealing long-term trends. Studying county GDP data over time could show how well an incentive program has worked to draw in new businesses, or document how the economic structure of Lincoln County, Mont., changed as the population aged.
- Improving other BEA statistics. The new methodologies and data needed to produce reliable county statistics also would provide better detail for state and metro area GDP.
BEA economists are researching the data acquisition, methodologies and modeling techniques that could be used to add counties to the agency’s stable of national, state and metro GDP statistics. For more about this effort, see the paper titled “A Research Agenda for Measuring GDP at the County Level” on BEA’s website or read the summary in the Survey of Current Business.
BEA wants to hear what data users think about the proposed methodologies and other issues surrounding development of GDP by county. Email your comments or questions to gdpbycounty@bea.gov.