
News Release
U.S. International Transactions, 1st Quarter 2023 and Annual Update
Current-Account Deficit Widens by 1.5 Percent in First Quarter
Current-Account Balance
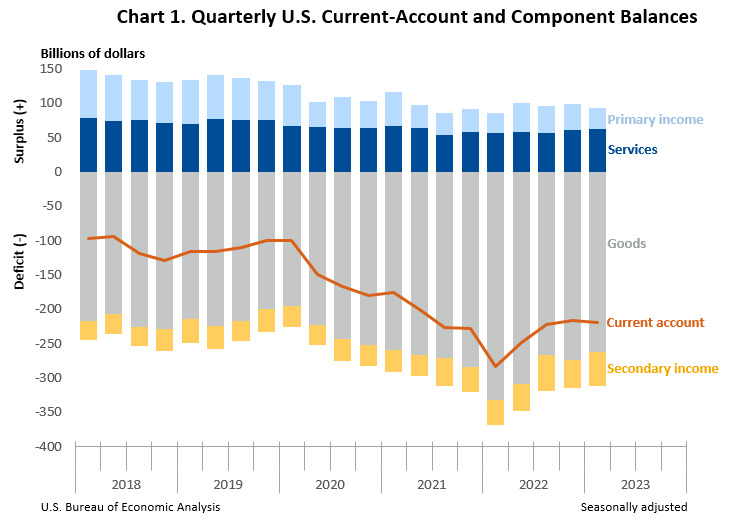
The U.S. current-account deficit, which reflects the combined balances on trade in goods and services and income flows between U.S. residents and residents of other countries, widened by $3.1 billion, or 1.5 percent, to $219.3 billion in the first quarter of 2023, according to statistics released today by the U.S. Bureau of Economic Analysis (BEA). The revised fourth-quarter deficit was $216.2 billion.
The first-quarter deficit was 3.3 percent of current-dollar gross domestic product, up less than 0.1 percent from the fourth quarter.
The $3.1 billion widening of the current-account deficit in the first quarter primarily reflected an expanded deficit on secondary income and a reduced surplus on primary income that were partly offset by a reduced deficit on goods.
Current-Account Transactions (tables 1–5)
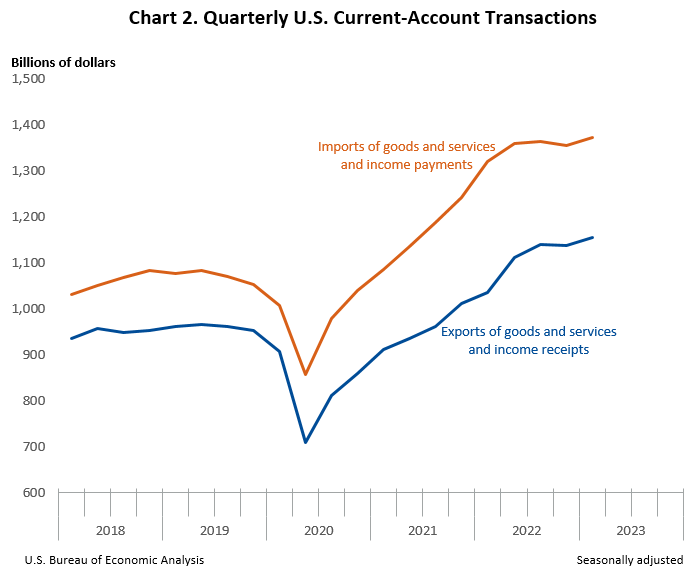
Exports of goods and services to, and income received from, foreign residents increased $16.0 billion to $1.15 trillion in the first quarter. Imports of goods and services from, and income paid to, foreign residents increased $19.1 billion to $1.37 trillion.1
Trade in goods (table 2)
Exports of goods increased $8.9 billion to $526.6 billion, reflecting increases in consumer goods, mostly medicinal, dental, and pharmaceutical products, and in other general merchandise, mostly goods transferred through the Presidential Drawdown Authority.2 Partly offsetting was a decrease in industrial supplies and materials, mostly natural gas and petroleum and products. Imports of goods decreased $2.1 billion to $789.7 billion, reflecting a decrease in industrial supplies and materials, mainly petroleum and products and chemicals, that was partly offset by an increase in automotive vehicles, parts, and engines, mainly passenger cars and trucks, buses, and special purpose vehicles.
Trade in services (table 3)
Exports of services increased $3.5 billion to $244.3 billion, and imports of services increased $2.0 billion to $182.2 billion. The increases in both exports and imports primarily reflected an increase in travel, mostly other personal travel.
Primary income (table 4)
Receipts of primary income increased $12.1 billion to $338.6 billion, and payments of primary income increased $18.9 billion to $307.3 billion. The increases in both receipts and payments primarily reflected increases in other investment income, mostly interest on loans and deposits. These increases were mainly due to higher short-term interest rates amid tightening of U.S. and foreign monetary policy.
Secondary income (table 5)
Receipts of secondary income decreased $8.5 billion to $44.5 billion, reflecting a decrease in general government transfers, mainly fines and penalties. Payments of secondary income increased $0.4 billion to $94.1 billion, reflecting an increase in private transfers, mainly insurance-related transfers.
Capital-Account Transactions (table 1)
Capital-transfer receipts increased $20 million to $43 million. Capital-transfer payments increased $2.5 billion to $6.0 billion, reflecting an increase in infrastructure grants, mostly related to goods transferred through the Presidential Drawdown Authority (see footnote 2).
Financial-Account Transactions (tables 1, 6, 7, and 8)
Net financial-account transactions were −$326.8 billion in the first quarter, reflecting net U.S. borrowing from foreign residents.
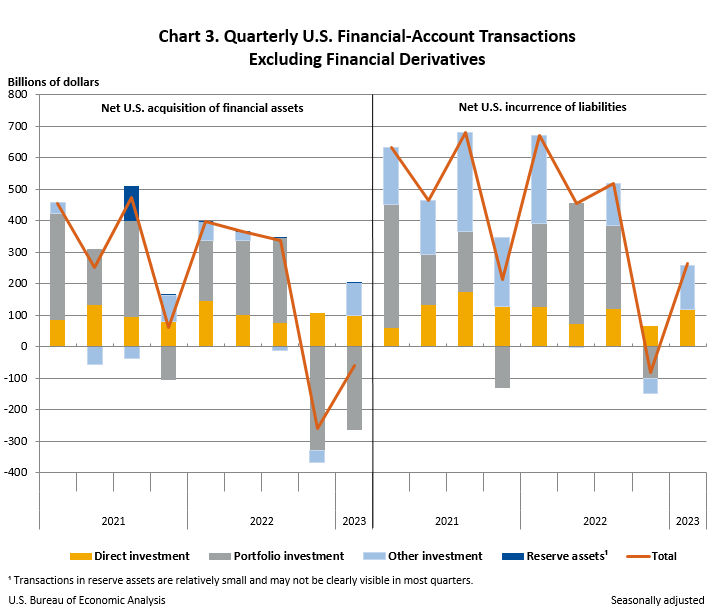
Financial assets (tables 1, 6, 7, and 8)
First-quarter transactions decreased U.S. residents' foreign financial assets by $59.7 billion. Transactions decreased portfolio investment assets, mainly equity, by $263.3 billion. Transactions increased other investment assets by $102.0 billion, as transactions increased loans and decreased deposits; direct investment assets, mostly equity, by $100.8 billion; and reserve assets by $0.8 billion.
Liabilities (tables 1, 6, 7, and 8)
First-quarter transactions increased U.S. liabilities to foreign residents by $265.4 billion. Transactions increased other investment liabilities, mostly loans and deposits, by $140.7 billion; direct investment liabilities, mostly equity, by $118.7 billion; and portfolio investment liabilities by $6.0 billion, as transactions increased long-term debt securities and decreased equity.
Financial derivatives (table 1)
Net transactions in financial derivatives were –$1.7 billion in the first quarter, reflecting net U.S. borrowing from foreign residents.
|
Table A. Updates to Fourth-Quarter 2022 International Transactions Accounts Balances [Billions of dollars, seasonally adjusted] |
||
| Preliminary estimates | Revised estimates | |
|---|---|---|
| Current-account balance | –206.8 | −216.2 |
| Goods balance | −272.4 | −274.1 |
| Services balance | 67.3 | 60.6 |
| Primary income balance | 39.3 | 38.1 |
| Secondary income balance | −41.1 | −40.7 |
| Net financial-account transactions | −127.5 | −186.6 |
| U.S. Bureau of Economic Analysis | ||
Annual Update of the U.S. International Transactions Accounts
The statistics in this release reflect the annual update of the U.S. International Transactions Accounts. With this update, BEA has incorporated newly available and revised source data and recalculated seasonal adjustments for 2017–2022. This annual update also reflects the incorporation of (1) BEA's 2019 Benchmark Survey of U.S. Direct Investment Abroad, which resulted in revisions to direct investment transactions in financial assets and liabilities and income receipts and payments for 2019–2022, and (2) improved methodology and source data for transfers through the Presidential Drawdown Authority, which resulted in revisions to goods exports, services exports, international cooperation payments in the current account, and investment grant payments in the capital account for 2021 and 2022. A summary of the revisions to high-level aggregates is shown in table 9.
Table B. Newly Available and Revised Source Data: Key Providers and Years Affected
| Agency | Data | Years affected |
|---|---|---|
| U.S. Bureau of Economic Analysis | Quarterly international trade in services surveys | 2020–2022 |
| Benchmark, annual, and quarterly direct investment surveys | 2019–2022 | |
| U.S. Census Bureau | Revised source data for international trade in goods | 2020–2022 |
| U.S. Department of the Treasury | Annual portfolio investment surveys | 2021–2022 |
| Quarterly and monthly portfolio and other investment surveys | 2020–2022 | |
| U.S. Bureau of Economic Analysis | ||
More information on the annual update is available in "Preview of the 2023 Annual Update of the International Economic Accounts" in the Survey of Current Business. Additional information will be provided in the Survey in July. U.S. International Economic Accounts: Concepts and Methods has been updated to reflect changes implemented with this annual update.
Change to the Euro Area
With this release, statistics beginning with the first quarter of 2023 for the area grouping "Euro Area" include Croatia, which adopted the euro as its currency effective January 1, 2023.
Next release: September 21, 2023, at 8:30 a.m. EDT
U.S. International Transactions, 2nd Quarter 2023
1 U.S. international transactions are presented in current dollars in accordance with international statistical presentation guidelines. For a comparison of current-dollar, or nominal, and inflation-adjusted, or real, measures of international transactions, see "SECTION 4 – FOREIGN TRANSACTIONS" of the National Income and Product Accounts.
2 For more information, see "Preview of the 2023 Annual Update of the International Economic Accounts" in the Survey of Current Business.