
Many U.S. multinational enterprises (MNEs) have complex ownership structures in which one foreign affiliate owns other foreign affiliates. BEA’s U.S. MNE statistics cover all foreign affiliates owned by U.S. parent companies, either directly or indirectly through an affiliate, so that the data reflect the full operations of U.S. MNEs. For some of BEA’s U.S. MNE statistics, particularly financial data, users should be aware of certain characteristics of the data that result from complex corporate structures when selecting measures of affiliate finances for research or analysis.
In its MNE statistics, BEA presents balance sheet and income statement data for foreign affiliates of U.S. MNEs. Some MNEs have many ownership tiers abroad, and ownership of a lower-tier affiliate is included as an asset in the balance sheet of each foreign affiliate up the ownership chain to its U.S. parent. This characteristic of the data allows users to analyze the complete financial structure of U.S. MNEs and provides a window into the overall degree of complexity of MNE ownership structures. Because the balance sheet statistics reflect the cumulative balance sheets of each foreign affiliate (both the top and lower tiers), ownership in lower-tier affiliates results in “double (or more) counting” in the aggregate statistics. The income statement is similarly affected.
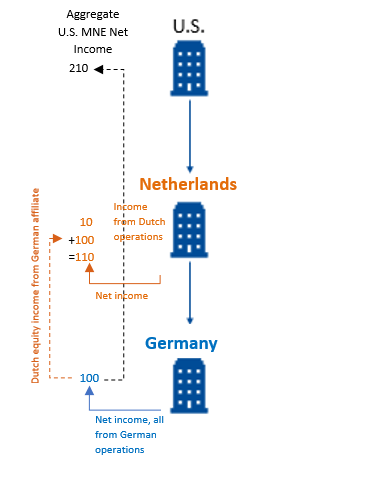
For example, consider a U.S. parent company that owns a holding-company affiliate in the Netherlands, which in turn owns a German manufacturing affiliate. The German affiliate generates $100 million in net income from its manufacturing operations. The affiliate in the Netherlands generates $110 million in net income: $10 million from its own operations to go along with the $100 million of equity income from its investment in the German affiliate. BEA’s income statement statistics would show $100 million in Germany and $110 million in the Netherlands for a total net income of $210 million. The aggregated data overstates the income of the MNE by $100 million, but the subtotals for Germany and the Netherlands accurately reflect the net income of those affiliates. For more complex ownership chains, the same income could be counted more than twice.
BEA separately shows the value of income from equity investments in other foreign affiliates (in this example, $100 million) as a component of the aggregated income statement statistics, allowing data users to exclude this double-counted income from in their analysis. Doing so leaves a total of $100 million of operational net income in Germany and $10 million of operational net income in the Netherlands for a total operational net income of $110.
Similarly, in the balance sheet statistics, the item equity investments in other foreign affiliates is separately shown, allowing data users to exclude the value of affiliates’ ownership of other foreign affiliates from total assets for analytical purposes.
Some other data series from the activities statistics used for analysis of MNEs are not affected in the same way by ownership structures. For example, the activities statistics count each employee of a foreign affiliate and each dollar of research and development spending exactly once. BEA’s statistics on direct investment transactions and positions are also not affected in the same way because for these statistics, only direct transactions are included. So to go back to the example, data for the German affiliate would be excluded, but data for the Netherlands affiliate would include its ownership of and income from the German affiliate.