
News Release
Direct Investment by Country and Industry, 2020
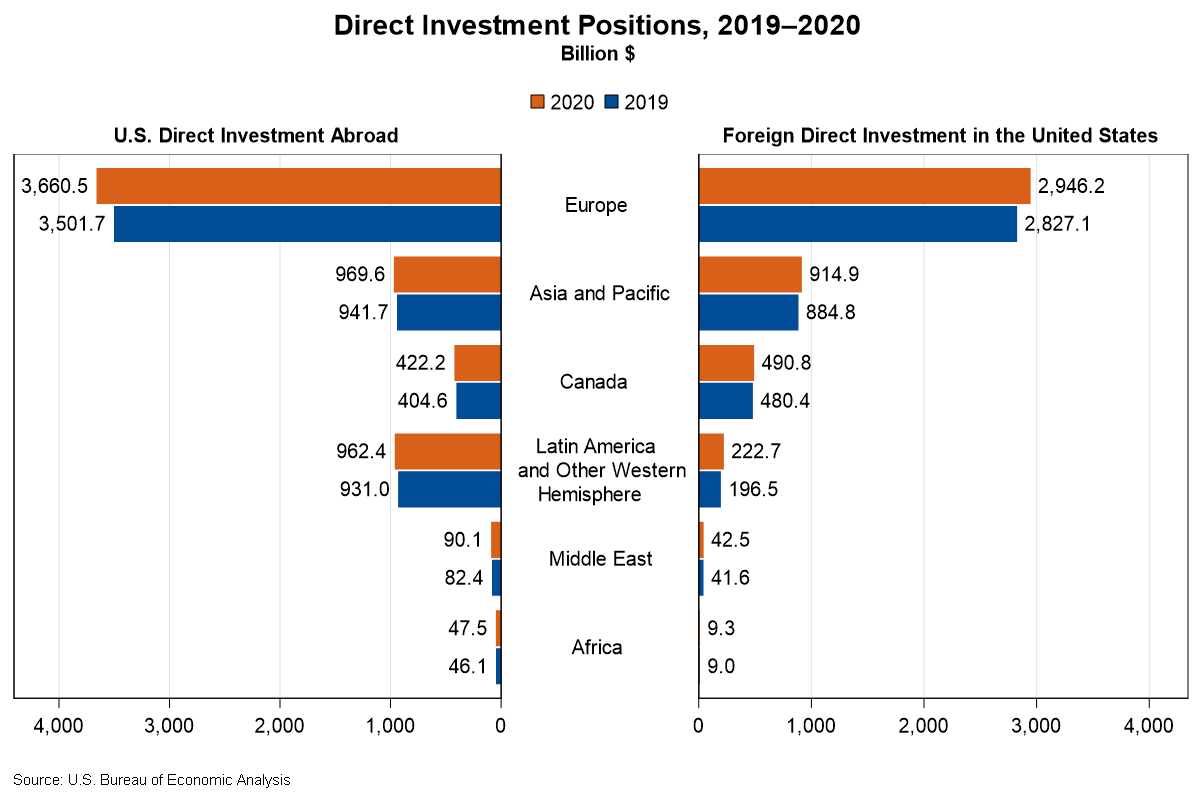
The U.S. direct investment abroad position, or cumulative level of investment, increased $244.9 billion to $6.15 trillion at the end of 2020 from $5.91 trillion at the end of 2019, according to statistics released by the Bureau of Economic Analysis (BEA). The increase reflected a $158.8 billion increase in the position in Europe, primarily in the United Kingdom and the Netherlands. By industry, holding company affiliates owned by U.S. manufacturers had the largest increase.
The foreign direct investment in the United States position increased $187.2 billion to $4.63 trillion at the end of 2020 from $4.44 trillion at the end of 2019. The increase mainly reflected a $119.2 billion increase in the position from Europe, primarily Germany. By industry, affiliates in manufacturing, finance and insurance, and wholesale trade accounted for the majority of the increase.
U.S. direct investment abroad (tables 1 – 6)
U.S. multinational enterprises (MNEs) invest in nearly every country, but their investment in affiliates in five countries accounted for more than half of the total position at the end of 2020. The U.S. direct investment abroad position was largest in the United Kingdom ($890.1 billion), followed by the Netherlands ($844.0 billion) and Luxembourg ($759.4 billion). Canada ($422.2 billion) and Ireland ($390.3 billion) rounded out the top-five.
By industry of the directly-owned foreign affiliate, investment was highly concentrated in holding companies, which accounted for nearly half of the overall position in 2020. Most holding company affiliates, which are owned by U.S. parents from a variety of industries, own other foreign affiliates that operate in a variety of industries. By industry of the U.S. parent, investment by manufacturing MNEs accounted for 51.6 percent of the position, followed by MNEs in finance and insurance (13.9 percent).
U.S. MNEs earned income of $452.0 billion in 2020 on their cumulative investment abroad, a 13.0 percent decrease from 2019. Dividends, or repatriated profits, decreased $124.6 billion, or 30.7 percent.
Foreign direct investment in the United States (tables 7 – 10)
By country of the foreign parent, five countries accounted for more than half of the total position at the end of 2020. Japan remained the top investing country at the end of 2020 with a position of $647.7 billion. Canada ($490.8 billion) moved up one position from 2019 to be the second largest investing country, moving the United Kingdom ($486.9 billion) into third. The Netherlands ($484.0 billion) and Germany ($411.3 billion) were the fourth and fifth largest investing countries respectively at the end of 2020.
By country of the ultimate beneficial owner (UBO), Japan ($679.0 billion) and Canada ($569.8 billion) remained the top investing countries in terms of position at the end of 2020. Germany ($564.3 billion) moved up one position from 2019 to be the third largest, moving the United Kingdom ($480.8 billion) to fourth. France ($315.0 billion) entered the top 5 investing countries at the end of 2020, moving up one position from 2019. On the UBO basis, investment from the Netherlands and Luxembourg was much lower than by the country of foreign parent, indicating that much of the investment from foreign parents in these countries was ultimately owned by investors in other countries.
Foreign direct investment in the United States was concentrated in the U.S. manufacturing sector, which accounted for 40.3 percent of the position. There was also sizable investment in finance and insurance (12.2 percent) and wholesale trade (11.1 percent).
Foreign MNEs earned income of $151.8 billion in 2020 on their cumulative investment in the United States, a 24.1 percent decrease from 2019.
Updates to Direct Investment Statistics
BEA statistics for U.S. direct investment abroad and foreign direct investment in the United States for 2017–2019 are revised to incorporate newly available and revised source data.
Next release: July 2022
Direct Investment by Country and Industry, 2021