
News Release
Gross Domestic Product (Third Estimate), Corporate Profits, and GDP by Industry, Fourth Quarter and Year 2021
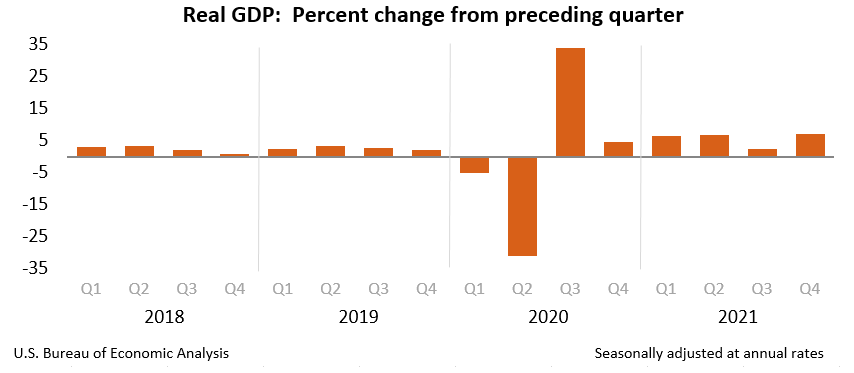
Real gross domestic product (GDP) increased at an annual rate of 6.9 percent in the fourth quarter of 2021 (table 1), according to the "third" estimate released by the Bureau of Economic Analysis. In the third quarter, real GDP increased 2.3 percent.
The "third" estimate of GDP released today is based on more complete source data than were available for the "second" estimate issued last month. In the second estimate, the increase in real GDP was 7.0 percent. The downward revision primarily reflected downward revisions to personal consumption expenditures (PCE) and exports that were partly offset by an upward revision to private inventory investment (refer to "Updates to GDP").
The increase in real GDP primarily reflected increases in private inventory investment, exports, PCE, and nonresidential fixed investment that were partly offset by decreases in both federal and state and local government spending. Imports, which are a subtraction in the calculation of GDP, increased (table 2).
The increase in private inventory investment was led by retail and wholesale trade industries. Within retail, inventory investment by motor vehicle dealers was the leading contributor. The increase in exports reflected increases in both goods and services. The increase in exports of goods was widespread, and the leading contributors were consumer goods, foods, feeds, and beverages, as well as industrial supplies and materials. The increase in exports of services was led by travel. The increase in PCE primarily reflected an increase in services, led by health care, financial services and insurance, and recreation. The increase in nonresidential fixed investment primarily reflected an increase in intellectual property products that was partly offset by a decrease in structures.
The decrease in federal government spending primarily reflected a decrease in defense spending on intermediate goods and services. The decrease in state and local government spending reflected a decrease in gross investment (led by new educational structures). The increase in imports primarily reflected an increase in goods (led by nonfood and nonautomotive consumer goods, as well as capital goods).
Real GDP accelerated in the fourth quarter, increasing 6.9 percent after increasing 2.3 percent in the third quarter. The acceleration in real GDP primarily reflected an acceleration in private inventory investment, upturns in exports and in residential fixed investment, and an acceleration in consumer spending that were partly offset by a downturn in state and local government spending. Imports accelerated.
Current‑dollar GDP increased 14.5 percent at an annual rate, or $800.5 billion, in the fourth quarter to a level of $24.00 trillion. In the third quarter, GDP increased 8.4 percent, or $461.3 billion (table 1 and table 3). More information on the source data that underlie the estimates is available in the "Key Source Data and Assumptions" file on BEA's website.
The price index for gross domestic purchases increased 7.0 percent in the fourth quarter, compared with an increase of 5.6 percent in the third quarter (table 4). The PCE price index increased 6.4 percent, compared with an increase of 5.3 percent. Excluding food and energy prices, the PCE price index increased 5.0 percent, compared with an increase of 4.6 percent.
Gross Domestic Income and Corporate Profits
Real gross domestic income (GDI) increased 5.1 percent in the fourth quarter, compared with an increase of 6.4 percent in the third quarter. The average of real GDP and real GDI, a supplemental measure of U.S. economic activity that equally weights GDP and GDI, increased 6.0 percent in the fourth quarter, compared with an increase of 4.3 percent in the third quarter (table 1).
Profits from current production (corporate profits with inventory valuation and capital consumption adjustments) increased $20.4 billion in the fourth quarter, compared with an increase of $96.9 billion in the third quarter (table 10).
Profits of domestic financial corporations decreased $1.3 billion in the fourth quarter, in contrast to an increase of $14.2 billion in the third quarter. Profits of domestic nonfinancial corporations increased $5.0 billion, compared with an increase of $31.6 billion. Rest-of-the-world profits increased $16.8 billion, compared with an increase of $51.1 billion. In the fourth quarter, receipts increased $12.6 billion, and payments decreased $4.1 billion.
Updates to GDP
In the third estimate of the fourth quarter, real GDP increased 6.9 percent, 0.1 percentage point lower than in the second estimate. Downward revisions to PCE, exports, nonresidential fixed investment, and state and local government spending were partly offset by upward revisions to private inventory investment, residential fixed investment, and federal government spending. Imports were revised up. For more information, refer to the Technical Note. For information on updates to GDP, refer to the "Additional Information" section that follows.
| Advance Estimate | Second Estimate | Third Estimate | |
|---|---|---|---|
| (Percent change from preceding quarter) | |||
| Real GDP | 6.9 | 7.0 | 6.9 |
| Current-dollar GDP | 14.3 | 14.6 | 14.5 |
| Real GDI | … | … | 5.1 |
| Average of Real GDP and Real GDI | … | … | 6.0 |
| Gross domestic purchases price index | 6.9 | 7.0 | 7.0 |
| PCE price index | 6.5 | 6.3 | 6.4 |
| PCE price index excluding food and energy | 4.9 | 5.0 | 5.0 |
Real GDP by Industry
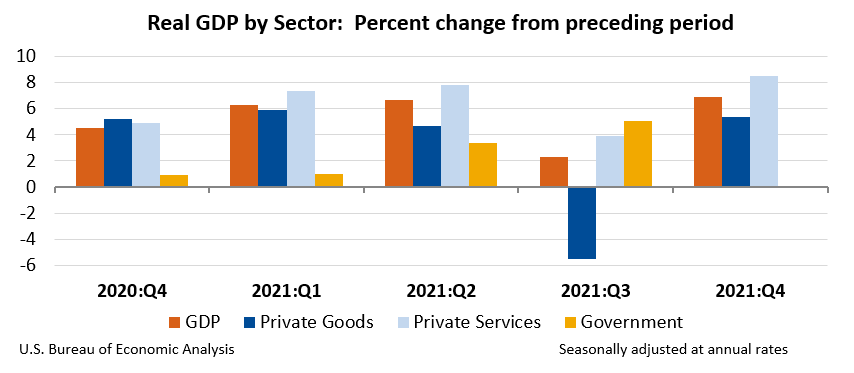
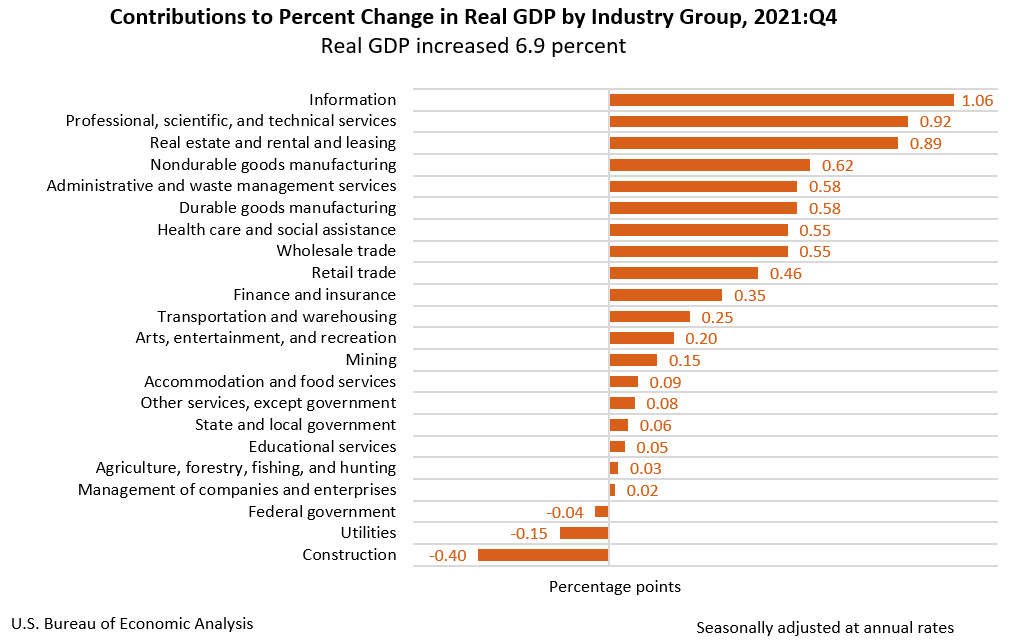
Today's release includes estimates of GDP by industry, or value added—a measure of an industry's contribution to GDP. In the fourth quarter, private goods-producing industries increased 5.4 percent, private services-producing industries increased 8.5 percent, and government increased 0.1 percent (table 12). Overall, 19 of 22 industry groups contributed to the fourth-quarter increase in real GDP (table 13).
Within private goods-producing industries, the increase primarily reflected increases in nondurable goods (led by chemical products as well as food and beverage and tobacco products) and durable goods (led by motor vehicles, bodies and trailers, and parts) that were partly offset by a decrease in construction.
Within private services-producing industries, the increase primarily reflected increases in information; professional, scientific, and technical services; real estate and rental and leasing (led by real estate); administrative and waste management services; health care and social assistance (led by ambulatory health care services); and wholesale trade. Partly offsetting these increases was a decrease in utilities.
The increase in the government sector reflected an increase in state and local government that was partly offset by a decrease in federal government.
Gross Output by Industry
Real gross output—principally a measure of an industry's sales or receipts, which includes sales to final users in the economy (GDP) and sales to other industries (intermediate inputs)—increased 3.8 percent in the fourth quarter (table 16). An increase of 4.9 percent for private services-producing industries and an increase of 2.6 percent for private goods-producing industries were partly offset by a decrease of 0.8 percent for government. Overall, 15 of 22 industry groups contributed to the increase in real gross output.
GDP for 2021
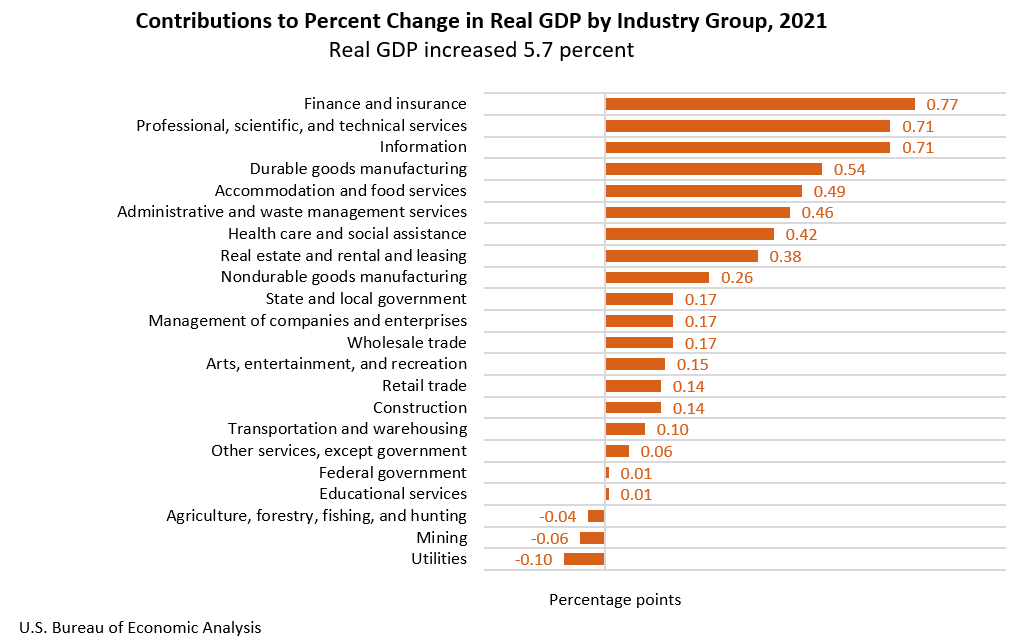
Real GDP increased 5.7 percent, unrevised from the second estimate, in 2021 (from the 2020 annual level to the 2021 annual level), in contrast to a decrease of 3.4 percent in 2020. The increase in real GDP for 2021 primarily reflected increases in PCE, nonresidential fixed investment, exports, residential fixed investment, and private inventory investment. Imports increased (table 2).
The increase in PCE reflected increases in both goods and services. Within goods, the leading contributors were "other" nondurable goods (including games and toys as well as pharmaceuticals), clothing and footwear, and recreational goods and vehicles. Within services, the leading contributors were food services and accommodations as well as health care. The increase in nonresidential fixed investment reflected increases in equipment (led by information processing equipment) and in intellectual property products (led by software as well as research and development) that were partly offset by a decrease in structures (widespread across most categories). The increase in exports reflected an increase in goods (mainly nonautomotive capital goods) that was partly offset by a decrease in services (led by travel as well as royalties and license fees). The increase in residential fixed investment mainly reflected an increase in new single-family structures. The increase in private inventory investment primarily reflected an increase in wholesale trade (mainly in durable goods industries).
Current-dollar GDP increased 10.1 percent, or $2.10 trillion, in 2021 to a level of $23.00 trillion, unrevised from the second estimate. In 2020, current-dollar GDP decreased 2.2 percent, or $478.9 billion (tables 1 and 3).
The price index for gross domestic purchases increased 3.9 percent, unrevised from the prior estimate, in 2021, compared with an increase of 1.2 percent in 2020 (table 4). Similarly, the PCE price index increased 3.9 percent, unrevised from the prior estimate, compared with an increase of 1.2 percent. Excluding food and energy prices, the PCE price index increased 3.3 percent, also unrevised from the prior estimate, compared with an increase of 1.4 percent.
Measured from the fourth quarter of 2020 to the fourth quarter of 2021, real GDP increased 5.5 percent (revised down 0.1 percentage point from the second estimate) during the period (table 6), in contrast to a decrease of 2.3 percent from the fourth quarter of 2019 to the fourth quarter of 2020.
The price index for gross domestic purchases, as measured from the fourth quarter of 2020 to the fourth quarter of 2021, increased 5.6 percent (unrevised from the second estimate), compared with an increase of 1.4 percent from the fourth quarter of 2019 to the fourth quarter of 2020. The PCE price index increased 5.5 percent, also unrevised from the prior estimate, compared with an increase of 1.2 percent. Excluding food and energy, the PCE price index increased 4.6 percent, unrevised from the prior estimate, compared with an increase of 1.4 percent.
Gross Domestic Income and Corporate Profits for 2021
Real GDI increased 7.2 percent in 2021, in contrast to a decrease of 2.9 percent in 2020 (table 1). The average of real GDP and real GDI increased 6.4 percent in 2021, in contrast to a decrease of 3.2 percent in 2020.
In 2021, profits from current production increased $562.0 billion, in contrast to a decrease of $124.0 billion in 2020. Profits of domestic financial corporations increased $64.3 billion, in contrast to a decrease of $39.9 billion (table 10). Profits of domestic nonfinancial corporations increased $461.0 billion, in contrast to a decrease of $25.5 billion. Rest-of-the-world profits increased $36.7 billion, in contrast to a decrease of $58.7 billion.
Real GDP by Industry for 2021
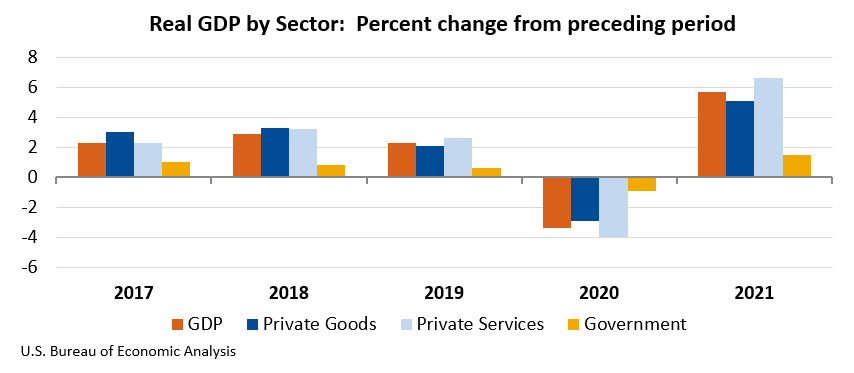
In 2021, private services-producing industries led the increase in GDP, increasing 6.6 percent. Private goods-producing industries increased 5.1 percent and the government sector increased 1.5 percent (table 12). Overall, 19 of 22 industry groups contributed to the increase (table 13).
Within private goods-producing industries, the leading contributor to the increase was durable goods manufacturing (led by motor vehicles, bodies and trailers, and parts as well as computer and electronic products).
Increases within the private services-producing industries were widespread; the leading contributors to the increase were finance and insurance (led by Federal Reserve banks, credit intermediation, and related activities); professional, scientific, and technical services; information (led by data processing, internet publishing, and other information services); accommodation and food services (led by food services and drinking places); and administrative and waste management services.
The increase in government reflected increases in both state and local government and federal government.
Real gross output in 2021 increased 6.4 percent. Private goods-producing industries increased 1.5 percent, private services-producing industries increased 9.1 percent, and government increased 1.4 percent (table 16). Overall, 18 of 22 industry groups contributed to the increase in real gross output.
Next release, April 28, 2022, at 8:30 A.M. EDT
Gross Domestic Product, First Quarter 2022 (Advance Estimate)