
News Release
Gross Domestic Product for the Commonwealth of the Northern Mariana Islands, 2020
Gross Domestic Product by Industry and Compensation by Industry, 2019
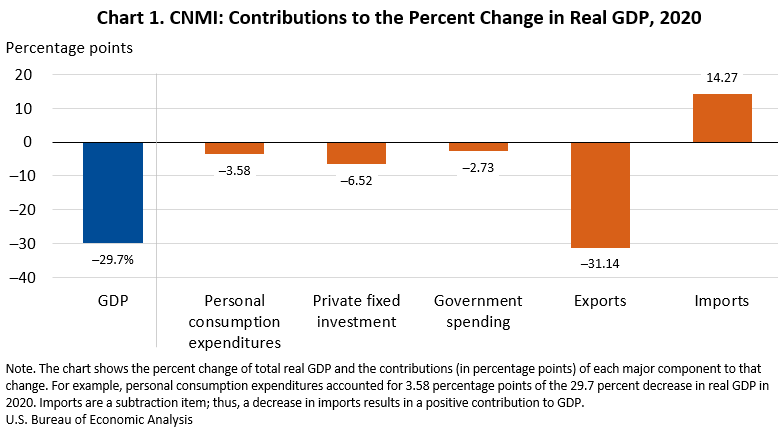
Real gross domestic product (GDP) for the Commonwealth of the Northern Mariana Islands (CNMI) decreased 29.7 percent in 2020 after decreasing 11.3 percent in 2019 (table 1.3), according to statistics released today by the U.S. Bureau of Economic Analysis (BEA). These statistics were developed under the Statistical Improvement Program funded by the Office of Insular Affairs (OIA) of the U.S. Department of the Interior.
GDP for 2020
The decrease in real GDP reflected decreases in exports of goods and services, private fixed investment, personal consumption expenditures, and government spending (table 1.4). Imports, a subtraction item in the calculation of GDP, also decreased.
The CNMI economy was substantially affected by the COVID–19 pandemic due to its effects on spending by consumers, visitors, businesses, and governments. The U.S. government passed several laws to support and sustain businesses and individuals through the pandemic. Expenditures funded by the various federal grants and transfer payments are reflected in the GDP estimates. However, the full effects of the pandemic cannot be quantified in BEA’s statistics for the CNMI, because the impacts are generally embedded in source data and cannot be separately identified.
Exports of goods and services decreased 74.4 percent (table 1.3). The decrease in exports was largely accounted for by exports of services, which consists primarily of visitor spending, including on casino gambling. Statistics published by the CNMI government showed that the number of visitor arrivals to the CNMI decreased 81.7 percent, reflecting effects of the COVID–19 pandemic. According to publicly available financial statements, revenues from casino gambling decreased over 95 percent.
Private fixed investment decreased 42.7 percent (table 1.3), reflecting a decline in spending on structures and equipment. Private sector construction activity, including the development of a casino resort on Saipan, decreased substantially in 2020.
Personal consumption expenditures decreased 6.2 percent (table 1.3), reflecting declines in spending on both goods and services. Businesses throughout the CNMI operated at a reduced capacity due to the COVID–19 pandemic.
Government spending decreased 6.0 percent (table 1.3), reflecting a decline in federal government spending. Federal government spending decreased 43.0 percent (table 1.3) after being elevated in 2019 to support recovery activities following Typhoon Yutu.
GDP by industry and compensation by industry for 2019
In 2019, real GDP decreased 11.3 percent. The newly available GDP by industry data, which are released on a 1-year lag, reveal that the private sector was the primary source of decline in real GDP in 2019 (table 2.5).
The private sector decreased 12.4 percent (table 2.4), reflecting a decline in accommodations, food services, and amusements. According to publicly available financial statements, revenues from casino gambling dropped over 80 percent in 2019. Additionally, data from the CNMI government show that visitor arrivals declined in 2019.
The government sector decreased 7.2 percent (table 2.4), reflecting a decline in territorial government due primarily to higher operating losses of government utilities in the aftermath of Typhoon Yutu.
Total compensation decreased from $721 million in 2018 to $700 million in 2019 (table 2.6). The $21 million decrease reflected a decline in private-sector compensation. The largest contributor to the decline was accommodations, food services, and amusements.
Estimates for 2018–2019 that were released on April 6, 2021, have been revised to incorporate updates to source data, including the following:
- Tabulations of business revenues data provided by the CNMI Department of Finance,
- Data for revenue tonnage of exports from the CNMI Central Statistics Division,
- Financial statements for the CNMI government and its independent agencies, and
- Federal government contract obligations data from the U.S. General Services Administration Federal Procurement Data System.
The revised estimates exhibit a pattern of inflation-adjusted GDP growth similar to the previously published estimates (table 1.7).
Due to lags in the availability of data for various components of GDP, the statistics presented today for 2020 are preliminary estimates. For example, as of mid-January 2023, the CNMI government’s fiscal year 2020 audited financial statements were unavailable. BEA used draft versions of these financial statements to prepare estimates of government spending. As additional source data become available, BEA will incorporate the information and will release updated estimates once a year.
For more information on the data sources underlying these estimates, see Summary of Methodologies: Gross Domestic Product for American Samoa, the Commonwealth of the Northern Mariana Islands, Guam, and the U.S. Virgin Islands.
Next release: fall 2023
Gross Domestic Product for the Commonwealth of the Northern Mariana Islands, 2021
CNMI GDP by Industry and Compensation by Industry, 2020