
News Release
U.S. International Transactions, 3rd Quarter 2023
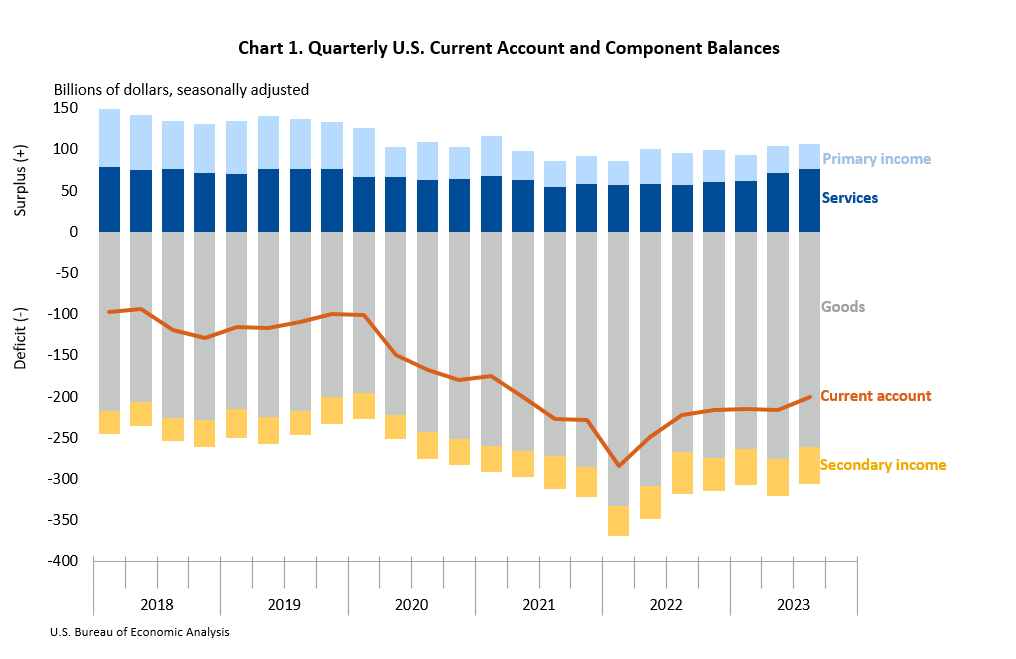
Current-Account Balance
The U.S. current-account deficit, which reflects the combined balances on trade in goods and services and income flows between U.S. residents and residents of other countries, narrowed by $16.5 billion, or 7.6 percent, to $200.3 billion in the third quarter of 2023, according to statistics released today by the U.S. Bureau of Economic Analysis. The revised second-quarter deficit was $216.8 billion
The third-quarter deficit was 2.9 percent of current-dollar gross domestic product, down from 3.2 percent in the second quarter.
The $16.5 billion narrowing of the current-account deficit in the third quarter mostly reflected a reduced deficit on goods.
Current-Account Transactions (tables 1–5)
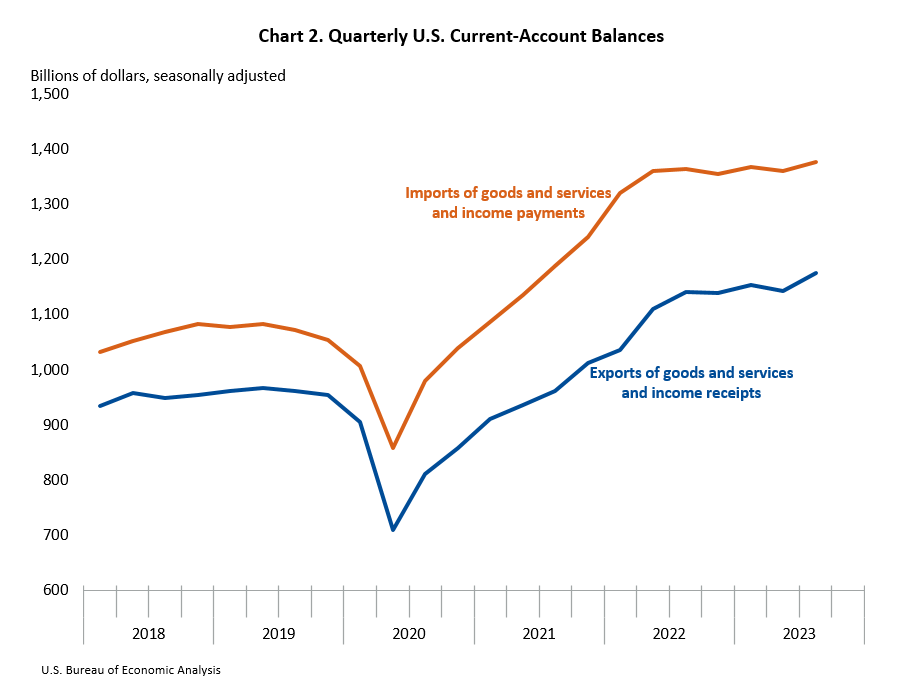
Exports of goods and services to, and income received from, foreign residents increased $33.0 billion to $1.18 trillion in the third quarter. Imports of goods and services from, and income paid to, foreign residents increased $16.5 billion to $1.38 trillion.1
Trade in goods (table 2)
Exports of goods increased $19.1 billion to $516.4 billion, and imports of goods increased $4.6 billion to $777.4 billion. The increases in both exports and imports reflected increases in most major categories. The increase in exports was led by industrial supplies and materials, primarily petroleum and products. The increase in imports was led by automotive vehicles, parts, and engines, primarily passenger cars and other parts and accessories. Partly offsetting this increase was a decrease in imports of nonmonetary gold.
Trade in services (table 3)
Exports of services increased $2.7 billion to $252.2 billion, reflecting an increase in travel, mainly other personal travel, that was partly offset by a decrease in technical, trade-related, and other business services, a subcategory of the broader other business services category as presented in table 3. Imports of services decreased $1.9 billion to $176.0 billion, reflecting a decrease in transport, mostly sea freight transport.
Primary income (table 4)
Receipts of primary income increased $11.8 billion to $362.1 billion, and payments of primary income increased $14.0 billion to $332.1 billion. The increases in both receipts and payments reflected increases in most major categories. The increase in receipts was led by direct investment income, mainly earnings. The increase in payments was led by other investment income, mostly interest on loans and deposits.
Secondary income (table 5)
Receipts of secondary income decreased $0.7 billion to $45.1 billion, reflecting a decrease in general government transfers, mostly fines and penalties. Payments of secondary income decreased $0.3 billion to $90.7 billion, reflecting a decrease in general government transfers, mainly international cooperation, that was mostly offset by an increase in private transfers, led by fines and penalties.
Capital-Account Transactions (table 1)
Capital-transfer receipts increased $10 million to $18 million. Capital-transfer payments decreased $0.6 billion to $2.1 billion, reflecting a decrease in infrastructure grants.
Financial-Account Transactions (tables 1, 6, 7, and 8)
Net financial-account transactions were −$138.6 billion in the third quarter, reflecting net U.S. borrowing from foreign residents.
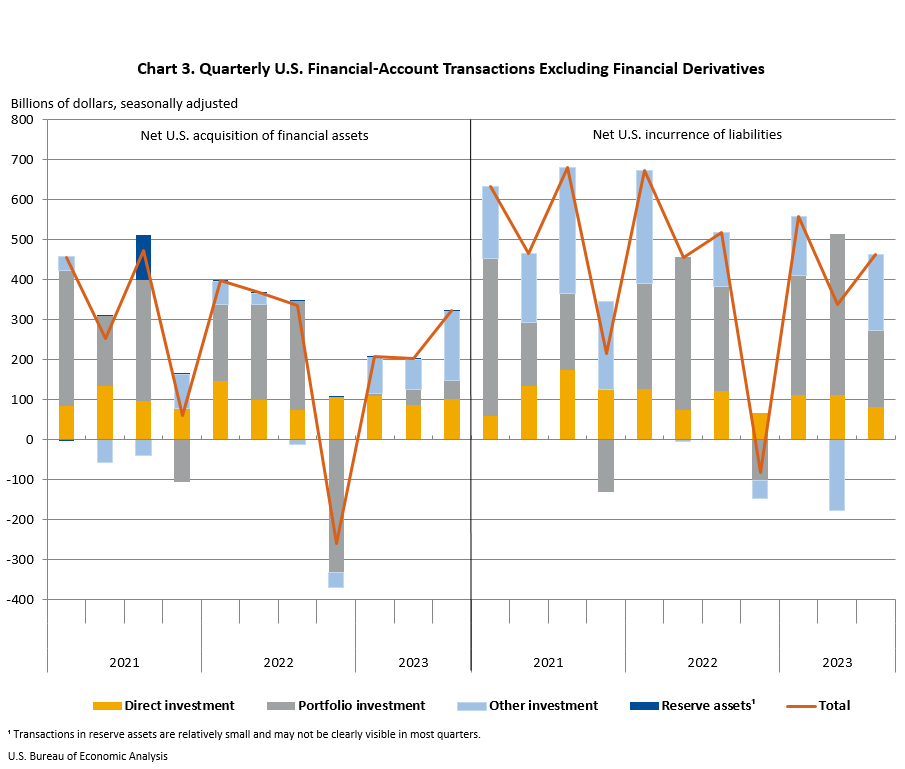
Financial assets (tables 1, 6, 7, and 8)
Third-quarter transactions increased U.S. residents’ foreign financial assets by $323.4 billion. Transactions increased other investment assets, mostly loans, by $174.2 billion; direct investment assets, mostly equity, by $101.6 billion; portfolio investment assets, mostly equity, by $47.2 billion; and reserve assets by $0.4 billion.
Liabilities (tables 1, 6, 7, and 8)
Third-quarter transactions increased U.S. liabilities to foreign residents by $463.0 billion. Transactions increased portfolio investment liabilities, mostly debt securities, by $193.1 billion; other investment liabilities, mostly loans, by $189.1 billion; and direct investment liabilities, mostly equity, by $80.8 billion.
Financial derivatives (table 1)
Net transactions in financial derivatives were $1.1 billion in the third quarter, reflecting net U.S. lending to foreign residents.
|
Table A. Updates to Second-Quarter 2023 International Transactions Accounts Balances [Billions of dollars, seasonally adjusted] |
||
| Preliminary estimates | Revised estimates | |
|---|---|---|
| Current-account balance | –212.1 | −216.8 |
| Goods balance | −275.2 | −275.5 |
| Services balance | 71.7 | 71.7 |
| Primary income balance | 35.0 | 32.2 |
| Secondary income balance | −43.6 | −45.3 |
| Net financial-account transactions | −109.0 | −140.4 |
| U.S. Bureau of Economic Analysis | ||
|
U.S. International Transactions Release Dates in 2024 |
||
| 4th Quarter and Year 2023 | March 21 | |
| 1st Quarter 2024 and Annual Update | June 20 | |
| 2nd Quarter 2024 | September 19 | |
| 3rd Quarter 2024 | December 18 | |
Next release: March 21, 2024, at 8:30 a.m. EDT
U.S. International Transactions, 4th Quarter and Year 2023
1 U.S. international transactions are presented in current dollars in accordance with international statistical presentation guidelines. For a comparison of current-dollar, or nominal, and inflation-adjusted, or real, measures of international transactions, see “SECTION 4 – FOREIGN TRANSACTIONS” of the National Income and Product Accounts.