
News Release
U.S. International Transactions, 4th Quarter and Year 2023
Current-Account Deficit Narrowed by 0.8 Percent in Fourth Quarter
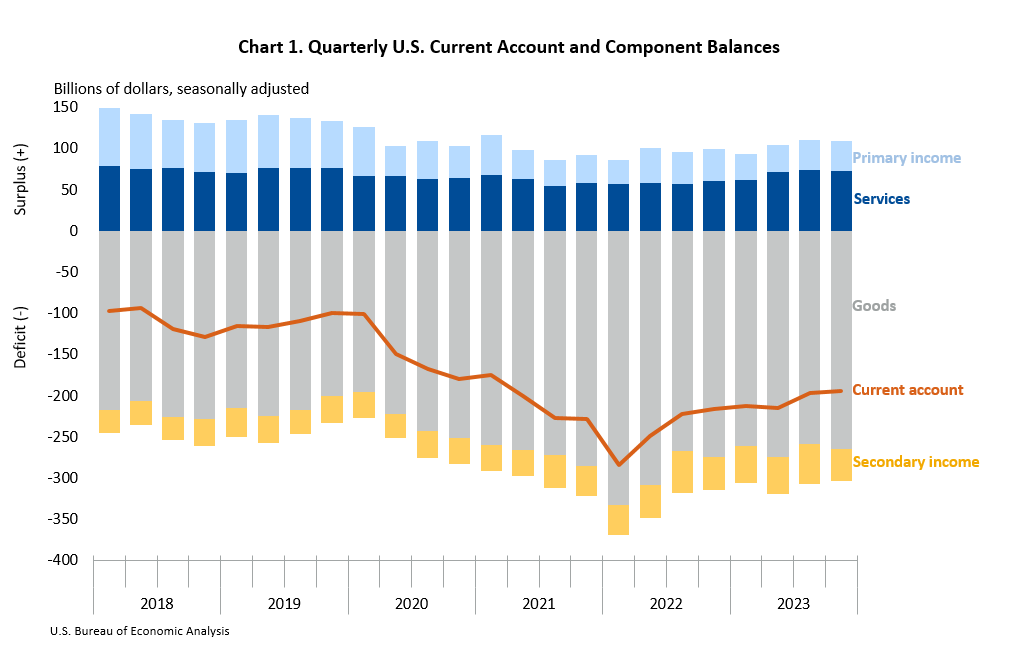
Current-Account Balance, Fourth Quarter (chart 1)
The U.S. current-account deficit, which reflects the combined balances on trade in goods and services and income flows between U.S. residents and residents of other countries, narrowed by $1.6 billion, or 0.8 percent, to $194.8 billion in the fourth quarter of 2023, according to statistics released today by the U.S. Bureau of Economic Analysis (BEA). The revised third-quarter deficit was $196.4 billion.
The fourth-quarter deficit was 2.8 percent of current-dollar gross domestic product (GDP), down less than 0.1 percent from the third quarter.
The $1.6 billion narrowing of the current-account deficit in the fourth quarter primarily reflected a reduced deficit on secondary income that was mostly offset by an expanded deficit on goods.
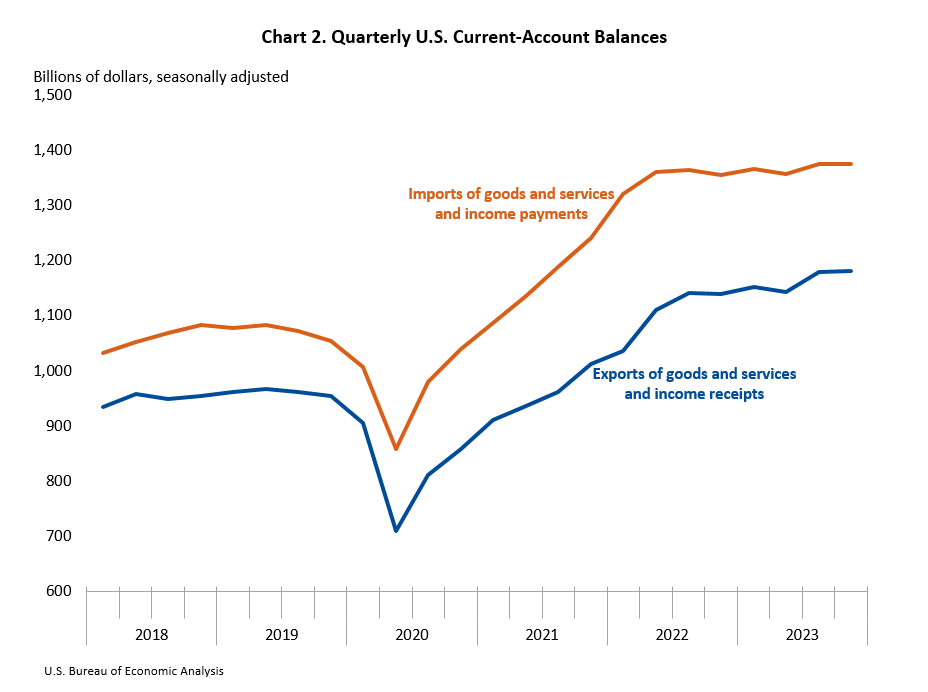
Current-Account Transactions (tables 1–5 and chart 2)
Exports of goods and services to, and income received from, foreign residents increased $1.9 billion to $1.18 trillion in the fourth quarter. Imports of goods and services from, and income paid to, foreign residents increased $0.3 billion to $1.37 trillion.1
Trade in goods (table 2)
Exports of goods decreased $1.4 billion to $514.4 billion, reflecting decreases in automotive vehicles, parts, and engines, led by trucks, buses, and special purpose vehicles; in consumer goods, led by medicinal, dental, and pharmaceutical products; and in nonmonetary gold. The decrease in exports of goods was partly offset by an increase in industrial supplies and materials, mostly petroleum and products. Imports of goods increased $4.4 billion to $779.4 billion, reflecting increases in capital goods, mainly computers and computer accessories, peripherals, and parts, and in industrial supplies and materials, mainly petroleum and products. The increase in imports was partly offset by a decrease in consumer goods, mostly toys and sporting goods.
Trade in services (table 3)
Exports of services increased $2.0 billion to $254.4 billion, reflecting increases in travel, mostly other personal travel, and in transport, mainly air passenger transport. Imports of services increased $2.5 billion to $181.5 billion, reflecting an increase in travel, mostly other personal travel.
Primary income (table 4)
Receipts of primary income decreased $3.7 billion to $361.6 billion, and payments of primary income decreased $2.9 billion to $325.5 billion. The decreases in both receipts and payments reflected a decrease in direct investment income, primarily earnings, that was partly offset by an increase in other investment income, primarily interest on loans and deposits.
Secondary income (table 5)
Receipts of secondary income increased $5.0 billion to $49.6 billion, reflecting an increase in general government transfers, mostly fines and penalties. Payments of secondary income decreased $3.6 billion to $88.5 billion, reflecting a decrease in general government transfers, mainly international cooperation.
Capital-Account Transactions (table 1)
Capital-transfer receipts decreased $3 million to $15 million. Capital-transfer payments increased $0.3 billion to $2.5 billion, reflecting an increase in infrastructure grants.
Financial-Account Transactions (tables 1, 6, 7, and 8 and chart 3)
Net financial-account transactions were −$221.1 billion in the fourth quarter, reflecting net U.S. borrowing from foreign residents.
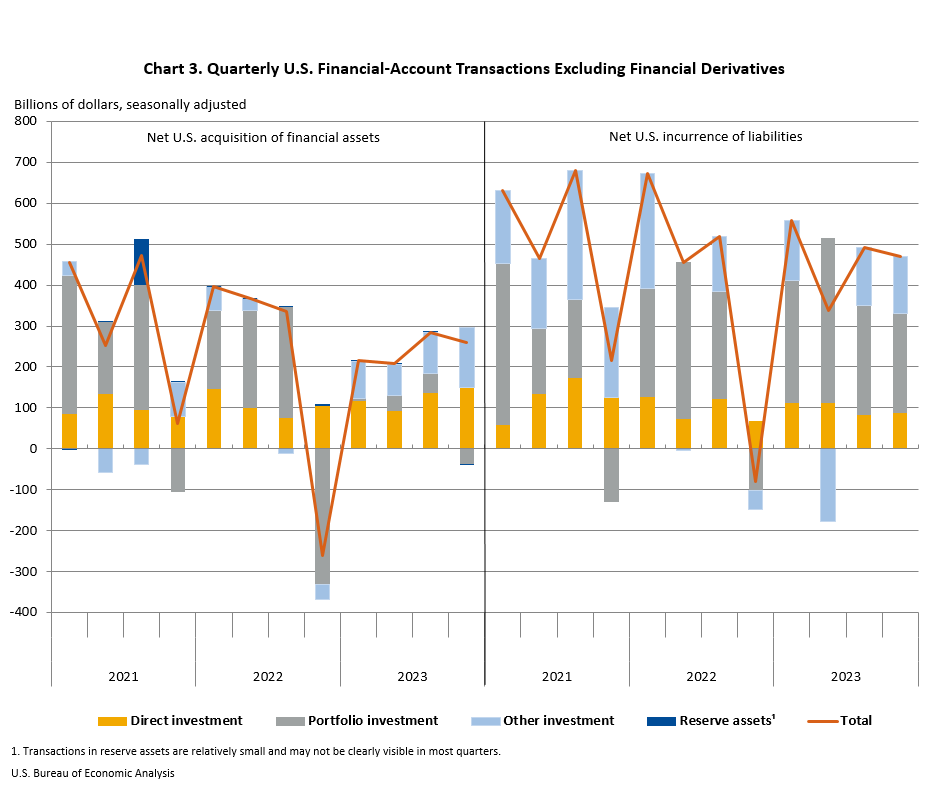
Financial assets (tables 1, 6, 7, and 8)
Fourth-quarter transactions increased U.S. residents’ foreign financial assets by $259.0 billion. Transactions increased direct investment assets, mostly equity, by $149.8 billion and other investment assets, mostly loans and deposits, by $147.6 billion. Transactions decreased portfolio investment assets, mostly equity, by $37.0 billion and reserve assets by $1.4 billion.
Liabilities (tables 1, 6, 7, and 8)
Fourth-quarter transactions increased U.S. liabilities to foreign residents by $469.8 billion. Transactions increased portfolio investment liabilities, mostly long-term debt securities, by $242.6 billion; other investment liabilities, primarily deposits, by $138.9 billion; and direct investment liabilities, mostly equity, by $88.4 billion.
Financial derivatives (table 1)
Net transactions in financial derivatives were –$10.2 billion in the fourth quarter, reflecting net U.S. borrowing from foreign residents.
|
Table A. Updates to Third-Quarter 2023 International Transactions Accounts Balances [Billions of dollars, seasonally adjusted] |
||
| Preliminary estimates | Revised estimates | |
|---|---|---|
| Current-account balance | –200.3 | −196.4 |
| Goods balance | −261.0 | −259.2 |
| Services balance | 76.2 | 73.3 |
| Primary income balance | 30.0 | 36.9 |
| Secondary income balance | −45.6 | −47.5 |
| Net financial-account transactions | −138.6 | −207.0 |
| U.S. Bureau of Economic Analysis | ||
In addition to revisions to source data for the third quarter of 2023, seasonally adjusted statistics for the first, second, and third quarters of 2023 were revised to force the sum of seasonally adjusted quarters to equal the annual totals. This forcing procedure was also applied to the fourth quarter of 2023.
Current-Account Balance, Year 2023
The U.S. current-account deficit narrowed by $152.8 billion, or 15.7 percent, to $818.8 billion in 2023. The deficit was 3.0 percent of current-dollar GDP, down from 3.8 percent in 2022. The $152.8 billion narrowing of the current-account deficit in 2023 mostly reflected a reduced deficit on goods.
Current-Account Transactions (tables 1–5)
Exports of goods and services to, and income received from, foreign residents increased $228.0 billion to $4.65 trillion in 2023. Imports of goods and services from, and income paid to, foreign residents increased $75.2 billion to $5.47 trillion.
Trade in goods (table 2)
Exports of goods decreased $37.2 billion to $2.05 trillion, and imports of goods decreased $160.6 billion to $3.11 trillion. The decreases in both exports and imports primarily reflected a decrease in industrial supplies and materials, led by petroleum and products.
Trade in services (table 3)
Exports of services increased $70.6 billion to $999.1 billion, reflecting an increase in travel, mostly other personal travel. Imports of services increased $22.6 billion to $719.3 billion, reflecting an increase in travel, mostly other personal travel, that was partly offset by a decrease in transport, mainly sea freight transport.
Primary income (table 4)
Receipts of primary income increased $198.1 billion to $1.42 trillion, and payments of primary income increased $210.0 billion to $1.28 trillion. The increases in both receipts and payments primarily reflected an increase in other investment income, mainly interest on loans and deposits.
Secondary income (table 5)
Receipts of secondary income decreased $3.4 billion to $184.9 billion, reflecting a decrease in general government transfers, mainly fines and penalties. Payments of secondary income increased $3.3 billion to $360.6 billion, reflecting an increase in private transfers, mainly personal transfers and insurance-related transfers.
Capital-Account Transactions (table 1)
Capital-transfer receipts decreased $8.3 billion to $85 million in 2023. Transactions in 2022 reflected receipts from foreign insurance companies for losses resulting from Hurricane Ian. Capital-transfer payments in 2023 increased $0.3 billion to $13.3 billion, reflecting an increase in infrastructure grants.
Financial-Account Transactions (tables 1, 6, 7, and 8)
Net financial-account transactions were −$906.3 billion in 2023, reflecting net U.S. borrowing from foreign residents.
Financial assets (tables 1, 6, 7, and 8)
Transactions in 2023 increased U.S. residents’ foreign financial assets by $966.6 billion. Transactions increased direct investment assets, mostly equity, by $494.3 billion; other investment assets, mostly loans, by $415.8 billion; portfolio investment assets, mainly long-term debt securities, by $56.5 billion; and reserve assets by $41 million.2
Liabilities (tables 1, 6, 7, and 8)
Transactions in 2023 increased U.S. liabilities to foreign residents by $1.86 trillion. Transactions increased portfolio investment liabilities, mostly long-term debt securities, by $1.21 trillion; direct investment liabilities, mostly equity, by $394.1 billion; and other investment liabilities, mostly deposits, by $250.5 billion.
Financial derivatives (table 1)
Net transactions in financial derivatives were –$15.6 billion in 2023, reflecting net U.S. borrowing from foreign residents.
Upcoming Update to the U.S. International Transactions Accounts
The annual update of the International Transactions Accounts will be released along with preliminary estimates for the first quarter of 2024 on June 20, 2024. A preview of the annual update will be available in the Survey of Current Business in April 2024.
Upcoming Release of New International Investment Position Statistics
With the release of the International Investment Position (IIP) Accounts on June 26, 2024, BEA will (1) expand “Table 1.3. Change in the Yearend U.S. Net International Investment Position,” which currently presents annual statistics, to include new quarterly statistics on price changes and exchange-rate changes for U.S. assets and liabilities beginning with the first quarter of 2023 and (2) rename this table “Table 1.3. Change in the U.S. Net International Investment Position.” To prepare users for this change, a prototype of the new IIP table 1.3 is available in BEA’s Interactive Data Application and Data Application Programming Interface; it will be updated on March 27, 2024, with the release of the IIP Accounts for the fourth quarter and year 2023. On June 26, 2024, the expanded table will be incorporated into the standard presentation of the IIP Accounts in the Interactive Data Application and the Data Application Programming Interface. More information will be available in the March 27 IIP news release and in the annual update preview article in the Survey in April 2024.
Next release: June 20, 2024, at 8:30 a.m. EDT
U.S. International Transactions, 1st Quarter 2024 and Annual Update
1 U.S. international transactions are presented in current dollars in accordance with international statistical presentation guidelines. For a comparison of current-dollar, or nominal, and inflation-adjusted, or real, measures of international transactions, see “SECTION 4 – FOREIGN TRANSACTIONS” of the National Income and Product Accounts.
2 Statistics for portfolio investment assets and liabilities beginning with the first quarter of 2023 include newly available source data from the Treasury International Capital System “Aggregate Holdings, Purchases and Sales, and Fair Value Changes of Long-Term Securities by U.S. and Foreign Residents” form, which BEA incorporated with the “U.S. International Transactions, 2nd Quarter 2023” news release. For more information, see the “Technical Note” that accompanied the release.