
News Release
U.S. International Transactions, 2nd Quarter 2023
Current-Account Deficit Narrowed by 1.1 Percent
Current-Account Balance
The U.S. current-account deficit, which reflects the combined balances on trade in goods and services and income flows between U.S. residents and residents of other countries, narrowed by $2.4 billion, or 1.1 percent, to $212.1 billion in the second quarter of 2023, according to statistics released today by the U.S. Bureau of Economic Analysis (BEA). The revised first-quarter deficit was $214.5 billion.
The second-quarter deficit was 3.2 percent of current-dollar gross domestic product, up less than 0.1 percent from the first quarter.
The $2.4 billion narrowing of the current-account deficit in the second quarter primarily reflected expanded surpluses on services and on primary income that were mostly offset by an expanded deficit on goods.

Current-Account Transactions (tables 1–5)
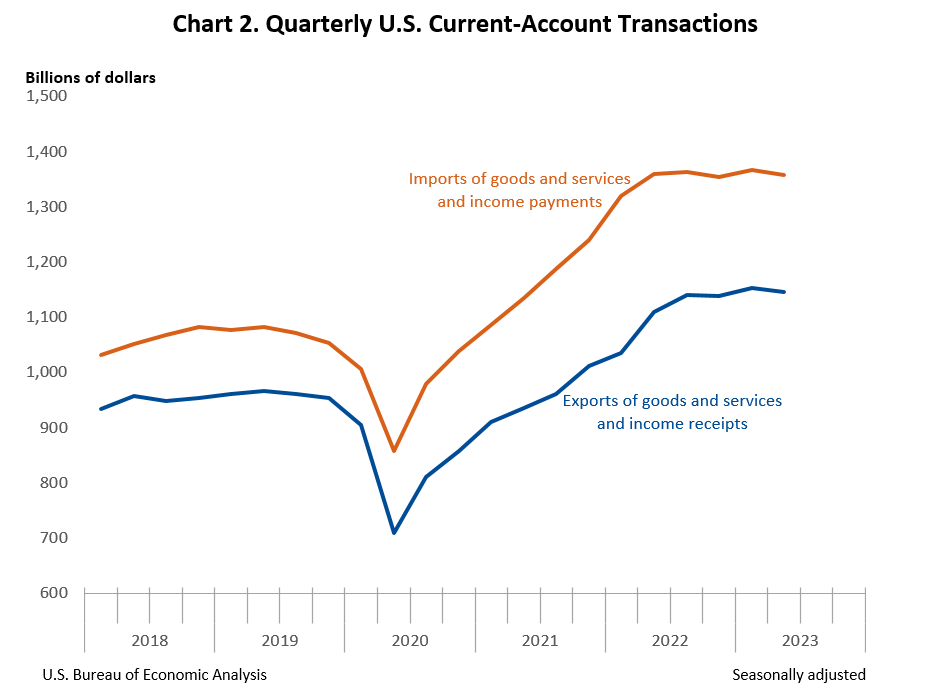
Exports of goods and services to, and income received from, foreign residents decreased $7.8 billion to $1.15 trillion in the second quarter. Imports of goods and services from, and income paid to, foreign residents decreased $10.2 billion to $1.36 trillion.1
Trade in goods (table 2)
Exports of goods decreased $29.0 billion to $497.6 billion, and imports of goods decreased $17.1 billion to $772.8 billion. The decreases in both exports and imports mostly reflected a decrease in industrial supplies and materials, primarily petroleum and products.
Trade in services (table 3)
Exports of services increased $4.7 billion to $247.3 billion, reflecting increases in travel, mainly other personal travel, and in other business services, mostly professional and management consulting services. Imports of services decreased $5.5 billion to $175.7 billion, reflecting decreases in transport, mostly sea freight transport, in other business services, mostly technical, trade-related, and other business services, and in travel, mainly other personal travel.
Primary income (table 4)
Receipts of primary income increased $15.5 billion to $354.5 billion, and payments of primary income increased $12.0 billion to $319.5 billion. The increases in both receipts and payments reflected increases in nearly all major components, led by other investment income. The increase in other investment income, primarily interest on loans and deposits, was mainly due to higher short-term interest rates amid tightening of U.S. and foreign monetary policy.
Secondary income (table 5)
Receipts of secondary income increased $1.0 billion to $45.9 billion, reflecting an increase in general government transfers, mostly fines and penalties. Payments of secondary income increased $0.4 billion to $89.5 billion, reflecting an increase in private transfers, mostly insurance-related transfers.
Capital-Account Transactions (table 1)
Capital-transfer receipts decreased $37 million to $7 million. Capital-transfer payments decreased $3.2 billion to $2.8 billion, reflecting a decrease in infrastructure grants.
Financial-Account Transactions (tables 1, 6, 7, and 8)
Net financial-account transactions were −$109.0 billion in the second quarter, reflecting net U.S. borrowing from foreign residents.
Financial assets (tables 1, 6, 7, and 8)
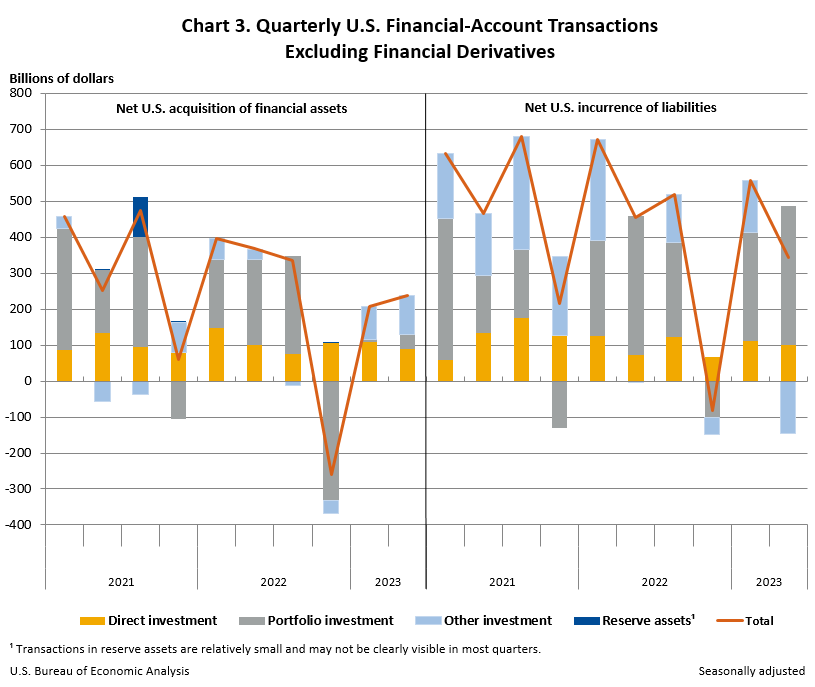
Second-quarter transactions increased U.S. residents’ foreign financial assets by $238.2 billion. Transactions increased other investment assets, mostly loans, by $109.2 billion; direct investment assets, mostly equity, by $88.4 billion; portfolio investment assets, mostly equity, by $40.3 billion; and reserve assets by $0.3 billion.
Liabilities (tables 1, 6, 7, and 8)
Second-quarter transactions increased U.S. liabilities to foreign residents by $342.5 billion. Transactions increased portfolio investment liabilities, mostly long-term debt securities, by $387.1 billion and direct investment liabilities, mostly equity, by $100.5 billion. Transactions decreased other investment liabilities, mostly loans, by $145.2 billion.
Financial derivatives (table 1)
Net transactions in financial derivatives were –$4.7 billion in the second quarter, reflecting net U.S. borrowing from foreign residents.
|
Table A. Updates to First-Quarter 2023 International Transactions Accounts Balances [Billions of dollars, seasonally adjusted] |
||
| Revised estimates | ||
|---|---|---|
| Current-account balance | –219.3 | −214.5 |
| Goods balance | −263.1 | −263.3 |
| Services balance | 62.1 | 61.5 |
| Primary income balance | 31.3 | 31.4 |
| Secondary income balance | −49.6 | −44.1 |
| Net financial-account transactions | −326.8 | −350.1 |
| U.S. Bureau of Economic Analysis | ||
Newly Available Source Data on Portfolio Investment
With this release of U.S. international transactions, BEA has incorporated newly available source data from the Treasury International Capital System “Aggregate Holdings, Purchases and Sales, and Fair Value Changes of Long-Term Securities by U.S. and Foreign Residents” form (TIC SLT) to more accurately measure transactions in equity and investment fund shares and in long-term debt securities, which are components of the portfolio investment category in the financial account. The new TIC SLT transactions data, beginning with the first quarter of 2023, have replaced BEA’s estimation method for these portfolio investment transactions statistics that were derived from positions data reported on the TIC SLT form. For more information on this method, which remains relevant for periods prior to 2023, see paragraph 17.15 of “U.S. International Economic Accounts: Concepts and Methods.” For more information on the new source data, see the accompanying “Technical Note.”
Next release: December 20, 2023, at 8:30 a.m. EST
U.S. International Transactions, 3rd Quarter 2023
1 U.S. international transactions are presented in current dollars in accordance with international statistical presentation guidelines. For a comparison of current-dollar, or nominal, and inflation-adjusted, or real, measures of international transactions, see “SECTION 4 – FOREIGN TRANSACTIONS” of the National Income and Product Accounts.