U.S. International Investment Position, 4th Quarter and Year 2024

End of 4th quarter 2024
-$26.23 trillion
End of 3rd quarter 2024
-$24.15 trillion
End of year 2024
-$26.23 trilion
End of year 2023
-$19.85 trilion

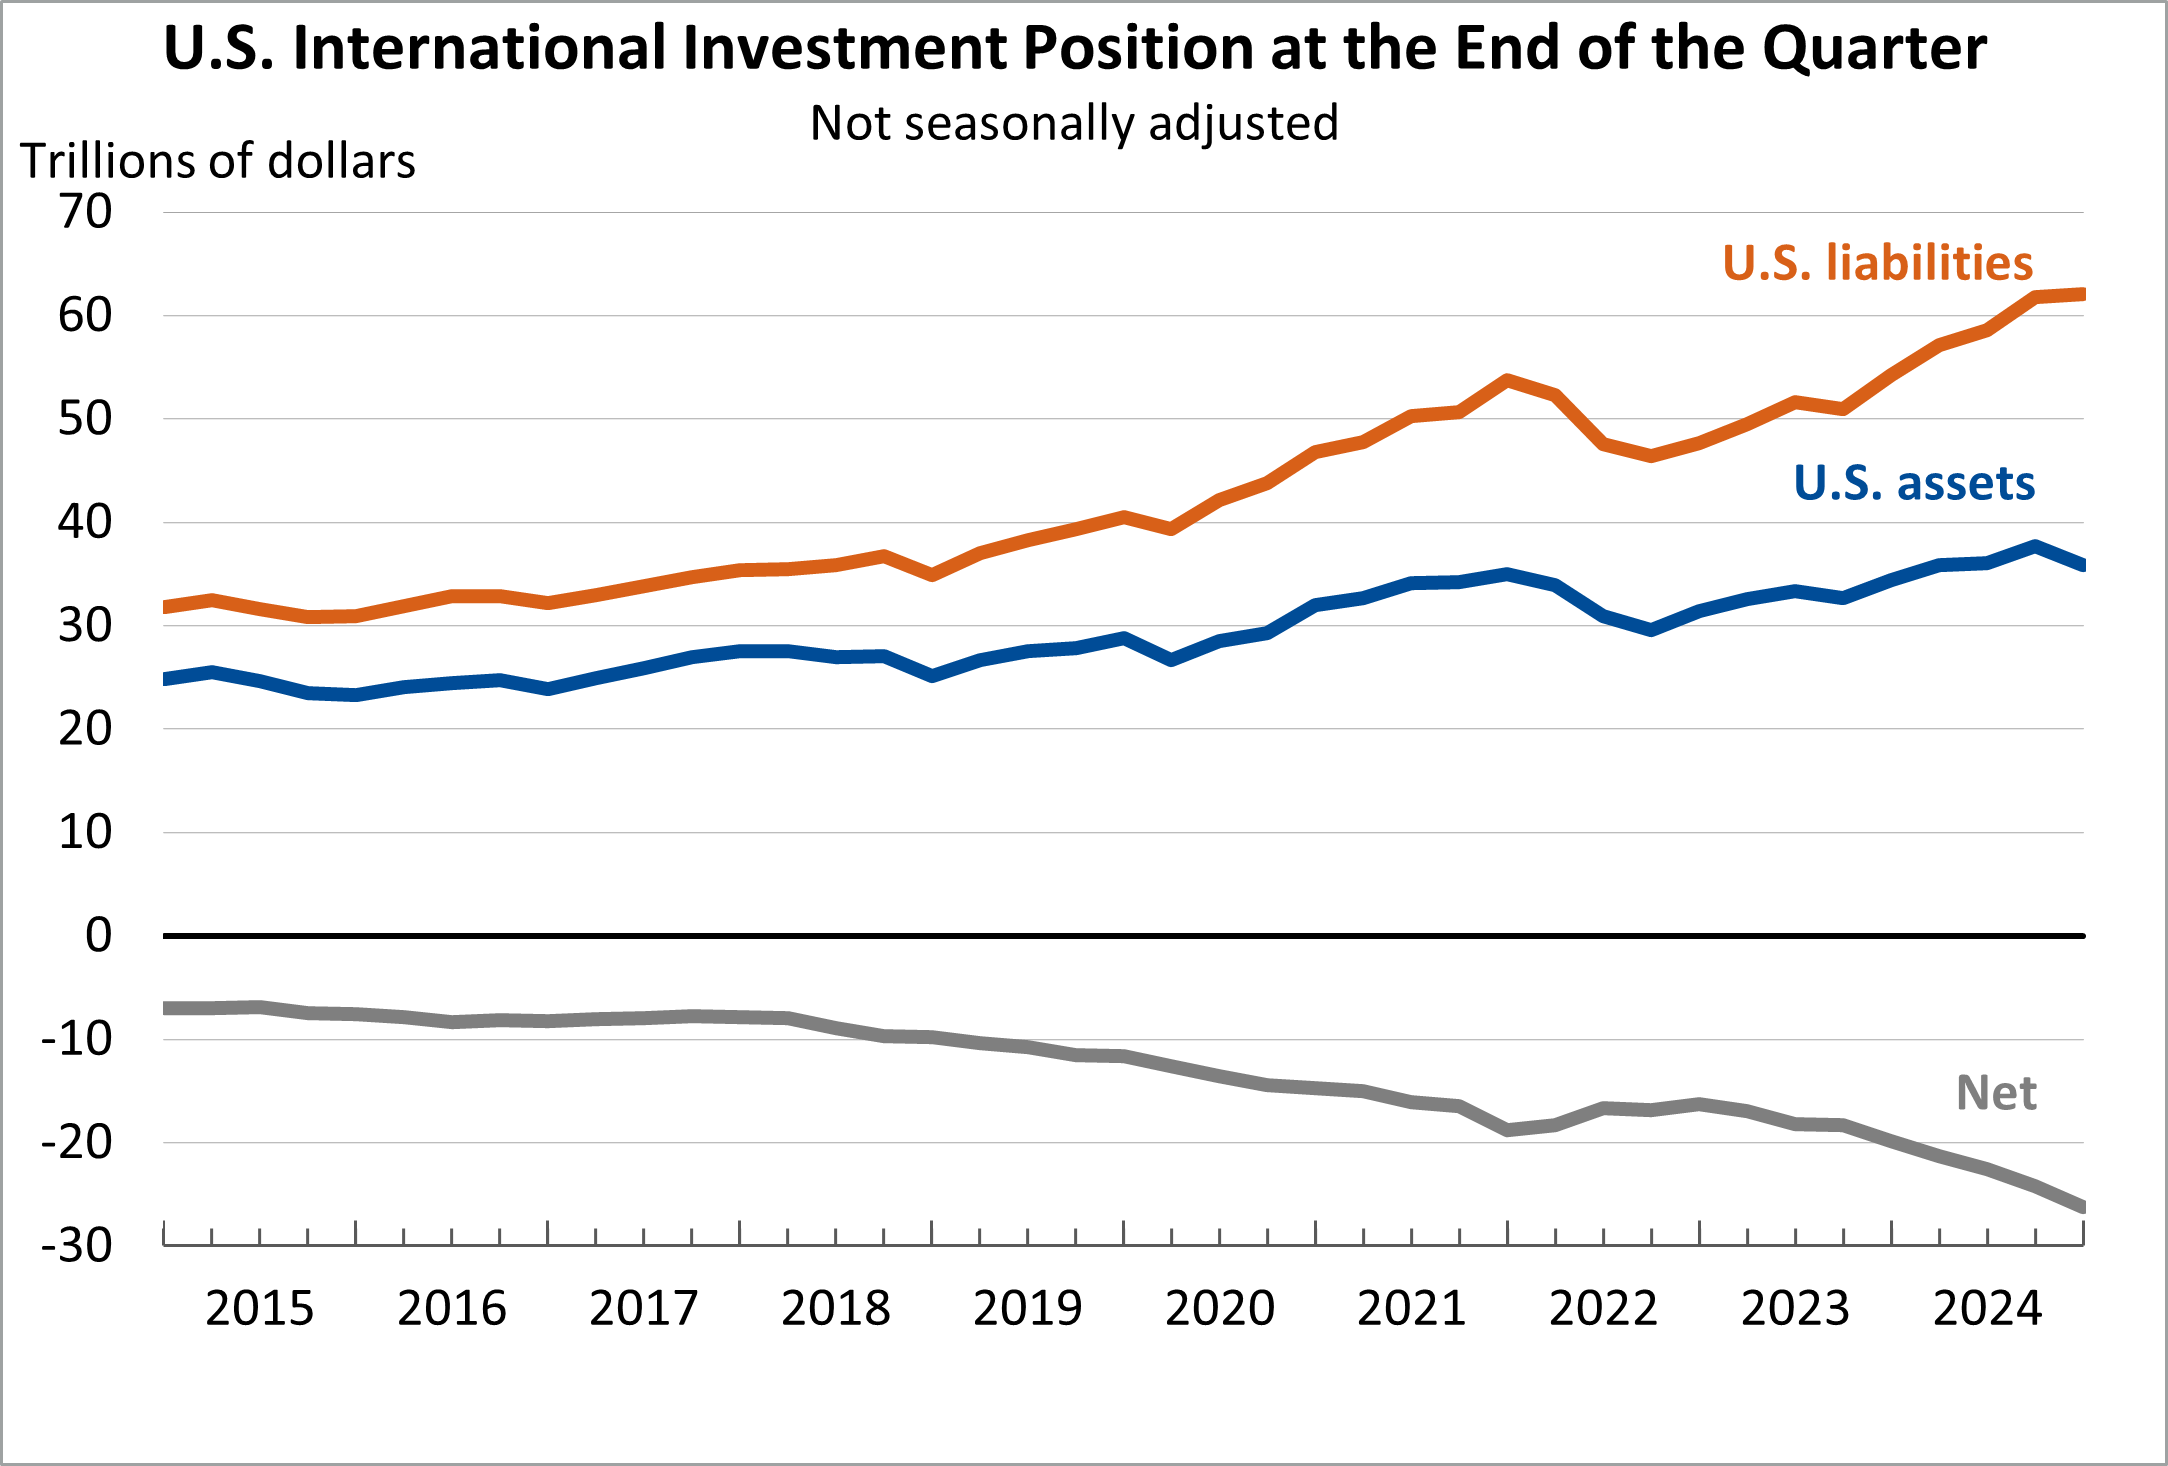
The U.S. net international investment position, the difference between U.S. residents’ foreign financial assets and liabilities, was -$26.23 trillion at the end of the fourth quarter of 2024, according to statistics released today by the U.S. Bureau of Economic Analysis. Assets totaled $35.89 trillion, and liabilities were $62.12 trillion. At the end of the third quarter, the net investment position was -$24.15 trillion (revised).

  • Current Release: March 26, 2025
  • Next Release: June 30, 2025

New Foreign Direct Investment in the United States, 2023

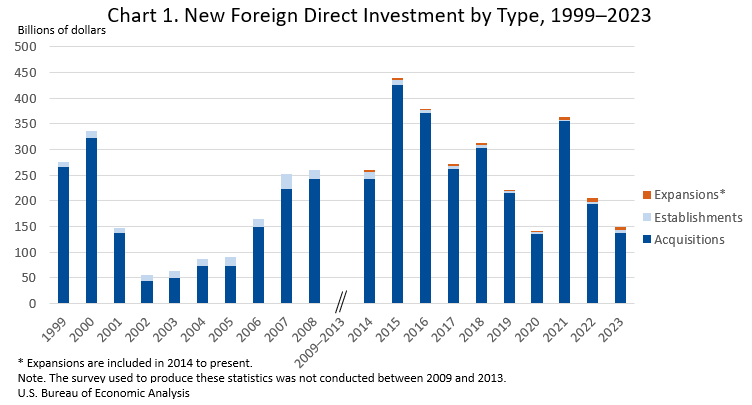
Expenditures by foreign direct investors to acquire, establish, or expand U.S. businesses totaled $148.8 billion in 2023 (chart 1), according to preliminary statistics released today by the U.S. Bureau of Economic Analysis. Expenditures decreased $57.4 billion, or 28 percent, from $206.2 billion (revised) in 2022 and were below the annual average of $265.6 billion for 2014–2022. As in previous years, acquisitions of existing U.S. businesses accounted for most of the expenditures.

  • Current release: July 12, 2024
  • Next release: July 2025

U.S. International Transactions, 4th Quarter and Year 2024

Q4 2024
-$303.9 B
Q3 2024
-$310.3 B

The U.S. current-account deficit narrowed by $6.3 billion, or 2.0 percent, to $303.9 billion in the fourth quarter of 2024, according to statistics released today by the U.S. Bureau of Economic Analysis. The revised third-quarter deficit was $310.3 billion. The fourth-quarter deficit was 4.1 percent of current-dollar gross domestic product, down from 4.2 percent in the third quarter.

  • Current Release: March 20, 2025
  • Next Release: June 24, 2025