
News Release
U.S. International Investment Position, First Quarter 2020, Year 2019, and Annual Update
First Quarter 2020
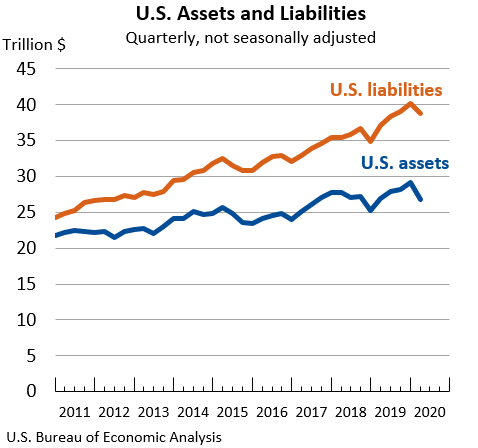
The U.S. net international investment position, the difference between U.S. residents’ foreign financial assets and liabilities, was –$12.06 trillion at the end of the first quarter of 2020, according to statistics released by the U.S. Bureau of Economic Analysis (BEA). Assets totaled $26.77 trillion and liabilities were $38.82 trillion.
At the end of the fourth quarter of 2019, the net investment position was –$11.05 trillion (Table 1).
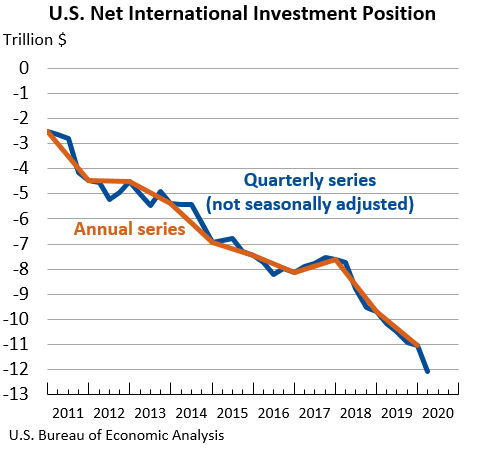
The –$1.01 trillion change in the net investment position from the fourth quarter of 2019 to the first quarter of 2020 came from net financial transactions of –$184.2 billion and net other changes in position, such as price and exchange rate changes, of –$822.8 billion (Table A).
Table A. Quarterly Change in the U.S. Net International Investment Position
Billions of dollars, not seasonally adjusted
| Position, 2019 Q4 |
Change in position in 2020 Q1 | Position, 2020 Q1 |
|||
| Total | Attributable to: | ||||
| Financial transactions |
Other changes in position 1 |
||||
| U.S. net international investment position | -11,050.5 | -1,007.0 | -184.2 | -822.8 | -12,057.5 |
| Net position excluding financial derivatives | -11,070.7 | -1,022.1 | -162.4 | -859.8 | -12,092.8 |
| Financial derivatives other than reserves, net | 20.2 | 15.2 | -21.8 | 37.0 | 35.3 |
| U.S. assets | 29,152.8 | -2,385.7 | (2) | (2) | 26,767.1 |
| Assets excluding financial derivatives | 27,362.4 | -3,595.8 | 739.9 | -4,335.7 | 23,766.6 |
| Financial derivatives other than reserves | 1,790.4 | 1,210.1 | (2) | (2) | 3,000.5 |
| U.S. liabilities | 40,203.3 | -1,378.7 | (2) | (2) | 38,824.6 |
| Liabilities excluding financial derivatives | 38,433.0 | -2,573.6 | 902.3 | -3,475.9 | 35,859.4 |
| Financial derivatives other than reserves | 1,770.3 | 1,194.9 | (2) | (2) | 2,965.2 |
| 1. Disaggregation of other changes in position into price changes, exchange rate changes, and other changes in volume and valuation is only presented for annual statistics (see table B and table 2 in this release). 2. Financial transactions and other changes in financial derivatives positions are available only on a net basis; they are not separately available for U.S. assets and U.S. liabilities. |
|||||
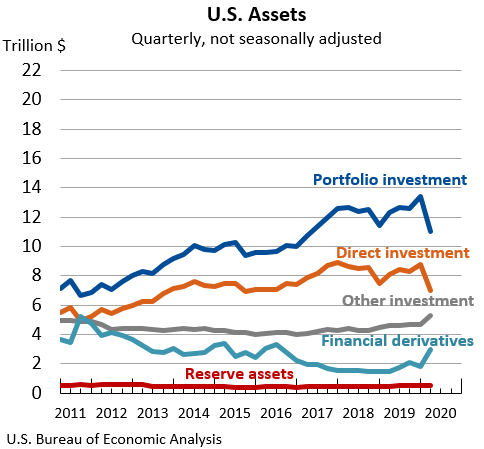
U.S. assets decreased by $2.39 trillion, to a total of $26.77 trillion, at the end of the first quarter, mostly reflecting decreases in portfolio investment and direct investment assets that were partly offset by increases in financial derivatives and in other investment assets. Portfolio investment assets decreased by $2.39 trillion, to $10.99 trillion, and direct investment assets decreased by $1.82 trillion, to $6.98 trillion, reflecting sharp decreases in foreign stock prices and the depreciation of major foreign currencies against the U.S. dollar that lowered the value of these assets in dollar terms. These large changes in asset prices reflected a sudden decrease in production and earnings as global economic activity was disrupted by the COVID-19 pandemic.
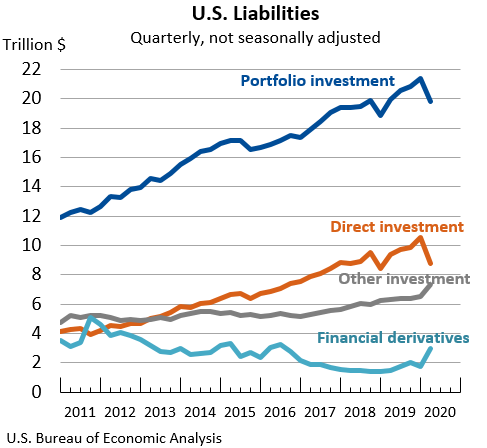
U.S. liabilities decreased by $1.38 trillion, to a total of $38.82 trillion, at the end of the first quarter, mostly reflecting decreases in direct investment and portfolio investment liabilities that were partly offset by increases in financial derivatives and in other investment liabilities. Direct investment liabilities decreased by $1.78 trillion, to $8.77 trillion, and portfolio investment liabilities decreased by $1.61 trillion, to $19.78 trillion, mostly reflecting decreases in U.S. stock prices amid the COVID-19 pandemic.
Annual Update
The statistics in this release reflect the annual update of the U.S. international investment position (IIP). With this update, BEA has incorporated newly available and revised source data, and has reclassified certain U.S. government capital subscriptions or other contributions to international organizations from loan assets to other equity assets, a new category within other investment assets. The reclassification of other equity assets results in the addition of line items in the IIP and the international transactions accounts (ITAs) for transactions and positions in other equity assets and liabilities. Also, BEA updated other equity and loan assets to incorporate U.S. government transactions and positions that were not previously included. Quarterly statistics are revised for the first quarter of 2006 to the fourth quarter of 2019. Annual statistics are revised for 1976-2019.
For 1976-1999, the reclassification of other equity assets from loan assets results in offsetting revisions between these two investment categories, leaving the statistics for U.S. assets and for the net IIP unchanged.
For 2000-2015, the statistics for U.S. assets and for the net IIP are revised up by an average of $0.8 billion annually, reflecting the incorporation of U.S. government transactions and positions that were not previously included in other equity and loan assets.
For 2016-2019, revisions to the IIP statistics reflect newly available and revised source data that impact all major categories of assets and liabilities (Table 3).
Additional information on these changes is published in “Preview of the 2020 Annual Update of the International Economic Accounts” in the April 2020 issue of the Survey of Current Business. An article describing the revisions to the statistics will be published in the July 2020 issue.
Newly Available and Revised Source Data: Key Providers and Years Affected
Annual Update for Year 2019
The U.S. net international investment position was –$11.05 trillion at the end of 2019 compared to –$9.67 trillion at the end of 2018 (Table 2).
The –$1.38 trillion change in the net investment position from the end of 2018 to the end of 2019 came from net financial transactions of –$395.5 billion and net other changes in position, such as price and exchange rate changes, of –$980.5 billion (Table B).
U.S. assets increased by $3.92 trillion, to a total of $29.15 trillion, at the end of 2019, reflecting increases in all major categories of assets, particularly in portfolio investment and direct investment assets. Portfolio investment assets increased by $1.94 trillion, to $13.38 trillion, and direct investment assets increased by $1.35 trillion, to $8.80 trillion, driven mainly by foreign stock price increases.
U.S. liabilities increased by $5.30 trillion, to a total of $40.20 trillion, at the end of 2019, reflecting increases in all major categories of liabilities, particularly in portfolio investment and direct investment liabilities. Portfolio investment liabilities increased by $2.55 trillion, to $21.39 trillion, and direct investment liabilities increased by $2.15 trillion, to $10.55 trillion, driven mainly by U.S. stock price increases.
Table B. Annual Change in the U.S. Net International Investment Position
Billions of dollars
| Position, 2018 |
Change in position in 2019 | Position, 2019 |
|||||||
| Total | Attributable to: | ||||||||
| Financial transactions |
Other changes in position | ||||||||
| Total | Price changes | Exchange rate changes | Changes in volume and valuation n.i.e |
||||||
| U.S. net international investment position | -9,674.4 | -1,376.1 | -395.5 | -980.5 | (1) | (1) | (1) | -11,050.5 | |
| Net position excl. derivatives | -9,716.5 | -1,354.2 | -357.2 | -997.0 | -1,104.9 | 119.5 | -11.5 | -11,070.7 | |
| Financial derivatives, net | 42.0 | -21.9 | -38.3 | 16.4 | (1) | (1) | (1) | 20.2 | |
| U.S. assets | 25,233.8 | 3,919.0 | (2) | (2) | (2) | (2) | (2) | 29,152.8 | |
| Assets excl. derivatives | 23,784.2 | 3,578.2 | 440.8 | 3,137.4 | 3,080.1 | 128.3 | -71.0 | 27,362.4 | |
| Financial derivatives | 1,449.6 | 340.8 | (2) | (2) | (2) | (2) | (2) | 1,790.4 | |
| U.S. liabilities | 34,908.2 | 5,295.1 | (2) | (2) | (2) | (2) | (2) | 40,203.3 | |
| Liabilities excl. derivatives | 33,500.7 | 4,932.4 | 798.0 | 4,134.4 | 4,185.0 | 8.8 | -59.4 | 38,433.0 | |
| Financial derivatives | 1,407.5 | 362.7 | (2) | (2) | (2) | (2) | (2) | 1,770.3 | |
| 1. Data are not separately available for price changes, exchange rate changes, and changes in volume and valuation n.i.e. (not included elsewhere). 2. Financial transactions and other changes in financial derivatives positions are available only on a net basis; they are not separately available for U.S. assets and U.S. liabilities. |
|||||||||
Next release: September 29, 2020, at 8:30 A.M. EDT
U.S. International Investment Position, Second Quarter 2020