
International Investment Position
End of Q1 2026: -$21.27 T
End of Q4 2025: -$21.87 T
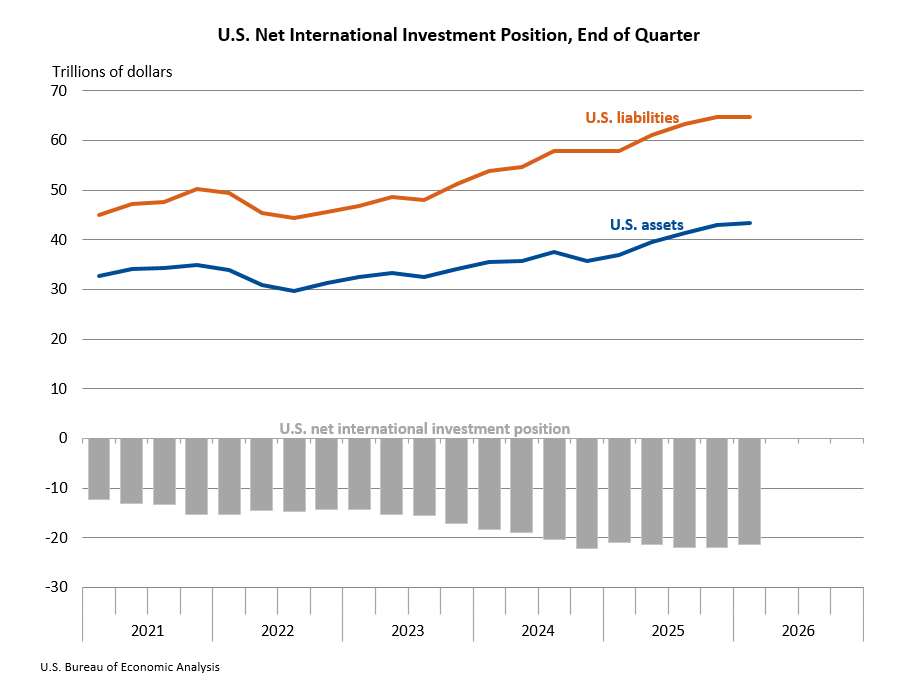
The U.S. net international investment position, the difference between U.S. residents’ foreign financial assets and liabilities, was –$21.27 trillion at the end of the first quarter of 2026. Assets totaled $43.37 trillion, and liabilities totaled $64.64 trillion. At the end of the fourth quarter of 2025, the net investment position was –$21.87 trillion (revised).
Current Release: June 24, 2026 | Next Release: September 24, 2026
- U.S. International Transactions and Investment Position, 1st Quarter 2026 and Annual Update
- Full Release (PDF) PDF
- Historical Comparisons (PDF) PDF
- Historical Comparisons (Annual) (PDF) PDF
- Quarterly Current-Account Balances (PDF) PDF
- Annual Current-Account Balances (PDF) PDF
- U.S. Direct Investment Abroad Statistics
- Foreign Direct Investment in the United States Statistics
- Additional Information
- International Investment Position (IIP) Tables CFM?REQID=62&STEP=5&ISURI=1&PRODUCT=5
- U.S. International Economic Accounts: Concepts and Methods
- International Investment Position Overview PDF
- 2014 Comprehensive Restructuring of the U.S. International Transactions Accounts PDF
- International Surveys: U.S. Direct Investment Abroad
- International Surveys: Foreign Direct Investment in the United States
- International Surveys: Archived Survey Forms
- U.S. International Investment Position: Third Quarter 2025 HTM
- U.S. International Investment Position: Second Quarter 2025 HTM
- U.S. International Investment Position: First Quarter 2025 and Annual Update HTM
- U.S. International Investment Position: Fourth Quarter and Year 2024 HTM
- U.S. International Investment Position: Third Quarter 2024 HTM
- U.S. International Investment Position: Second Quarter 2024 HTM
- U.S. International Investment Position: First Quarter 2024 and Annual Update HTM
- U.S. International Investment Position: Fourth Quarter and Year 2023 HTM
- Data Archive HTML?HMI=13&OLDDIV=INTERNATIONAL%20ACCOUNTS Previously published estimates contain historical data and have since been revised. Please contact the International program area with questions.
- News Release Archive
What is the international investment position?
The accumulated value of U.S.-owned financial assets in other countries and U.S. liabilities to residents of other countries at the end of each quarter. The difference between assets and liabilities is the U.S. net international investment position.
Director’s Blog: International Investment Position
Contact Personnel
-
TechnicalRebecca Pocase
-
Elena Nguyen
-
MediaConnie O’Connell