
News Release
U.S. International Investment Position, 1st Quarter 2025 and Annual Update
First Quarter
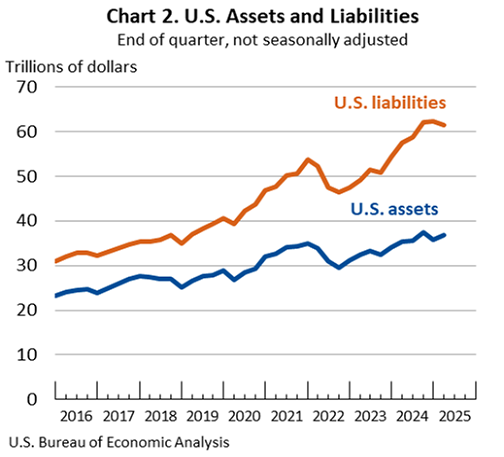
The U.S. net international investment position,the difference between U.S. residents' foreign financial assets and liabilities, was –$24.61 trillion at the end of the first quarter of 2025, according to statistics released today by the U.S. Bureau of Economic Analysis (chart 1). Assets totaled $36.85 trillion, and liabilities were $61.47 trillion (chart 2). At the end of the fourth quarter of 2024, the net investment position was –$26.54 trillion (revised). The net investment position and components of assets and liabilities are presented in table 1.
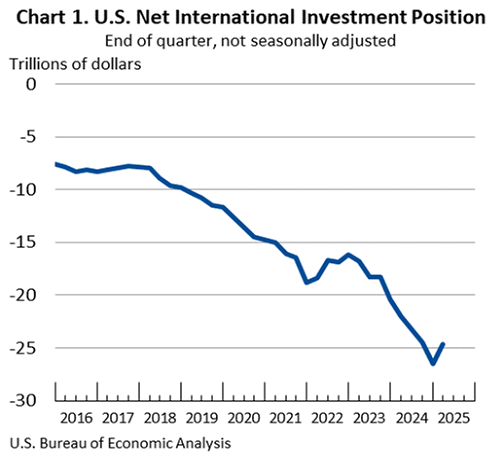
The $1.92 trillion change in the net investment position from the fourth quarter of 2024 to the first quarter of 2025 came from net financial transactions of –$277.5 billion and net other changes in position, such as price and exchange-rate changes, of $2.20 trillion (table 2).
Price changes of $1.73 trillion reflected price increases for assets and price decreases for liabilities, as foreign stock prices outperformed U.S. stock prices.
Exchange-rate changes of $472.5 billion reflected foreign currency appreciation against the U.S. dollar, which raised the value of U.S. assets more than U.S. liabilities in dollar terms.
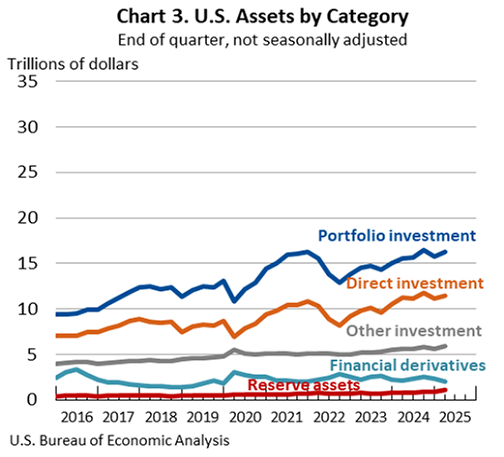
U.S. assets increased by $1.13 trillion to a total of $36.85 trillion at the end of the first quarter, driven mainly by financial transactions of $548.0 billion that largely reflected increased U.S. short-term lending abroad in the form of resale agreements, and by exchange-rate changes of $528.4 billion that reflected the appreciation of foreign currencies against the U.S. dollar (table 2). All major investment categories of assets, except financial derivatives, increased in the first quarter (chart 3).
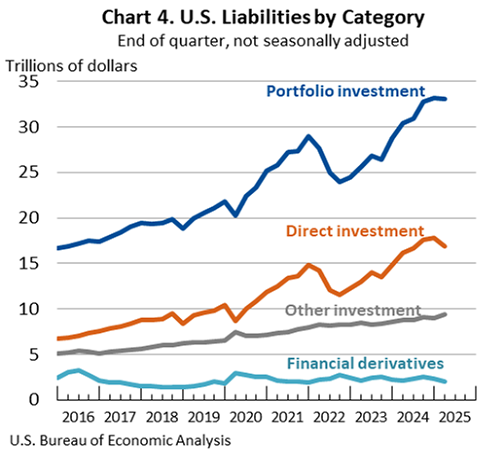
U.S. liabilities decreased by $792.0 billion to a total of $61.47 trillion at the end of the first quarter, driven by U.S. stock price decreases that lowered the market value of direct investment and portfolio investment liabilities by $836.4 billion and by $734.6 billion, respectively (table 2). Partly offsetting these price decreases were financial transactions of $844.8 billion that mostly reflected foreign purchases of U.S. debt securities and "other investment" inflows of deposits and loans. All major investment categories of liabilities except other investment decreased in the first quarter (chart 4).
Annual Update of the U.S. International Investment Position Accounts
The statistics in this release reflect the annual update of the U.S. International Investment Position Accounts. With this update, BEA has incorporated newly available and revised source data for 2022–2024 (table 3).
In addition, BEA has incorporated new statistics for transactions and positions related to a repurchase agreement facility for foreign and international monetary authorities (FIMA Repo Facility) that was established by the Federal Reserve in March 2020. The FIMA Repo Facility was designed to address pressures in global dollar funding markets that could affect financial market conditions in the United States. These transactions and positions are recorded as U.S. deposits in the central bank sector of other investment assets in the U.S. International Transactions Accounts and International Investment Position Accounts statistics, beginning with 2022.
Newly Available and Revised Source Data: Key Providers and Years Affected
More information on the annual update is available in "Preview of the 2025 Annual Update of the International Economic Accounts" in the Survey of Current Business, and additional information will be published in July in the Survey.
Next release: September 29, 2025, at 8:30 a.m. EDT
U.S. International Investment Position, 2nd Quarter 2025