
News Release
U.S. International Transactions, 1st Quarter 2025 and Annual Update
Current-Account Deficit Widened by 44.3 Percent in the First Quarter
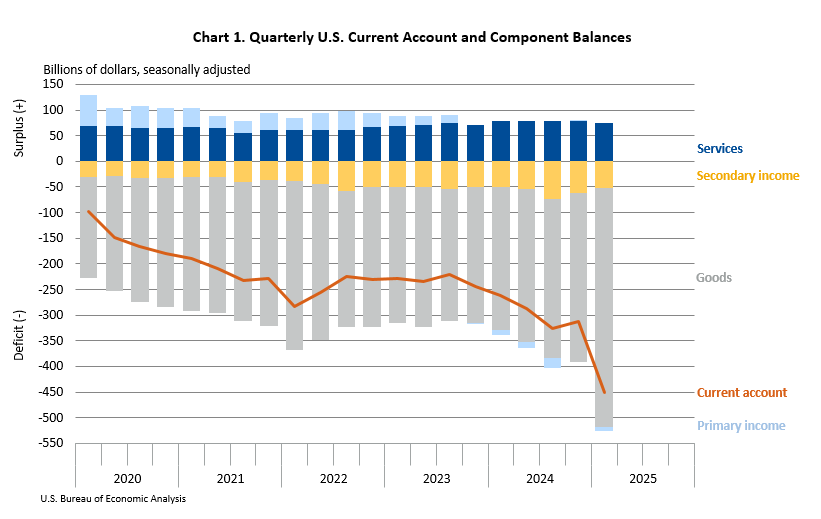
Current-Account Balance (Table 1 and Chart 1)
The U.S. current-account deficit, which reflects the combined balances on trade in goods and services and income flows between U.S. residents and residents of other countries, widened by $138.2 billion, or 44.3 percent, to $450.2 billion in the first quarter of 2025, according to statistics released today by the U.S. Bureau of Economic Analysis. The revised fourth-quarter deficit was $312.0 billion (table A).
The first-quarter deficit was 6.0 percent of current-dollar gross domestic product, up from 4.2 percent in the fourth quarter.
The $138.2 billion widening of the current-account deficit in the first quarter mostly reflected an expanded deficit on goods.
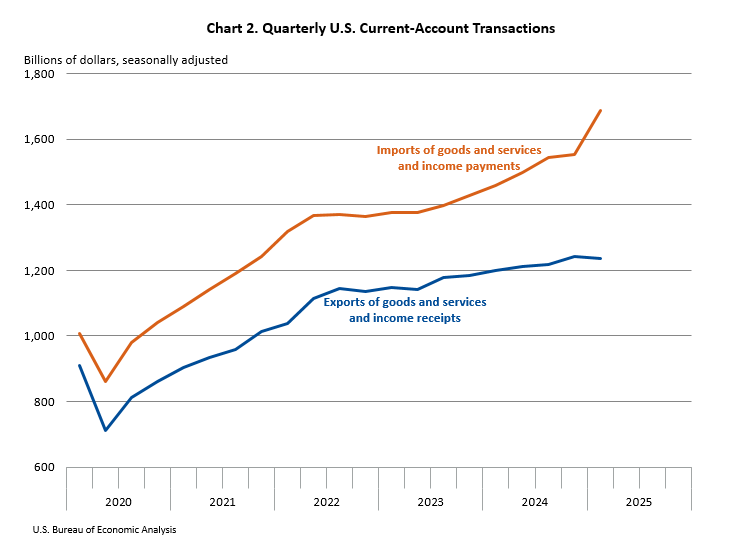
Current-Account Transactions (tables 1–5 and chart 2)
Exports of goods and services to, and income received from, foreign residents decreased $3.9 billion to $1.24 trillion in the first quarter. Imports of goods and services from, and income paid to, foreign residents increased $134.3 billion to $1.69 trillion.1
Trade in goods (table 2)
Exports of goods increased $21.1 billion to $539.0 billion, and imports of goods increased $158.2 billion to $1.00 trillion. The increase in exports was led by capital goods, mainly civilian aircraft and computer accessories, peripherals, and parts. The increase in imports was led by nonmonetary gold and consumer goods, mostly medicinal, dental, and pharmaceutical products (see “Additional Information” for a definition of nonmonetary gold under “Goods”).
Trade in services (table 3)
Exports of services decreased $4.4 billion to $293.2 billion, reflecting decreases in government goods and services, mostly military units and agencies, in travel, mostly “other personal travel,” and in “other business services,” mainly professional and management consulting services. These decreases were partly offset by an increase in maintenance and repair services. Imports of services decreased $1.8 billion to $217.8 billion, reflecting a decrease in charges for the use of intellectual property, mostly licenses for the use of outcomes of research and development.
Primary income (table 4)
Receipts of primary income decreased $22.9 billion to $355.1 billion, and payments of primary income decreased $13.7 billion to $362.7 billion. The decreases in both receipts and payments reflected a decrease in direct investment income, mostly earnings.
Secondary income (table 5)
Receipts of secondary income increased $2.3 billion to $49.6 billion, reflecting an increase in private transfers, primarily fines and penalties. Payments of secondary income decreased $8.4 billion to $101.5 billion, reflecting a decrease in general government transfers, primarily international cooperation.
Capital-Account Transactions (table 1)
Capital-transfer receipts decreased $2.4 billion to $8.9 billion in the first quarter. The decrease reflected first-quarter receipts from foreign insurance companies for losses resulting from wildfires in Southern California that were lower than fourth-quarter receipts for losses resulting from Hurricane Milton. For information on transactions associated with hurricanes and other disasters, see “How do losses recovered from foreign insurance companies following natural or man-made disasters affect foreign transactions, the current account balance, and net lending or net borrowing?”. Capital-transfer payments increased $0.5 billion to $2.0 billion.
Financial-Account Transactions (tables 1, 6, 7, and 8 and chart 3)
Net financial-account transactions were −$299.5 billion in the first quarter, reflecting net U.S. borrowing from foreign residents.
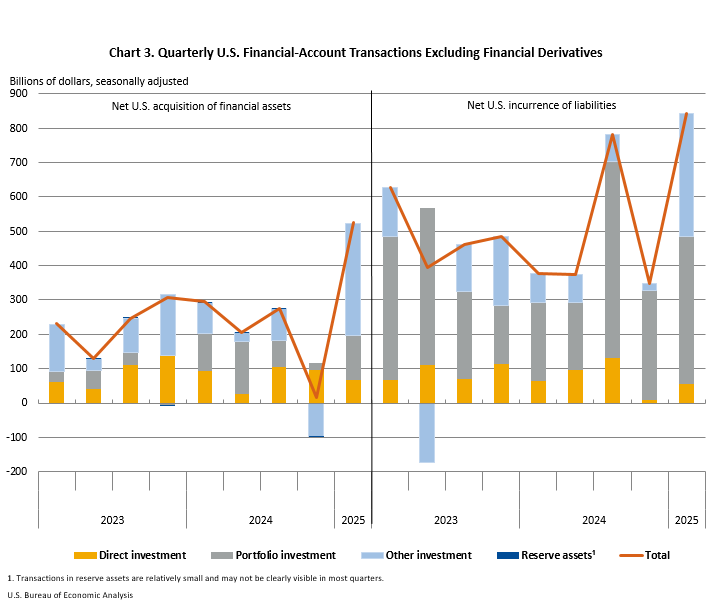
Financial assets (tables 1, 6, 7, and 8)
First-quarter transactions increased U.S. residents’ foreign financial assets by $524.9 billion. Transactions increased “other investment assets,” mostly short-term loans, by $328.2 billion; portfolio investment assets, mostly debt securities, by $128.4 billion; direct investment assets, mostly equity, by $66.8 billion; and reserve assets by $1.5 billion.
Liabilities (tables 1, 6, 7, and 8)
First-quarter transactions increased U.S. liabilities to foreign residents by $843.7 billion. Transactions increased portfolio investment liabilities, mostly long-term debt securities, by $429.9 billion; “other investment liabilities,” mainly short-term deposits and loans, by $358.9 billion; and direct investment liabilities, mostly equity, by $54.9 billion.
Financial derivatives (table 1)
Net transactions in financial derivatives were $19.3 billion in the first quarter, reflecting net U.S. lending to foreign residents.
Table A. Updates to Fourth-Quarter 2024 International Transactions Accounts Balances [Billions of dollars, seasonally adjusted] | ||
|---|---|---|
| Preliminary estimates | Revised estimates | |
| Current-account balance | –303.9 | −312.0 |
| Goods balance | −326.1 | −328.9 |
| Services balance | 76.1 | 78.0 |
| Primary income balance | 2.3 | 1.6 |
| Secondary income balance | −56.2 | −62.6 |
| Net financial-account transactions | −385.3 | −350.8 |
| U.S. Bureau of Economic Analysis | ||
Annual Update of the U.S. International Transactions Accounts
The statistics in this release reflect the annual update of the U.S. International Transactions Accounts. With this update, BEA has incorporated newly available and revised source data and recalculated seasonal and trading-day adjustments beginning with 2018. This annual update also reflects the incorporation of (1) BEA’s 2022 Benchmark Survey of Transactions in Selected Services and Intellectual Property With Foreign Persons, (2) a new balance of payments adjustment to exports of goods to redistribute estimates for late receipts for Canada from “other goods” to detailed commodities, (3) a new method for estimating other investment assets and other investment liabilities transactions by maturity, and (4) new statistics for transactions, income, and positions related to a repurchase agreement facility for foreign and international monetary authorities. A summary of the revisions to high-level aggregates is shown in table 9.
Table B. Newly Available and Revised Source Data: Key Providers and Years Affected
| Agency | Data | Years affected |
|---|---|---|
| U.S. Bureau of Economic Analysis | Quarterly and benchmark international trade in services surveys | 2018–2024 |
| Annual and quarterly direct investment surveys | 2022–2024 | |
| U.S. Census Bureau | Revised source data for international trade in goods | 2022–2024 |
| U.S. Department of the Treasury | Quarterly and monthly portfolio and other investment surveys | 2022–2024 |
| Benchmark and quarterly portfolio investment surveys | 2023–2024 | |
| U.S. Bureau of Economic Analysis | ||
More information on the annual update is available in “Preview of the 2025 Annual Update of the International Economic Accounts” in the Survey of Current Business. Additional information will be provided in the Survey in July 2025. U.S. International Economic Accounts: Concepts and Methods will be updated in September 2025 accordingly.
Next release: September 23, 2025, at 8:30 a.m. EDT
U.S. International Transactions, 2nd Quarter 2025
1 U.S. international transactions are presented in current dollars in accordance with international statistical presentation guidelines. For a comparison of current-dollar, or nominal, and inflation-adjusted, or real, measures of international transactions, see “SECTION 4 – FOREIGN TRANSACTIONS” of the National Income and Product Accounts.