
News Release
Gross Domestic Product by Metropolitan Area, 2013 (advance estimate) and Revised 2001 - 2012
Advance 2013, and Revised 2001–2012 GDP-by-Metropolitan-Area Statistics
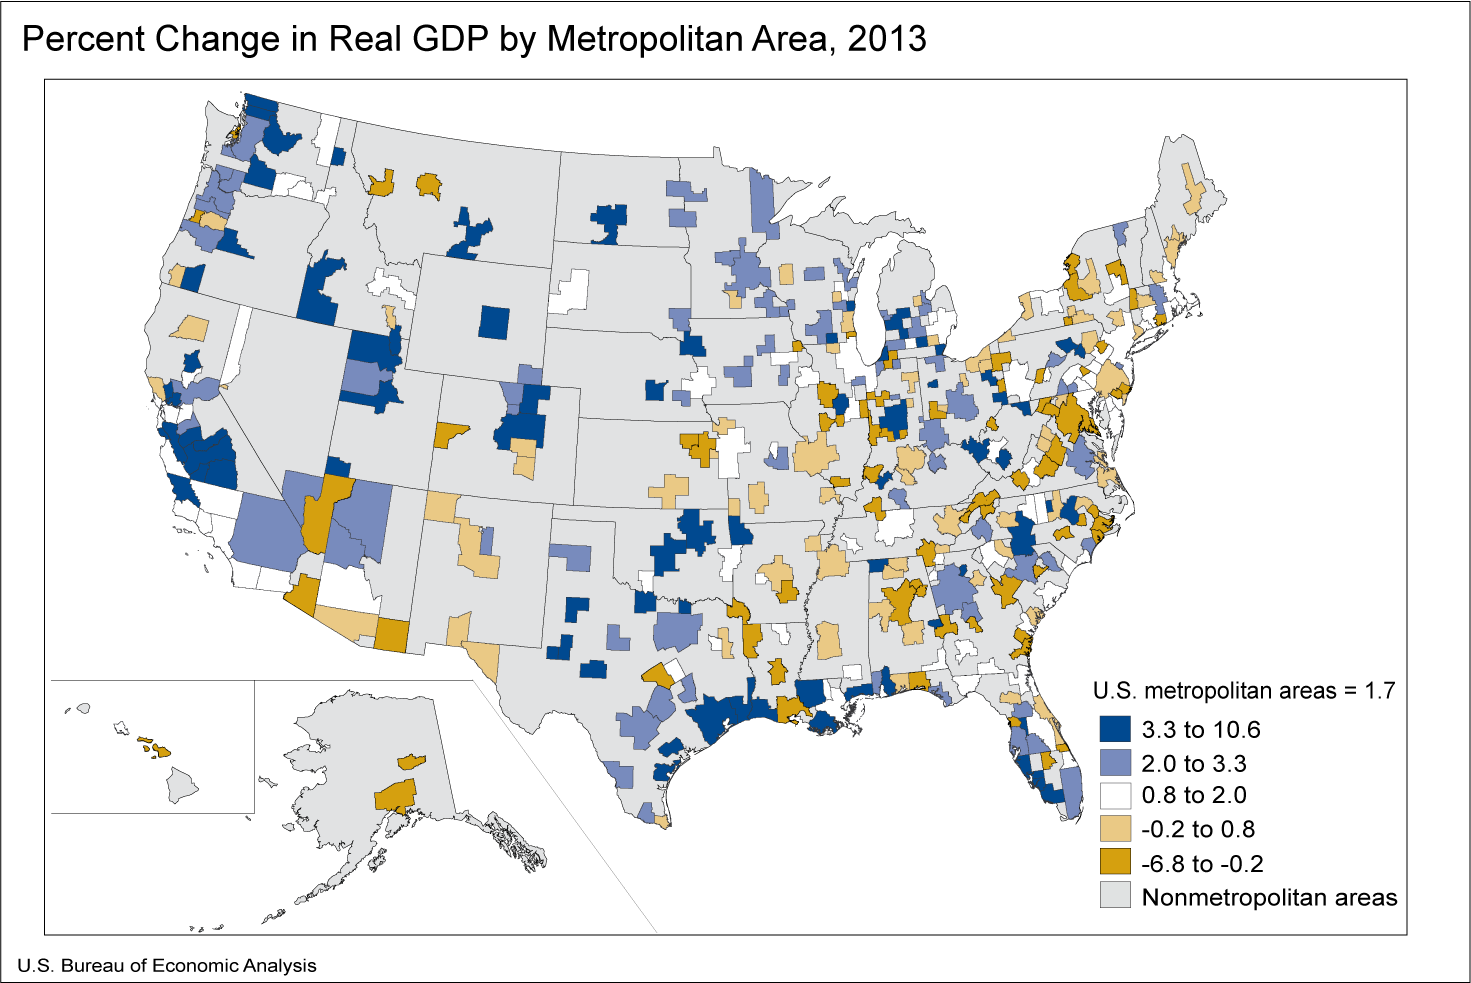
Real GDP increased in 292 of the nation's 381 metropolitan areas in 2013, led by widespread growth in finance, insurance, real estate, rental, and leasing, nondurable-goods manufacturing, and professional and business services, according to new statistics released today by the U.S. Bureau of Economic Analysis. Natural resources and mining also spurred strong growth in several metropolitan areas. Collectively, real GDP for U.S. metropolitan areas increased 1.7 percent in 2013 after increasing 2.6 percent in 2012.1

Finance, insurance, real estate, rental, and leasing contributed 0.36 percentage point to U.S. metropolitan area real GDP growth in 2013. This industry contributed to growth in 268 of the nation's 381 metropolitan areas. Growth in this industry accounted for more than half of real GDP growth in 61 metropolitan areas, and contributed more than one percentage point to growth in 55 metropolitan areas, most notably in Williamsport, PA (3.49 percentage points); State College, PA (3.02 percentage points); and Bloomington, IL (2.87 percentage points).
Nondurable-goods manufacturing contributed 0.32 percentage point to U.S. metropolitan area real GDP growth in 2013. This industry contributed to growth in 273 metropolitan areas and contributed more than one percentage point to growth in 45 metropolitan areas. Strong contributions from this industry fueled growth in many areas, including in the nation's fastest growing metropolitan area—Mount Vernon-Anacortes, WA, which grew 10.6 percent. Metropolitan areas with concentrations in petroleum and coal products manufacturing, which includes refineries, had particularly strong contributions from this industry, such as Beaumont-Port Arthur, TX (8.71 percentage points); Lima, OH (8.51 percentage points); and Mount Vernon-Anacortes, WA (8.09 percentage points).
Professional and business services contributed 0.24 percentage point to U.S. metropolitan area real GDP growth in 2013. This industry contributed to growth in 245 metropolitan areas and contributed more than one percentage point to growth in 19 metropolitan areas. The largest contributions from this industry occurred in Fayetteville-Springdale-Rogers, AR-MO (3.33 percentage points) and Janesville-Beloit, WI (2.61 percentage points).
Although natural resources and mining was not a major contributor to growth for the nation, this industry contributed to strong growth in several metropolitan areas. Mining in the Utica and Marcellus shale formations led to notable contributions to growth for natural resources and mining in Beckley, WV (11.49 percentage points); Wheeling, WV-OH (8.50 percentage points); and Charleston, WV (3.63 percentage points). Mining in the Niobrara shale formation contributed significantly to the 10.1 percent increase in total real GDP for Greeley, CO.2
The government sector subtracted 0.12 percentage point from U.S. metropolitan area real GDP growth in 2013. This sector subtracted from growth in 292 metropolitan areas. The largest subtractions occurred in Hinesville, GA (4.12 percentage points); Jacksonville, NC (3.00 percentage points); and Warner Robins, GA (2.05 percentage points).
Tables 1–3 show these results in more detail; complete detail is available on the BEA Web site at www.bea.gov.
Comprehensive Revision of Gross Domestic Product by Metropolitan Area. The statistics released today reflect the results of the comprehensive revision of gross domestic product (GDP) by metropolitan area for 2001–2012. These statistics incorporate the November 2013 comprehensive revision of local area personal income and are consistent with GDP by state released in June 2014 and national GDP by industry released in January 2014. These statistics incorporate the comprehensive revision of the national income and product accounts (NIPAs) released in July 2013, but do not incorporate the July 2014 annual revision of the NIPAs. The comprehensive revision includes the recognition of research and development (R&D) expenditures as capital, the capitalization of entertainment, literary, and other artistic originals, and the use of an improved accrual accounting treatment of transactions for defined benefit pension plans. Additional information on this revision will be available in an article in the October 2014 issue of the Survey of Current Business.
1The GDP data in this release reflect the new concepts and definitions that were part of the comprehensive revision to the national income and product accounts released in July 2013. See the box on page 3.
2The location of these formations can be found on the following map released by the EIA: http://www.eia.gov/oil_gas/rpd/shale_gas.jpg.
Advance Statistics of GDP by Metropolitan Area for 2013 by NAICS Sector
The advance statistics of GDP by metropolitan area for 2013 are based on source data that are incomplete or subject to further revision by the source agency. Revised statistics, based on more complete data, will be released in September 2015.
More information on the methodology used to produce these advance 2013 statistics, on the revised statistics of GDP by metropolitan area for 2001–2012, and on revisions to these statistics will appear in an article in the October 2014 issue of the Survey of Current Business, BEA's monthly journal.
Explanatory Notes
Definitions. GDP by metropolitan area is the sub-state counterpart of the Nation's gross domestic product (GDP), the Bureau's featured and most comprehensive measure of U.S. economic activity. GDP by metropolitan area is derived as the sum of the GDP originating in all the industries in the metropolitan area.
The statistics of real GDP by metropolitan area are prepared in chained (2009) dollars. Real GDP by metropolitan area is an inflation-adjusted measure of each area's gross product that is based on national prices for the goods and services produced within the metropolitan area. The statistics of real GDP by metropolitan area and of quantity indexes with a reference year of 2009 were derived by applying national chain-type price indexes to the current-dollar GDP-by-metropolitan-area values for the 61 detailed NAICS-based industries.
The Fisher chain-type price index formula that is used in the national accounts is then used to calculate the values of total real GDP by metropolitan area and of real GDP by metropolitan area at more aggregated industry levels. Real GDP by metropolitan area captures the differences across metropolitan areas that reflect the relative differences in the mix of goods and services that the areas produce. However, real GDP by metropolitan area does not capture geographic differences in the prices of goods and services that are produced and sold locally.
Relation of GDP by metropolitan area real growth rates to national GDP. Following typical procedures, the statistics of GDP by metropolitan area released today are consistent with statistics of GDP by state released June 11, 2014, which were based on the comprehensive revision of the national income and product accounts (NIPAs) released on July 31, 2013, and BEA's national statistics of GDP by industry released on January 23, 2014. As is normally the case, the growth rate of real GDP in the nation's metropolitan areas differs from the nation's real GDP growth rates released in July 2013. In part, the difference is caused by the inclusion of nonmetropolitan areas in the national statistics. In addition, growth rates differ because of differences in the timing of production cycles and availability of data in preparing national and regional statistics, which preclude BEA from incorporating the immediately preceding July annual revisions of the NIPAs into the advance statistics of GDP by metropolitan area.
Metropolitan (statistical) areas. The metropolitan (statistical) areas used by BEA for its entire series of GDP statistics are the county-based definitions developed by the Office of Management and Budget (OMB) for federal statistical purposes and last updated in February 2013. OMB's general concept of a metropolitan area is that of a geographic area consisting of a large population nucleus together with adjacent communities having a high degree of economic and social integration with the nucleus.
The statistics of GDP by metropolitan area in current and real (chained) dollars are available from the Regional Economic Accounts page of the BEA Web site at /regional/index.htm.
BEA's national, international, regional, and industry statistics; the Survey of Current Business; and BEA news releases are available without charge on BEA's Web site at www.bea.gov. By visiting the site, you can also subscribe to receive free e-mail summaries of BEA releases and announcements.