
News Release
State Quarterly Personal Income, 1st quarter 2014 - 1st quarter 2015
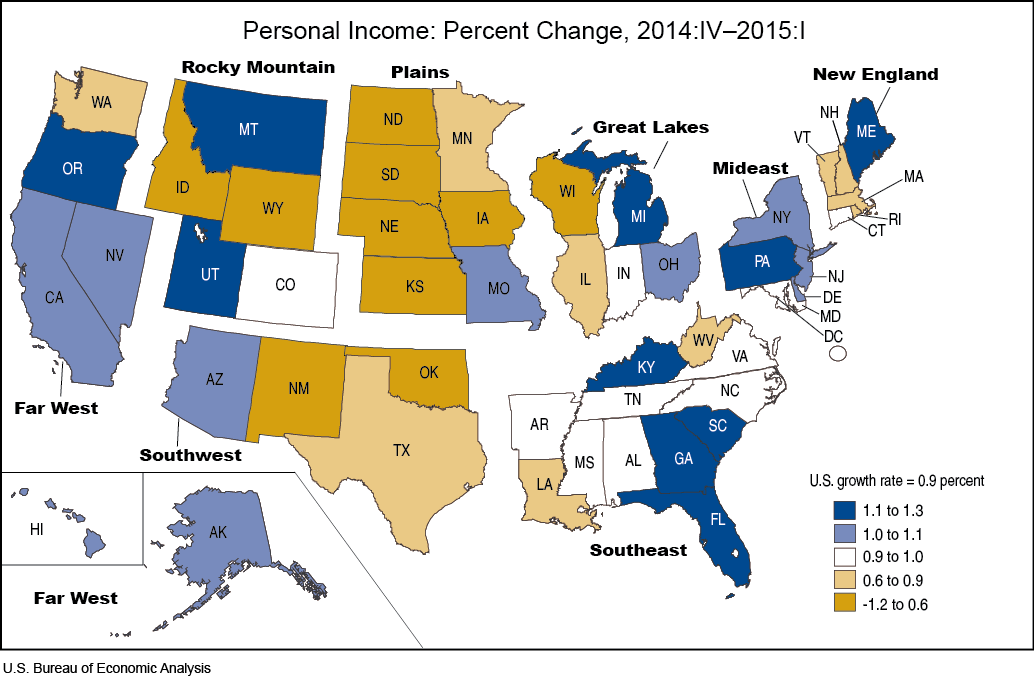
State personal income grew 0.9 percent on average in the first quarter of 2015, after growing 1.1 percent in the fourth quarter of 2014, according to estimates released today by the U.S. Bureau of Economic Analysis. Personal income grew in 46 states and growth accelerated in 15 of those states. The fastest growth, 1.3 percent, was in Florida. Personal income fell in four states, with the largest decline, 1.2 percent, in Iowa. The national price index for personal consumption expenditures, fell 0.5 percent in the first quarter, after falling 0.1 percent in the fourth quarter.
Earnings. Overall, earnings increased 0.8 percent in the first quarter of 2015, a slowdown from the 1.4 percent increase in the fourth quarter of 2014. The slower pace was entirely in the private sector. In contrast, government earnings growth accelerated to 0.5 percent from 0.3 percent in the fourth quarter.
In the private sector, earnings declined in two industries, farm and mining.
Farm earnings fell 22.4 percent in the first quarter with declines in all but 9 states. Most of the earnings decline was due to lower livestock output. In four farm belt states, Iowa, Kansas, Nebraska, and South Dakota the fall in farm earnings entirely offset the earnings growth of their nonfarm sectors.
Earnings in mining (which includes oil and gas extraction) fell 3.5 percent in the first quarter, the first decline since the third quarter of 2009. Mining earnings fell 4.5 percent in Wyoming, 4.4 percent in Louisiana, 4.1 percent in North Dakota, 3.9 percent in Oklahoma, and 3.1 percent in Texas.
Earnings grew in all other private sector industries in the first quarter of 2015. Earnings growth accelerated in five industries, including professional services and health care and slowed in 15 industries, including durable goods manufacturing, transportation, finance, and administrative services.
- Earnings growth in durable goods manufacturing slowed to 0.7 percent in the first quarter from 1.9 percent in the fourth quarter. Among the larger manufacturing states, durable goods manufacturing earnings declined 2.9 percent in Washington and 0.2 percent in Texas.
- Earnings growth in transportation slowed to 0.6 percent in the first quarter from 2.2 percent in the fourth quarter. In Georgia, where the industry consists primarily of air and truck transportation, transportation earnings declined 2.1 percent.
- Earnings growth in finance slowed to 0.9 percent in the first quarter from 2.2 percent in the fourth quarter. Finance earnings declined 2.3 percent in Massachusetts and 0.1 percent in North Carolina.
- Earnings growth in administrative services slowed to 0.1 percent in the first quarter from 2.0 percent in the fourth quarter. Administrative services earnings declined 0.8 percent in Georgia, 0.7 percent in New Jersey, 0.3 percent in Ohio, and 0.2 percent in Texas.
In California, Delaware, Minnesota, and 6 other states, nonfarm earnings growth accelerated in the first quarter.
- California's nonfarm earnings increased 1.2 percent in the first quarter up from 1.0 percent in the fourth quarter. Most of the acceleration was in the information industry, which grew 1.7 percent.
- Delaware's nonfarm earnings increased 1.1 percent in the first quarter, up from 0.3 percent in the fourth quarter. Most of the acceleration was in the finance and management of companies industries, which grew 1.5 percent and 1.8 percent, respectively.
- Minnesota's nonfarm earnings increased 1.2 percent in the first quarter, up from 0.5 percent in the fourth quarter. Most of the acceleration was in health care, which grew 1.6 percent.
Personal current transfer receipts. Personal current transfer receipts increased 2.1 percent in the first quarter of 2015, the largest increase in five years. The first-quarter estimates of current transfer receipts reflected several special factors. Social security benefits, which increased 2.1 percent, were boosted by a 1.7 percent cost-of-living adjustment. Medicaid benefits, which increased 3.3 percent, were boosted by expanded coverage in Indiana and Pennsylvania under the Affordable Care Act (ACA). Medicaid benefits increased 7.8 percent in Indiana and 8.2 percent in Pennsylvania.
Upcoming Annual Revision of the State Personal Income Accounts. The annual revision of the state personal income accounts will be released along with estimates for the second quarter of 2015 on September 30. In addition to the regular revision of the estimates for the most recent 3 years and for the first quarter of 2015, some series will be revised back further. The July Survey of Current Business will contain an article that previews the annual revision, and the October Survey will contain an article that describes the results.
Quarterly state personal income estimates for 2014:I to 2014:IV have been revised.
Next quarterly state personal income release — September 30, 2015, at 8:30 A.M. for second quarter 2015.
Definitions
Personal income is the income received by all persons from all sources. Personal income is the sum of net earnings by place of residence, property income, and personal current transfer receipts. Net earnings by place of residence is earnings by place of work (the sum of wages and salaries, supplements to wages and salaries, and proprietors' income) less contributions for government social insurance, plus an adjustment to convert earnings by place of work to a place-of-residence basis. Property income is rental income of persons, personal dividend income, and personal interest income. Personal current transfer receipts are benefits received by persons from federal, state, and local governments and from businesses for which no current services are performed. They include retirement and disability insurance benefits (mainly Social Security), medical benefits (mainly Medicare and Medicaid), income maintenance benefits, unemployment insurance compensation, veterans' benefits, and federal education and training assistance.
Personal income is measured before the deduction of personal income taxes and other personal taxes and is reported in current dollars (no adjustment is made for price changes).
The estimate of personal income for the United States is the sum of the state estimates and the estimate for the District of Columbia; it differs slightly from the estimate of personal income in the national income and product accounts (NIPAs) because of differences in coverage, in the methodologies used to prepare the estimates, and in the timing of the availability of source data.
Statistical Convention
Quarter-to-quarter percent changes are calculated from unrounded data and are not annualized. Quarterly estimates are expressed at seasonally adjusted annual rates, unless otherwise specified. Quarter-to-quarter dollar changes are differences between published estimates.
BEA Regions
BEA groups all 50 states and the District of Columbia into eight distinct regions for purposes of data collecting and analyses: New England (Connecticut, Maine, Massachusetts, New Hampshire, Rhode Island, and Vermont); Mideast (Delaware, District of Columbia, Maryland, New Jersey, New York, and Pennsylvania); Great Lakes (Illinois, Indiana, Michigan, Ohio, and Wisconsin); Plains (Iowa, Kansas, Minnesota, Missouri, Nebraska, North Dakota, and South Dakota); Southeast (Alabama, Arkansas, Florida, Georgia, Kentucky, Louisiana, Mississippi, North Carolina, South Carolina, Tennessee, Virginia, and West Virginia); Southwest (Arizona, New Mexico, Oklahoma, and Texas); Rocky Mountain (Colorado, Idaho, Montana, Utah, and Wyoming); and Far West (Alaska, California, Hawaii, Nevada, Oregon, and Washington).
Use of State Personal Income Statistics
State personal income statistics provide a framework for analyzing current economic conditions in each state and can serve as a basis for decision making. For example:
- Federal government agencies use the statistics as a basis for allocating funds and determining matching grants to states. The statistics are also used in forecasting models to project energy and water use.
- State governments use the statistics to project tax revenues and the need for public services.
- Academic regional economists use the statistics for applied research.
- Businesses, trade associations, and labor organizations use the statistics for market research.
Resources
The entire historical time series for these estimates can be accessed in BEA's Interactive Data Application at www.bea.gov/itable/. Mapping and charting software are also available.
Further discussion of the regional statistics presented in this news release will be provided in the next issue of the Survey of Current Business, available online at: www.bea.gov/scb/index.htm
Complete information on the sources and methods for the estimation of BEA's State Personal Income and Employment is available online at: www.bea.gov/regional/pdf/spi2013.pdf
BEA Regional Facts (BEARFACTS), a narrative summary of personal income, per capita personal income, and components of income for each state, is available online at: www.bea.gov/regional/bearfacts/
BEA's news release schedule is available at: www.bea.gov/newsreleases/2015rd.htm
Stay informed about BEA developments by signing up for our email subscription service or following us on Twitter @BEA_News. You also can access BEA data by registering for our Data Application Programming Interface, or API, at: www.bea.gov/API/signup/index.cfm