
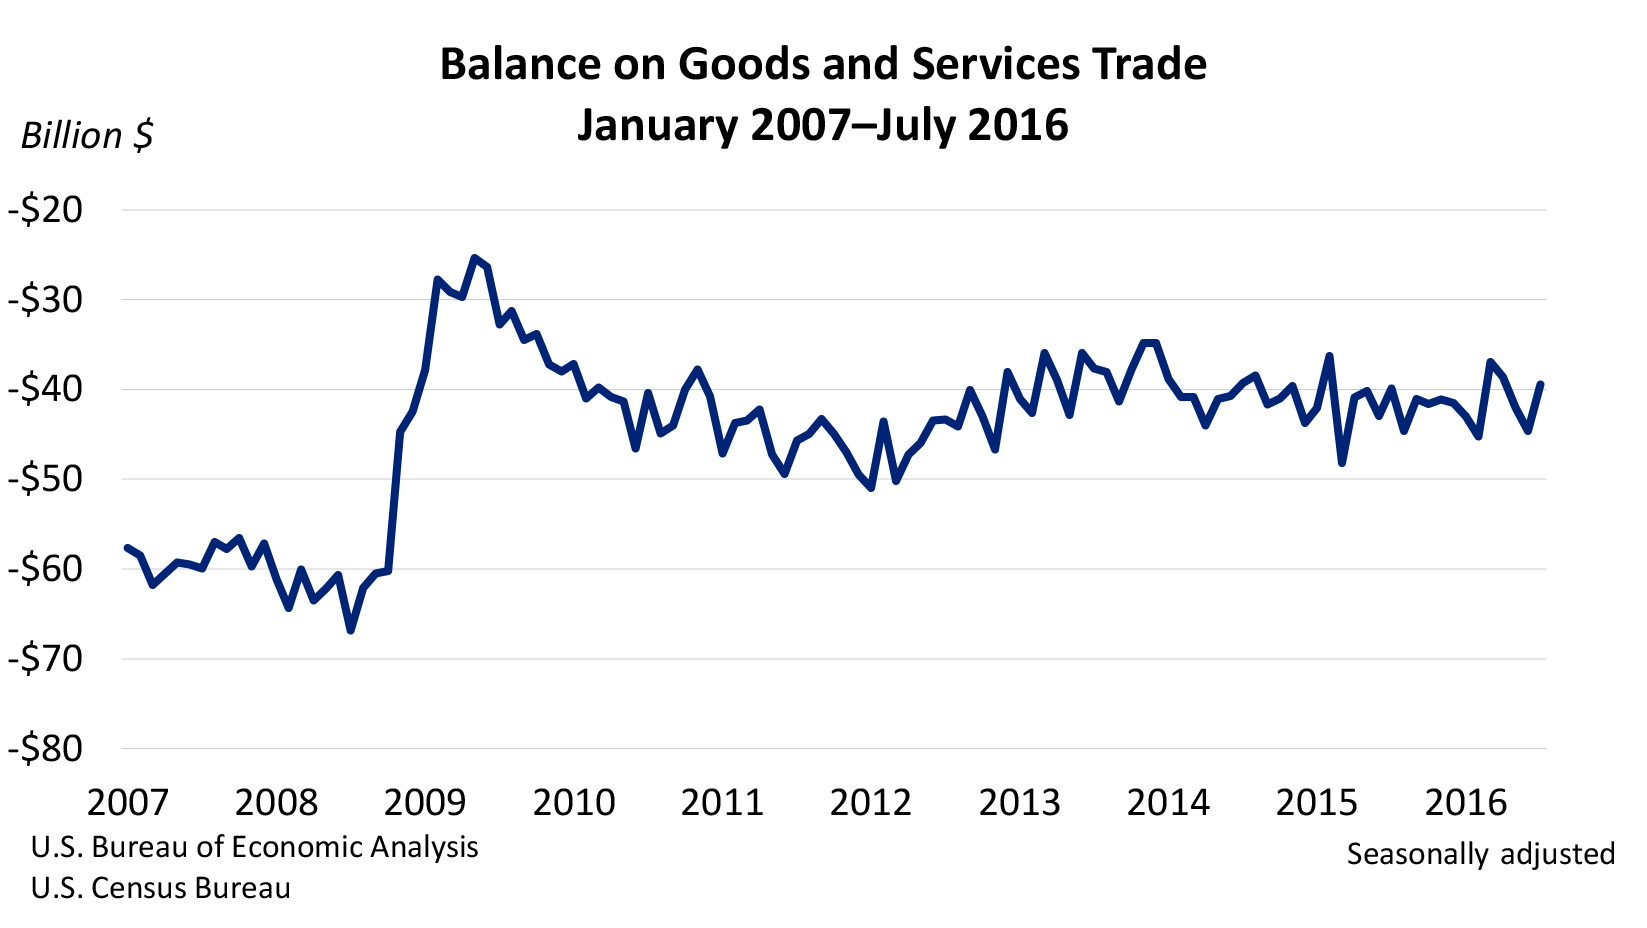
The U.S. monthly international trade deficit decreased in July 2016 according to the U.S. Bureau of Economic Analysis and the U.S. Census Bureau. The deficit decreased from $44.7 billion in June (revised) to $39.5 billion in July, as exports increased and imports decreased. The previously published June deficit was $44.5 billion. The goods deficit decreased $5.3 billion in July to $60.3 billion. The services surplus decreased $0.1 billion in July to $20.9 billion.
Exports
Exports of goods and services increased $3.4 billion, or 1.9 percent, in July to $186.3 billion. Exports of goods increased $3.4 billion and exports of services decreased less than $0.1 billion.
- The increase in exports of goods reflected an increase in foods, feeds, and beverages ($3.7 billion). A decrease in other goods ($0.7 billion) was partly offsetting.
- The decrease in exports of services reflected decreases in transport ($0.1 billion), which includes freight and port services and passenger fares, and in financial services ($0.1 billion). An increase in travel (for all purposes including education) ($0.2 billion) was partly offsetting.
Imports
Imports of goods and services decreased $1.8 billion, or 0.8 percent, in July to $225.8 billion. Imports of goods decreased $1.9 billion and imports of services increased $0.1 billion.
- The decrease in imports of goods reflected decreases in consumer goods ($1.5 billion) and in capital goods ($0.7 billion). An increase in industrial supplies and materials ($0.4 billion) was partly offsetting.
- The increase in imports of services reflected an increase in travel (for all purposes including education) ($0.1 billion).
For more detailed information on trade by type of good or service and with major trading partners, see U.S. International Trade in Goods and Services: July 2016.
For more information, read the full report.