
Arts and cultural economic activity decreased an inflation-adjusted 6.4 percent in 2020, after increasing 3.4 percent in 2019, according to statistics released today by the U.S. Bureau of Economic Analysis.
Arts and cultural economic activity accounted for 4.2 percent of gross domestic product (GDP), or $876.7 billion, in 2020, the Arts and Cultural Production Satellite Account shows.
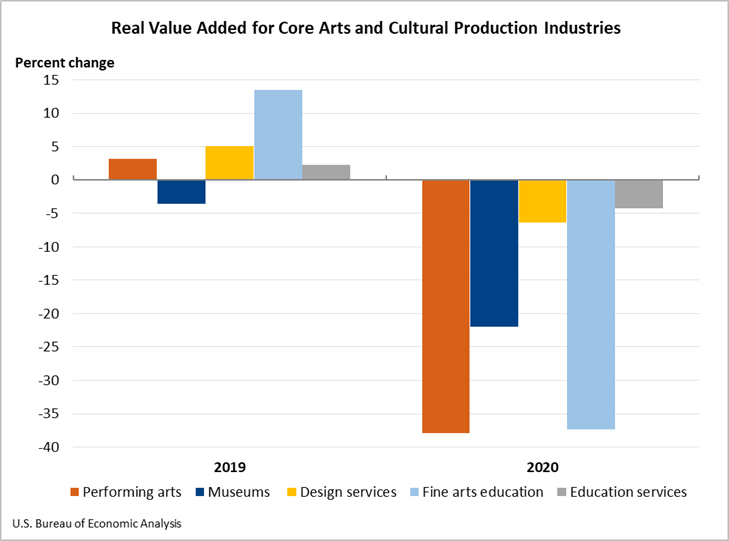
The core industries, which include performing arts, museums, design services, fine arts education, and education services, decreased 20.6 percent, adjusted for inflation. Supporting industries, which include art support services and information services, decreased 1.9 percent.
The arts and culture economy in 2020 was impacted by the response to the spread of COVID-19. Governments issued and lifted stay-at-home orders, leading to rapid changes in consumer spending, and the U.S. government passed laws to support and sustain businesses and individuals. The full economic effects of the pandemic cannot be quantified in these estimates because the impacts are generally embedded in source data and cannot be separately identified.
- Arts and cultural production’s nominal value added (an industry’s contribution to GDP, without inflation adjustment) decreased 5.8 percent nationally in 2020.
- The industry’s nominal value added decreased in the District of Columbia and in every state except Washington. The percent change in states ranged from a 9.4 percent increase in Washington to –22.1 percent in Nevada.
- Arts and cultural employment decreased 11.6 percent nationwide, declining in all 50 states and the District of Columbia. State decreases ranged from –3.6 percent in Montana to –29.9 percent in Nevada.
- The total number of arts and cultural jobs for the nation was 4.6 million.
- Arts and cultural compensation nationwide decreased 0.2 percent; it increased in 13 states and the District of Columbia. The changes ranged from a 9.7 percent increase in Washington state to –26.1 percent in Nevada.
BEA’s Arts and Cultural Production Satellite Account is sponsored by funding from the National Endowment for the Arts. It is one of several satellite accounts that complement BEA’s core statistics, such as GDP, by pulling together additional detail on specific industries.
Visit BEA’s arts and cultural production webpage for the full report and an interactive map of the arts and culture economy in each state.