
News Release
1999 State Per Capita Income (Revised)
| Duke Tran: | (202) | 6065344 | (Analysis) | BEA 0027 |
| Kathy Albetski: | 6065360 | (Estimates) |
Massachusetts and four western states W ashington, Wyoming, California, and Colorado had the fastest growth in per capita personal income in the nation in 1999, according to revised estimates released by the Bureau of Economic Analysis (BEA), Commerce Department.
For the nation, per capita income grew 4.5 percent in 1999 to $28,542, after growing 5.6 percent in 1998 (see table 1). In 46 states, per capita income grew less in 1999 than in 1998. Prices paid by U.S. consumers (as measured by the price index for personal consumption expenditures) increased 1.8 percent in 1999 after increasing 1.1 percent in 1998. All 50 states and the District of Columbia had growth rates in per capita income that were above the increases in prices in both 1998 and 1999.
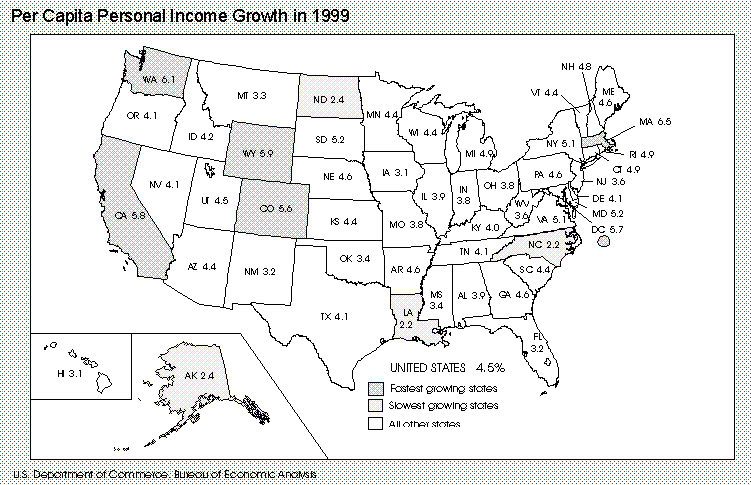
State per capita income growth in 1999
Fastest growing states.In 1999, the five states with the fastest growth in per capita income were Massachusetts (6.5 percent), Washington (6.1 percent), Wyoming (5.9 percent), California (5.8 percent), and Colorado (5.6 percent). Except for Wyoming, these states had per capita incomes above the U.S. average of $28,542.
In all five states, growth rates in personal income exceeded the U.S. average of 5.4 percent. In Washington, California, and Colorado, growth rates in population exceeded the U.S. average of 0.9 percent; population declined in Wyoming and grew at below-average rate in Massachusetts (see the chart below).
for the U.S. and selected States, 199899
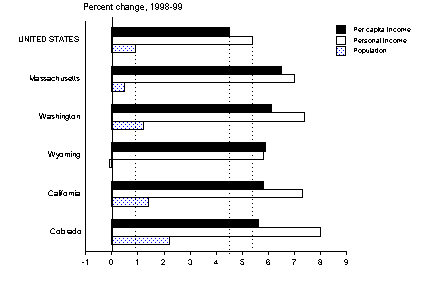
In all five fastest growing states in 1999, net earnings was the major contributor to personal income growth (see table 5, contribution to percent change in personal income, and Definitions on page 5).
Slowest growing states.In 1999, the four states with the slowest growth in per capita income were North Carolina (2.2 percent), Louisiana (2.2 percent), North Dakota (2.4 percent), and Alaska (2.4 percent). Except for Alaska, these states had per capita incomes below the U.S. average of $28,542.
In all four slowest growing states, personal income grew at below the U.S. average of 5.4 percent, and except in North Carolina, population either declined or grew at below the U.S. average of 0.9 percent.
for the U.S. and selected States, 199899
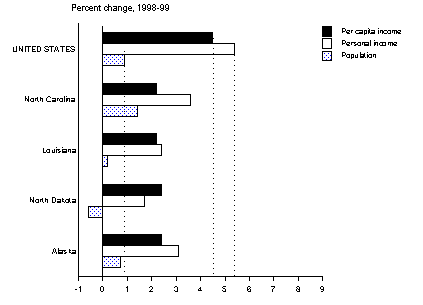
In all of the slowest growing states in 1999, personal income growth was held back by slow growth in net earnings. In North Carolina, a substantial decline in dividends, interest, and rent also contributed to the slow growth in personal income; the decline reflected losses resulting from damage caused by Hurricane Floyd.
Ranking of state per capita income
In 1999, per capita income ranged from $39,300 in Connecticut to $20,688 in Mississippi.
The ranking of states by per capita income changed little between 1998 and 1999. Only Wyoming increased more than two positions in rank, and North Carolina and Louisiana declined more than two positions in rank (see table 4).
The 10 states with the highest per capita incomes in 1999 were:
                                           -----Dollars-----  ----Rank----
                                           1998      1999      1998  1999
                                           -----------------  ------------
                     Connecticut .......    37,452    39,300     1     1
                     Massachusetts .....    33,394    35,551     3     2
                     New Jersey.........    34,310    35,551     2     2
                     New York ..........    32,236    33,890     4     4
                     Maryland ..........    30,850    32,465     5     5
                     Colorado ..........    29,860    31,546     7     6
                     Illinois ..........    29,974    31,145     6     7
                     New Hampshire .....    29,679    31,114     9     8
                     Nevada ............    29,806    31,022     8     9
                     Minnesota .........    29,503    30,793    11    10
                     -----------------------------------------------------
Most of these states had growth rates in per capita income that exceeded the U.S. average of 4.5 percent (table 4).
The 10 states with the lowest per capita incomes in 1999 were:
                                           -----Dollars-----  ----Rank----
                                           1998      1999      1998  1999
                                           -----------------  ------------
                     Kentucky...........    22,353    23,237    40    41
                     Alabama............    22,123    22,987    44    42
                     Oklahoma ..........    22,199    22,953    43    43
                     Louisiana .........    22,352    22,847    41    44
                     Idaho .............    21,923    22,835    45    45
                     Arkansas ..........    21,260    22,244    47    46
                     Montana ...........    21,324    22,019    46    47
                     New Mexico ........    21,178    21,853    48    48
                     West Virginia .....    20,246    20,966    49    49
                     Mississippi .......    20,013    20,688    50    50
                     -----------------------------------------------------
Except for Arkansas, these states had growth rates in per capita income that were below the U.S. average of 4.5 percent.
Revisions
The personal income estimates for the nation and states have been revised for 199799 to incorporate the annual revision of the national income and product accounts (NIPA's) that was released on August 1, 2000 and newly available state source data that are more complete, more detailed, and otherwise more appropriate than data previously available.
Revisions to the estimates of state personal income for 199799 are shown in table 6. For the nation, personal income was revised down 0.2 percent for 1997 and was revised up 0.4 percent for 1998 and 0.1 percent for 1999. For the states, the largest revisions are to the District of Columbia, which was revised up 2.4 percent in 1997, 3.6 percent in 1998, and 4.3 percent in 1999, and to Idaho, which was revised down 0.9 percent in 1997, 0.7 percent in 1998, and 2.6 percent in 1999. For the District of Columbia, upward revisions to dividends, interest, and rent in 199799 contributed to the upward revisions to personal income. For Idaho, downward revisions to dividends, interest, and rent in 199799, plus a downward revision to farm proprietors' income in 1999 contributed to the downward revisions in personal income.
BEA's major national, international, regional, and industry estimates; the Survey of Current Business; and BEA news releases are available without charge on BEA's Web site: www.bea.gov>
STAT-USA maintains an Internet site that contains BEA estimates, the Survey of Current Business, and BEA news releases. For information about STAT-USA, go to www.stat-usa.gov>, or call (202) 482-1986. Subscriptions for single-user unlimited access to STAT-USA's Internet information are $75.00 for 3 months or $175.00 for one year.
Summary BEA estimates are available on recorded messages at the time of public release at the following telephone numbers:
   (202)  606-5306  Gross domestic product
          606-5303  Personal income and outlays
          606-5362  U.S. international transactions
Most of BEA's estimates and analyses appear in the Survey of Current Business, BEA's monthly journal. The printed Survey of Current Business is available from the Superintendent of Documents, U.S. Government Printing Office, Washington, D.C. 20402. First class mail: Annual subscription $120.00 domestic. Second class mail: Annual subscription $48.00 domestic, $60.00 foreign; single issue $17.25 domestic, $21.56 foreign.
State Personal Income, Second Quarter 2000
Table 1.--Per Capita Personal Income, by State and Region, 199599
[Dollars]
-------------------------------------------------------------------------------------------------------------------------------------
Rank of
Percent change percent
1995 1996 1997/r/ 1998/r/ 1999/r/ ---------------------------------------- change in
1995-96 1996-97 1997-98 1998-99 1998-99
-------------------------------------------------------------------------------------------------------------------------------------
United States ............. 23,562 24,651 25,874 27,322 28,542 4.6 5.0 5.6 4.5 ....
New England
Connecticut ........... 31,947 33,472 35,596 37,452 39,300 4.8 6.3 5.2 4.9 10
Maine ................. 20,240 21,293 22,305 23,529 24,603 5.2 4.8 5.5 4.6 17
Massachusetts ......... 28,051 29,618 31,332 33,394 35,551 5.6 5.8 6.6 6.5 1
New Hampshire ......... 25,008 26,042 27,607 29,679 31,114 4.1 6.0 7.5 4.8 13
Rhode Island .......... 24,046 25,123 26,631 28,012 29,377 4.5 6.0 5.2 4.9 11
Vermont ............... 21,359 22,295 23,362 24,803 25,889 4.4 4.8 6.2 4.4 22
Mideast
Delaware .............. 25,391 26,640 27,405 29,571 30,778 4.9 2.9 7.9 4.1 29
District of Columbia .. 33,045 34,401 36,087 37,714 39,858 4.1 4.9 4.5 5.7 ....
Maryland .............. 26,896 27,844 29,222 30,850 32,465 3.5 4.9 5.6 5.2 7
New Jersey ............ 29,277 30,795 32,372 34,310 35,551 5.2 5.1 6.0 3.6 38
New York .............. 27,721 29,266 30,480 32,236 33,890 5.6 4.1 5.8 5.1 8
Pennsylvania .......... 23,738 24,838 26,092 27,358 28,605 4.6 5.0 4.9 4.6 18
Great Lakes
Illinois .............. 25,643 27,005 28,347 29,974 31,145 5.3 5.0 5.7 3.9 33
Indiana ............... 21,845 22,775 23,748 25,182 26,143 4.3 4.3 6.0 3.8 36
Michigan .............. 23,975 24,447 25,570 26,807 28,113 2.0 4.6 4.8 4.9 12
Ohio .................. 22,887 23,613 24,913 26,164 27,152 3.2 5.5 5.0 3.8 37
Wisconsin ............. 22,573 23,554 24,790 26,245 27,390 4.3 5.2 5.9 4.4 25
Plains
Iowa .................. 21,181 22,713 23,798 24,844 25,615 7.2 4.8 4.4 3.1 45
Kansas ................ 21,889 23,121 24,355 25,687 26,824 5.6 5.3 5.5 4.4 21
Minnesota ............. 24,583 26,267 27,548 29,503 30,793 6.9 4.9 7.1 4.4 24
Missouri .............. 22,094 23,099 24,252 25,403 26,376 4.5 5.0 4.7 3.8 35
Nebraska .............. 22,196 24,045 24,590 25,861 27,049 8.3 2.3 5.2 4.6 16
North Dakota .......... 19,084 21,166 20,798 22,767 23,313 10.9 -1.7 9.5 2.4 48
South Dakota .......... 19,848 21,736 22,275 23,797 25,045 9.5 2.5 6.8 5.2 6
Southeast
Alabama ............... 19,683 20,329 21,129 22,123 22,987 3.3 3.9 4.7 3.9 34
Arkansas .............. 18,546 19,442 20,229 21,260 22,244 4.8 4.0 5.1 4.6 14
Florida ............... 23,512 24,616 25,722 26,930 27,780 4.7 4.5 4.7 3.2 44
Georgia ............... 22,230 23,586 24,547 26,134 27,340 6.1 4.1 6.5 4.6 15
Kentucky .............. 19,215 20,155 21,215 22,353 23,237 4.9 5.3 5.4 4.0 32
Louisiana ............. 19,541 20,254 21,209 22,352 22,847 3.6 4.7 5.4 2.2 49
Mississippi ........... 17,185 18,044 18,885 20,013 20,688 5.0 4.7 6.0 3.4 41
North Carolina ........ 21,938 22,940 24,188 25,454 26,003 4.6 5.4 5.2 2.2 50
South Carolina ........ 19,473 20,403 21,385 22,544 23,545 4.8 4.8 5.4 4.4 20
Tennessee ............. 21,800 22,450 23,324 24,576 25,574 3.0 3.9 5.4 4.1 31
Virginia .............. 24,456 25,495 26,768 28,343 29,789 4.2 5.0 5.9 5.1 9
West Virginia ......... 17,913 18,566 19,388 20,246 20,966 3.6 4.4 4.4 3.6 39
Southwest
Arizona ............... 20,634 21,611 22,781 24,133 25,189 4.7 5.4 5.9 4.4 23
New Mexico ............ 18,852 19,478 20,233 21,178 21,853 3.3 3.9 4.7 3.2 43
Oklahoma .............. 19,394 20,151 21,106 22,199 22,953 3.9 4.7 5.2 3.4 40
Texas ................. 21,526 22,557 24,242 25,803 26,858 4.8 7.5 6.4 4.1 28
Rocky Mountain
Colorado .............. 24,865 26,231 27,950 29,860 31,546 5.5 6.6 6.8 5.6 5
Idaho ................. 19,630 20,353 20,830 21,923 22,835 3.7 2.3 5.2 4.2 26
Montana ............... 18,764 19,383 20,167 21,324 22,019 3.3 4.0 5.7 3.3 42
Utah .................. 18,858 19,955 21,156 22,294 23,288 5.8 6.0 5.4 4.5 19
Wyoming ............... 21,514 22,098 23,820 24,927 26,396 2.7 7.8 4.6 5.9 3
Far West
Alaska ................ 25,798 26,057 27,042 27,904 28,577 1.0 3.8 3.2 2.4 47
California ............ 24,496 25,563 26,759 28,280 29,910 4.4 4.7 5.7 5.8 4
Hawaii ................ 25,584 25,661 26,241 26,725 27,544 .3 2.3 1.8 3.1 46
Nevada ................ 25,808 27,142 28,201 29,806 31,022 5.2 3.9 5.7 4.1 30
Oregon ................ 22,668 23,649 24,845 25,958 27,023 4.3 5.1 4.5 4.1 27
Washington ............ 23,878 25,287 26,817 28,632 30,392 5.9 6.1 6.8 6.1 2
BEA regions
New England ............. 27,426 28,820 30,510 32,365 34,173 5.1 5.9 6.1 5.6 1
Mideast ................. 26,856 28,201 29,511 31,161 32,628 5.0 4.6 5.6 4.7 4
Great Lakes ............. 23,703 24,604 25,825 27,224 28,348 3.8 5.0 5.4 4.1 5
Plains .................. 22,363 23,802 24,861 26,282 27,350 6.4 4.4 5.7 4.1 6
Southeast ............... 21,500 22,477 23,518 24,780 25,703 4.5 4.6 5.4 3.7 8
Southwest ............... 20,978 21,946 23,414 24,857 25,862 4.6 6.7 6.2 4.0 7
Rocky Mountain .......... 21,841 22,930 24,259 25,756 27,072 5.0 5.8 6.2 5.1 3
Far West ................ 24,380 25,456 26,671 28,168 29,727 4.4 4.8 5.6 5.5 2
-------------------------------------------------------------------------------------------------------------------------------------
r Revised.
Source: Bureau of Economic Analysis, U.S. Department of Commerce.
Table 2.--Personal Income, by State and Region, 1995-99 [Millions of dollars] ------------------------------------------------------------------------------------------------------------------------------------- Rank of Percent change percent 1995 1996 1997/r/ 1998/r/ 1999/r/ ---------------------------------- change in 1995-96 1996-97 1997-98 1998-99 1998-99 ------------------------------------------------------------------------------------------------------------------------------------- United States ............. 6,192,235 6,538,103 6,928,762 7,383,687 7,783,152 5.6 6.0 6.6 5.4 .... New England Connecticut ........... 104,315 109,354 116,347 122,564 128,983 4.8 6.4 5.3 5.2 21 Maine ................. 25,046 26,434 27,774 29,353 30,828 5.5 5.1 5.7 5.0 27 Massachusetts ......... 170,052 180,237 191,613 205,189 219,533 6.0 6.3 7.1 7.0 5 New Hampshire ......... 28,650 30,228 32,389 35,194 37,372 5.5 7.1 8.7 6.2 9 Rhode Island .......... 23,787 24,818 26,284 27,667 29,107 4.3 5.9 5.3 5.2 22 Vermont ............... 12,449 13,073 13,752 14,648 15,371 5.0 5.2 6.5 4.9 28 Mideast Delaware .............. 18,237 19,369 20,143 22,003 23,192 6.2 4.0 9.2 5.4 18 District of Columbia .. 18,217 18,517 19,081 19,665 20,686 1.6 3.0 3.1 5.2 .... Maryland .............. 135,115 140,809 148,826 158,264 167,895 4.2 5.7 6.3 6.1 10 New Jersey ............ 233,209 246,659 260,727 277,757 289,503 5.8 5.7 6.5 4.2 38 New York .............. 503,163 530,990 553,004 585,372 616,678 5.5 4.1 5.9 5.3 19 Pennsylvania .......... 285,923 299,001 313,523 328,364 343,088 4.6 4.9 4.7 4.5 33 Great Lakes Illinois .............. 304,767 322,790 340,490 361,775 377,744 5.9 5.5 6.3 4.4 36 Indiana ............... 126,525 132,890 139,454 148,767 155,365 5.0 4.9 6.7 4.4 34 Michigan .............. 231,594 238,095 250,211 263,252 277,296 2.8 5.1 5.2 5.3 20 Ohio .................. 255,313 264,162 279,342 294,027 305,643 3.5 5.7 5.3 4.0 41 Wisconsin ............. 115,960 121,864 128,912 137,056 143,811 5.1 5.8 6.3 4.9 29 Plains Iowa .................. 60,171 64,696 67,930 71,080 73,499 7.5 5.0 4.6 3.4 45 Kansas ................ 56,627 60,074 63,721 67,780 71,194 6.1 6.1 6.4 5.0 25 Minnesota ............. 113,217 122,080 129,136 139,442 147,050 7.8 5.8 8.0 5.5 17 Missouri .............. 117,640 123,992 131,131 138,128 144,235 5.4 5.8 5.3 4.4 35 Nebraska .............. 36,293 39,618 40,722 42,949 45,065 9.2 2.8 5.5 4.9 30 North Dakota .......... 12,243 13,607 13,330 14,521 14,773 11.1 -2.0 8.9 1.7 50 South Dakota .......... 14,454 15,883 16,280 17,391 18,361 9.9 2.5 6.8 5.6 16 Southeast Alabama ............... 83,903 87,221 91,283 96,257 100,452 4.0 4.7 5.4 4.4 37 Arkansas .............. 45,995 48,700 51,059 53,962 56,752 5.9 4.8 5.7 5.2 24 Florida ............... 333,525 355,136 377,681 401,474 419,792 6.5 6.3 6.3 4.6 32 Georgia ............... 159,800 172,935 183,762 199,576 212,929 8.2 6.3 8.6 6.7 7 Kentucky .............. 74,080 78,221 82,905 87,945 92,036 5.6 6.0 6.1 4.7 31 Louisiana ............. 84,573 87,879 92,290 97,516 99,887 3.9 5.0 5.7 2.4 49 Mississippi ........... 46,242 48,898 51,589 55,063 57,278 5.7 5.5 6.7 4.0 39 North Carolina ........ 157,634 167,638 179,688 192,070 198,943 6.3 7.2 6.9 3.6 43 South Carolina ........ 72,050 76,287 81,049 86,560 91,490 5.9 6.2 6.8 5.7 15 Tennessee ............. 114,260 119,287 125,449 133,514 140,234 4.4 5.2 6.4 5.0 26 Virginia .............. 161,442 169,938 180,226 192,429 204,736 5.3 6.1 6.8 6.4 8 West Virginia ......... 32,611 33,771 35,200 36,679 37,884 3.6 4.2 4.2 3.3 46 Southwest Arizona ............... 88,870 95,787 103,704 112,635 120,360 7.8 8.3 8.6 6.9 6 New Mexico ............ 31,716 33,232 34,861 36,712 38,020 4.8 4.9 5.3 3.6 44 Oklahoma .............. 63,333 66,289 69,952 74,133 77,077 4.7 5.5 6.0 4.0 40 Texas ................. 402,097 428,726 469,205 508,636 538,345 6.6 9.4 8.4 5.8 13 Rocky Mountain Colorado .............. 92,947 100,012 108,763 118,514 127,955 7.6 8.7 9.0 8.0 2 Idaho ................. 22,869 24,173 25,217 26,986 28,582 5.7 4.3 7.0 5.9 11 Montana ............... 16,297 16,992 17,721 18,755 19,438 4.3 4.3 5.8 3.6 42 Utah .................. 37,278 40,354 43,696 46,831 49,600 8.3 8.3 7.2 5.9 12 Wyoming ............... 10,293 10,609 11,434 11,966 12,660 3.1 7.8 4.6 5.8 14 Far West Alaska ................ 15,513 15,762 16,465 17,167 17,704 1.6 4.5 4.3 3.1 47 California ............ 771,470 812,404 862,114 924,253 991,382 5.3 6.1 7.2 7.3 4 Hawaii ................ 30,202 30,393 31,209 31,815 32,653 .6 2.7 1.9 2.6 48 Nevada ................ 39,377 43,331 47,254 51,976 56,127 10.0 9.1 10.0 8.0 1 Oregon ................ 71,209 75,561 80,578 85,197 89,614 6.1 6.6 5.7 5.2 23 Washington ............ 129,681 139,328 150,283 162,855 174,948 7.4 7.9 8.4 7.4 3 BEA regions New England ............. 364,297 384,144 408,160 434,615 461,194 5.4 6.3 6.5 6.1 3 Mideast ................. 1,193,865 1,255,345 1,315,305 1,391,425 1,461,043 5.1 4.8 5.8 5.0 5 Great Lakes ............. 1,034,159 1,079,799 1,138,409 1,204,878 1,259,859 4.4 5.4 5.8 4.6 8 Plains .................. 410,645 439,948 462,250 491,292 514,176 7.1 5.1 6.3 4.7 7 Southeast ............... 1,366,116 1,445,912 1,532,182 1,633,047 1,712,414 5.8 6.0 6.6 4.9 6 Southwest ............... 586,017 624,034 677,722 732,117 773,803 6.5 8.6 8.0 5.7 4 Rocky Mountain .......... 179,684 192,141 206,831 223,051 238,235 6.9 7.6 7.8 6.8 2 Far West ................ 1,057,453 1,116,779 1,187,903 1,273,263 1,362,427 5.6 6.4 7.2 7.0 1 ------------------------------------------------------------------------------------------------------------------------------------- r Revised. Note: Percent changes are calculated based on unrounded data. Source: Bureau of Economic Analysis, U.S. Department of Commerce.
Table 3.--Population, as of July 1, by State and Region, 1995-99 [Thousands of persons] -------------------------------------------------------------------------------------------------------------------------------- Rank of Percent change percent 1995 1996 1997 1998 1999 ---------------------------------- change in 1995-96 1996-97 1997-98 1998-99 1998-99 -------------------------------------------------------------------------------------------------------------------------------- United States ............. 262,803 265,229 267,784 270,248 272,691 0.9 1.0 0.9 0.9 .... New England Connecticut ........... 3,265 3,267 3,269 3,273 3,282 .1 0 .1 .3 42 Maine ................. 1,237 1,241 1,245 1,248 1,253 .3 .3 .2 .4 34 Massachusetts ......... 6,062 6,085 6,115 6,144 6,175 .4 .5 .5 .5 31 New Hampshire ......... 1,146 1,161 1,173 1,186 1,201 1.3 1.1 1.1 1.3 11 Rhode Island .......... 989 988 987 988 991 -.1 -.1 .1 .3 40 Vermont ............... 583 586 589 591 594 .6 .4 .3 .5 29 Mideast Delaware .............. 718 727 735 744 754 1.2 1.1 1.2 1.3 12 District of Columbia .. 551 538 529 521 519 -2.4 -1.8 -1.4 -.5 .... Maryland .............. 5,024 5,057 5,093 5,130 5,172 .7 .7 .7 .8 19 New Jersey ............ 7,966 8,010 8,054 8,096 8,143 .6 .6 .5 .6 24 New York .............. 18,151 18,144 18,143 18,159 18,197 0 0 .1 .2 44 Pennsylvania .......... 12,045 12,038 12,016 12,002 11,994 -.1 -.2 -.1 -.1 46 Great Lakes Illinois .............. 11,885 11,953 12,012 12,070 12,128 .6 .5 .5 .5 32 Indiana ............... 5,792 5,835 5,872 5,908 5,943 .7 .6 .6 .6 23 Michigan .............. 9,660 9,739 9,785 9,820 9,864 .8 .5 .4 .4 33 Ohio .................. 11,155 11,187 11,212 11,238 11,257 .3 .2 .2 .2 45 Wisconsin ............. 5,137 5,174 5,200 5,222 5,250 .7 .5 .4 .5 28 Plains Iowa .................. 2,841 2,848 2,854 2,861 2,869 .3 .2 .2 .3 41 Kansas ................ 2,587 2,598 2,616 2,639 2,654 .4 .7 .9 .6 25 Minnesota ............. 4,605 4,648 4,688 4,726 4,776 .9 .9 .8 1.0 17 Missouri .............. 5,325 5,368 5,407 5,438 5,468 .8 .7 .6 .6 26 Nebraska .............. 1,635 1,648 1,656 1,661 1,666 .8 .5 .3 .3 39 North Dakota .......... 642 643 641 638 634 .2 -.3 -.5 -.6 50 South Dakota .......... 728 731 731 731 733 .3 0 0 .3 38 Southeast Alabama ............... 4,263 4,290 4,320 4,351 4,370 .6 .7 .7 .4 35 Arkansas .............. 2,480 2,505 2,524 2,538 2,551 1.0 .8 .6 .5 30 Florida ............... 14,185 14,427 14,683 14,908 15,111 1.7 1.8 1.5 1.4 10 Georgia ............... 7,189 7,332 7,486 7,637 7,788 2.0 2.1 2.0 2.0 4 Kentucky .............. 3,855 3,881 3,908 3,934 3,961 .7 .7 .7 .7 21 Louisiana ............. 4,328 4,339 4,351 4,363 4,372 .2 .3 .3 .2 43 Mississippi ........... 2,691 2,710 2,732 2,751 2,769 .7 .8 .7 .6 22 North Carolina ........ 7,185 7,308 7,429 7,546 7,651 1.7 1.7 1.6 1.4 9 South Carolina ........ 3,700 3,739 3,790 3,840 3,886 1.1 1.4 1.3 1.2 15 Tennessee ............. 5,241 5,314 5,378 5,433 5,484 1.4 1.2 1.0 .9 18 Virginia .............. 6,601 6,665 6,733 6,789 6,873 1.0 1.0 .8 1.2 13 West Virginia ......... 1,821 1,819 1,816 1,812 1,807 -.1 -.2 -.2 -.3 48 Southwest Arizona ............... 4,307 4,432 4,552 4,667 4,778 2.9 2.7 2.5 2.4 2 New Mexico ............ 1,682 1,706 1,723 1,734 1,740 1.4 1.0 .6 .4 37 Oklahoma .............. 3,266 3,290 3,314 3,339 3,358 .7 .7 .8 .6 27 Texas ................. 18,680 19,006 19,355 19,712 20,044 1.7 1.8 1.8 1.7 6 Rocky Mountain Colorado .............. 3,738 3,813 3,891 3,969 4,056 2.0 2.1 2.0 2.2 3 Idaho ................. 1,165 1,188 1,211 1,231 1,252 1.9 1.9 1.7 1.7 5 Montana ............... 869 877 879 880 883 .9 .2 .1 .4 36 Utah .................. 1,977 2,022 2,065 2,101 2,130 2.3 2.1 1.7 1.4 8 Wyoming ............... 478 480 480 480 480 .3 0 0 -.1 47 Far West Alaska ................ 601 605 609 615 620 .6 .6 1.0 .7 20 California ............ 31,494 31,781 32,218 32,683 33,145 .9 1.4 1.4 1.4 7 Hawaii ................ 1,180 1,184 1,189 1,190 1,185 .3 .4 .1 -.4 49 Nevada ................ 1,526 1,596 1,676 1,744 1,809 4.6 5.0 4.1 3.8 1 Oregon ................ 3,141 3,195 3,243 3,282 3,316 1.7 1.5 1.2 1.0 16 Washington ............ 5,431 5,510 5,604 5,688 5,756 1.5 1.7 1.5 1.2 14 BEA regions New England ............. 13,283 13,329 13,378 13,429 13,496 .3 .4 .4 .5 6 Mideast ................. 44,454 44,514 44,570 44,653 44,778 .1 .1 .2 .3 8 Great Lakes ............. 43,629 43,888 44,082 44,257 44,442 .6 .4 .4 .4 7 Plains .................. 18,363 18,484 18,593 18,693 18,800 .7 .6 .5 .6 5 Southeast ............... 63,539 64,329 65,150 65,901 66,622 1.2 1.3 1.2 1.1 4 Southwest ............... 27,935 28,434 28,945 29,453 29,920 1.8 1.8 1.8 1.6 2 Rocky Mountain .......... 8,227 8,379 8,526 8,660 8,800 1.9 1.8 1.6 1.6 1 Far West ................ 43,374 43,872 44,539 45,202 45,832 1.1 1.5 1.5 1.4 3 -------------------------------------------------------------------------------------------------------------------------------- Note: Percent changes are calculated based on unrounded data. Source: Bureau of the Census, U.S. Department of Commerce.
Table 4.--Per Capita Personal Income, by State and Region, 1997-99 ---------------------------------------------------------------------------------------------------------------------------------- Dollars Rank in United States Percent of national average Percent ----------------------------- ------------------------ --------------------------- change, 1997/r/ 1998/r/ 1999/r/ 1997 1998 1999 1997 1998 1999 1998-99 ---------------------------------------------------------------------------------------------------------------------------------- United States ............. 25,874 27,322 28,542 .... .... .... 100 100 100 4.5 District of Columbia .. 36,087 37,714 39,858 .... .... .... 139 138 140 5.7 Connecticut ........... 35,596 37,452 39,300 1 1 1 138 137 138 4.9 Massachusetts ......... 31,332 33,394 35,551 3 3 2 121 122 125 6.5 New Jersey ............ 32,372 34,310 35,551 2 2 2 125 126 125 3.6 New York .............. 30,480 32,236 33,890 4 4 4 118 118 119 5.1 Maryland .............. 29,222 30,850 32,465 5 5 5 113 113 114 5.2 Colorado .............. 27,950 29,860 31,546 8 7 6 108 109 111 5.6 Illinois .............. 28,347 29,974 31,145 6 6 7 110 110 109 3.9 New Hampshire ......... 27,607 29,679 31,114 9 9 8 107 109 109 4.8 Nevada ................ 28,201 29,806 31,022 7 8 9 109 109 109 4.1 Minnesota ............. 27,548 29,503 30,793 10 11 10 106 108 108 4.4 Delaware .............. 27,405 29,571 30,778 11 10 11 106 108 108 4.1 Washington ............ 26,817 28,632 30,392 13 12 12 104 105 106 6.1 California ............ 26,759 28,280 29,910 15 14 13 103 104 105 5.8 Virginia .............. 26,768 28,343 29,789 14 13 14 103 104 104 5.1 Rhode Island .......... 26,631 28,012 29,377 16 15 15 103 103 103 4.9 Pennsylvania .......... 26,092 27,358 28,605 18 17 16 101 100 100 4.6 Alaska ................ 27,042 27,904 28,577 12 16 17 105 102 100 2.4 Michigan .............. 25,570 26,807 28,113 20 19 18 99 98 98 4.9 Florida ............... 25,722 26,930 27,780 19 18 19 99 99 97 3.2 Hawaii ................ 26,241 26,725 27,544 17 20 20 101 98 97 3.1 Wisconsin ............. 24,790 26,245 27,390 23 21 21 96 96 96 4.4 Georgia ............... 24,547 26,134 27,340 25 23 22 95 96 96 4.6 Ohio .................. 24,913 26,164 27,152 21 22 23 96 96 95 3.8 Nebraska .............. 24,590 25,861 27,049 24 25 24 95 95 95 4.6 Oregon ................ 24,845 25,958 27,023 22 24 25 96 95 95 4.1 Texas ................. 24,242 25,803 26,858 28 26 26 94 94 94 4.1 Kansas ................ 24,355 25,687 26,824 26 27 27 94 94 94 4.4 Wyoming ............... 23,820 24,927 26,396 30 31 28 92 91 92 5.9 Missouri .............. 24,252 25,403 26,376 27 29 29 94 93 92 3.8 Indiana ............... 23,748 25,182 26,143 32 30 30 92 92 92 3.8 North Carolina ........ 24,188 25,454 26,003 29 28 31 93 93 91 2.2 Vermont ............... 23,362 24,803 25,889 33 33 32 90 91 91 4.4 Iowa .................. 23,798 24,844 25,615 31 32 33 92 91 90 3.1 Tennessee ............. 23,324 24,576 25,574 34 34 34 90 90 90 4.1 Arizona ............... 22,781 24,133 25,189 35 35 35 88 88 88 4.4 South Dakota .......... 22,275 23,797 25,045 37 36 36 86 87 88 5.2 Maine ................. 22,305 23,529 24,603 36 37 37 86 86 86 4.6 South Carolina ........ 21,385 22,544 23,545 38 39 38 83 83 82 4.4 North Dakota .......... 20,798 22,767 23,313 45 38 39 80 83 82 2.4 Utah .................. 21,156 22,294 23,288 41 42 40 82 82 82 4.5 Kentucky .............. 21,215 22,353 23,237 39 40 41 82 82 81 4.0 Alabama ............... 21,129 22,123 22,987 42 44 42 82 81 81 3.9 Oklahoma .............. 21,106 22,199 22,953 43 43 43 82 81 80 3.4 Louisiana ............. 21,209 22,352 22,847 40 41 44 82 82 80 2.2 Idaho ................. 20,830 21,923 22,835 44 45 45 81 80 80 4.2 Arkansas .............. 20,229 21,260 22,244 47 47 46 78 78 78 4.6 Montana ............... 20,167 21,324 22,019 48 46 47 78 78 77 3.3 New Mexico ............ 20,233 21,178 21,853 46 48 48 78 78 77 3.2 West Virginia ......... 19,388 20,246 20,966 49 49 49 75 74 73 3.6 Mississippi ........... 18,885 20,013 20,688 50 50 50 73 73 72 3.4 BEA regions New England ............. 30,510 32,365 34,173 1 1 1 118 118 120 5.6 Mideast ................. 29,511 31,161 32,628 2 2 2 114 114 114 4.7 Far West ................ 26,671 28,168 29,727 3 3 3 103 103 104 5.5 Great Lakes ............. 25,825 27,224 28,348 4 4 4 100 100 99 4.1 Plains .................. 24,861 26,282 27,350 5 5 5 96 96 96 4.1 Rocky Mountain .......... 24,259 25,756 27,072 6 6 6 94 94 95 5.1 Southwest ............... 23,414 24,857 25,862 8 7 7 90 91 91 4.0 Southeast ............... 23,518 24,780 25,703 7 8 8 91 91 90 3.7 ---------------------------------------------------------------------------------------------------------------------------------- r Revised. Note: States and regions listed based on their rank in per capita income in 1999. Source: Bureau of Economic Analysis, U.S. Department of Commerce.
Table 5. -- Personal Income by Component, by State and Region, 1998-99 ----------------------------------------------------------------------------------------------------------------------------------------- Contribution to percent Percent change change in personal income Dollar change (millions) ----------------------------------- (percentage points) ------------------------------------ ------------------------- Divi- Percent Divi- Divi- dends, Trans- change in dends, Trans- dends, Trans- Personal Net inter- fer personal Net inter- fer Personal Net inter- fer income earn- est, pay- income earn- est, pay- income earn- est, pay- ings/1/ and ments ings/1/ and ments ings/1/ and ments rent rent rent ----------------------------------------------------------------------------------------------------------------------------------------- United States ............. 5.4 6.4 3.5 3.4 5.4 4.28 .68 .45 399,465 316,211 50,016 33,238 New England Connecticut ........... 5.2 6.1 3.8 2.4 5.2 4.27 .70 .27 6,419 5,230 855 334 Maine ................. 5.0 6.5 2.9 2.1 5.0 4.10 .56 .36 1,475 1,203 164 107 Massachusetts ......... 7.0 8.2 5.3 2.9 7.0 5.64 .97 .38 14,344 11,578 1,990 777 New Hampshire ......... 6.2 6.7 6.3 2.8 6.2 4.68 1.20 .30 2,178 1,649 422 108 Rhode Island .......... 5.2 5.4 6.2 3.3 5.2 3.43 1.22 .55 1,440 950 338 152 Vermont ............... 4.9 6.5 -.2 5.6 4.9 4.19 -.05 .79 723 614 -7 116 Mideast Delaware .............. 5.4 6.0 5.0 2.8 5.4 4.06 1.01 .34 1,189 893 222 74 District of Columbia .. 5.2 5.9 5.4 1.2 5.2 3.93 1.10 .16 1,021 774 216 32 Maryland .............. 6.1 6.8 4.5 3.8 6.1 4.83 .86 .39 9,631 7,650 1,360 621 New Jersey ............ 4.2 5.5 .8 2.0 4.2 3.86 .14 .23 11,746 10,723 396 628 New York .............. 5.3 6.6 2.4 3.5 5.3 4.34 .44 .57 31,306 25,411 2,575 3,320 Pennsylvania .......... 4.5 4.9 3.6 4.0 4.5 3.16 .68 .64 14,724 10,390 2,226 2,108 Great Lakes Illinois .............. 4.4 5.5 2.8 1.0 4.4 3.73 .56 .12 15,969 13,510 2,030 428 Indiana ............... 4.4 4.6 4.2 3.7 4.4 3.17 .79 .48 6,598 4,713 1,168 717 Michigan .............. 5.3 5.6 3.7 6.3 5.3 3.80 .69 .84 14,044 10,015 1,821 2,209 Ohio .................. 4.0 4.3 4.4 1.8 4.0 2.83 .86 .25 11,616 8,334 2,537 744 Wisconsin ............. 4.9 5.3 4.6 3.3 4.9 3.58 .93 .41 6,755 4,912 1,279 563 Plains Iowa .................. 3.4 3.4 4.0 2.4 3.4 2.23 .84 .33 2,419 1,585 599 235 Kansas ................ 5.0 5.5 4.2 3.8 5.0 3.71 .85 .47 3,414 2,516 577 320 Minnesota ............. 5.5 6.2 4.1 3.5 5.5 4.19 .88 .39 7,608 5,837 1,227 545 Missouri .............. 4.4 4.9 3.6 3.6 4.4 3.14 .75 .53 6,107 4,338 1,036 733 Nebraska .............. 4.9 5.4 4.3 3.8 4.9 3.57 .88 .48 2,116 1,532 377 206 North Dakota .......... 1.7 .1 6.6 1.8 1.7 .05 1.39 .29 252 8 202 42 South Dakota .......... 5.6 6.4 5.4 2.3 5.6 4.02 1.24 .33 970 699 215 57 Southeast Alabama ............... 4.4 4.8 4.2 3.0 4.4 3.11 .75 .49 4,195 2,998 722 476 Arkansas .............. 5.2 5.7 6.0 2.4 5.2 3.61 1.12 .43 2,790 1,950 606 234 Florida ............... 4.6 6.1 2.8 1.8 4.6 3.52 .76 .28 18,318 14,150 3,038 1,131 Georgia ............... 6.7 7.9 4.0 3.3 6.7 5.62 .69 .38 13,353 11,217 1,384 751 Kentucky .............. 4.7 5.2 4.4 3.0 4.7 3.32 .83 .51 4,091 2,916 729 446 Louisiana ............. 2.4 2.1 3.8 2.5 2.4 1.34 .66 .43 2,371 1,309 644 417 Mississippi ........... 4.0 4.2 5.1 2.5 4.0 2.72 .83 .46 2,215 1,500 459 255 North Carolina ........ 3.6 6.0 -5.1 4.2 3.6 4.00 -.99 .57 6,873 7,675 -1,903 1,102 South Carolina ........ 5.7 6.1 5.4 4.4 5.7 4.02 1.00 .67 4,930 3,483 863 584 Tennessee ............. 5.0 5.4 4.2 4.3 5.0 3.68 .69 .67 6,720 4,911 920 890 Virginia .............. 6.4 7.3 4.4 3.9 6.4 5.18 .83 .38 12,307 9,973 1,603 730 West Virginia ......... 3.3 3.3 5.8 1.2 3.3 1.98 1.03 .28 1,205 726 378 101 Southwest Arizona ............... 6.9 7.6 5.4 5.2 6.9 5.08 1.08 .71 7,725 5,717 1,212 796 New Mexico ............ 3.6 3.6 2.9 4.4 3.6 2.32 .57 .67 1,308 851 210 247 Oklahoma .............. 4.0 4.6 1.9 3.7 4.0 3.04 .35 .58 2,944 2,251 263 431 Texas ................. 5.8 6.9 3.0 3.3 5.8 4.97 .48 .39 29,709 25,296 2,447 1,966 Rocky Mountain Colorado .............. 8.0 9.2 4.9 4.4 8.0 6.64 .93 .40 9,441 7,865 1,100 476 Idaho ................. 5.9 7.3 2.7 3.8 5.9 4.89 .53 .50 1,596 1,319 143 134 Montana ............... 3.6 5.2 2.9 -1.0 3.6 3.12 .69 -.17 683 586 128 -31 Utah .................. 5.9 6.3 5.7 3.4 5.9 4.56 1.00 .35 2,769 2,135 470 165 Wyoming ............... 5.8 6.7 5.2 2.6 5.8 4.11 1.36 .32 694 493 163 38 Far West Alaska ................ 3.1 1.5 4.7 8.9 3.1 1.02 .84 1.27 537 174 144 218 California ............ 7.3 8.6 4.2 4.3 7.3 5.94 .81 .51 67,129 54,927 7,465 4,737 Hawaii ................ 2.6 2.5 2.9 3.0 2.6 1.72 .56 .36 838 546 177 115 Nevada ................ 8.0 9.3 5.7 4.6 8.0 6.21 1.31 .48 4,151 3,226 679 248 Oregon ................ 5.2 5.8 3.3 5.2 5.2 3.72 .76 .70 4,417 3,171 645 599 Washington ............ 7.4 8.7 4.8 4.1 7.4 6.01 .92 .50 12,093 9,783 1,501 809 BEA regions New England ............. 6.1 7.1 4.6 2.8 6.1 4.88 .87 .37 26,579 21,223 3,762 1,593 Mideast ................. 5.0 6.0 2.7 3.4 5.0 4.01 .50 .49 69,618 55,840 6,997 6,782 Great Lakes ............. 4.6 5.1 3.7 3.0 4.6 3.44 .73 .39 54,981 41,484 8,835 4,662 Plains .................. 4.7 5.1 4.1 3.3 4.7 3.36 .86 .44 22,884 16,514 4,233 2,138 Southeast ............... 4.9 5.9 2.9 3.0 4.9 3.85 .58 .44 79,367 62,809 9,443 7,115 Southwest ............... 5.7 6.6 3.3 3.7 5.7 4.66 .56 .47 41,686 34,115 4,131 3,440 Rocky Mountain .......... 6.8 8.0 4.6 3.3 6.8 5.56 .90 .35 15,184 12,398 2,004 782 Far West ................ 7.0 8.2 4.3 4.4 7.0 5.64 .83 .53 89,164 71,827 10,611 6,726 ----------------------------------------------------------------------------------------------------------------------------------------- 1. Net earnings is earnings by place of work--the sum of wage and salary disbursements (payrolls), other labor income, and proprietors' income--less personal contributions for social insurance plus an adjustment to convert earnings by place of work to a place-of-residence basis. Note: Estimates may not add to totals because of rounding. Percent changes are calculated based on unrounded data. Source: Bureau of Economic Analysis, U.S. Department of Commerce.
Table 6.--Revisions to Personal Income for States and Regions for 1997-99 (Millions of dollars) -------------------------------------------------------------------------------------------------- Revised Percent revision -------------------------------------- -------------------------- 1997 1998 1999 1997 1998 1999 -------------------------------------------------------------------- United States .............. 6,928,762 7,383,687 7,783,152 -0.2 0.4 0.1 New England .............. 408,160 434,615 461,194 -.5 0 -.3 Connecticut ............ 116,347 122,564 128,983 -.1 .3 .3 Maine .................. 27,774 29,353 30,828 -.4 .1 -1.4 Massachusetts .......... 191,613 205,189 219,533 -.8 -.3 -.5 New Hampshire .......... 32,389 35,194 37,372 -.5 .7 .7 Rhode Island ........... 26,284 27,667 29,107 -.8 -.9 -1.2 Vermont ................ 13,752 14,648 15,371 -.1 .8 0 Mideast ................. 1,315,305 1,391,425 1,461,043 -.3 .2 -.3 Delaware ............... 20,143 22,003 23,192 -.7 .6 .3 District of Columbia ... 19,081 19,665 20,686 2.4 3.6 4.3 Maryland ............... 148,826 158,264 167,895 .4 1.0 .9 New Jersey ............. 260,727 277,757 289,503 -.6 -.2 -1.5 New York ............... 553,004 585,372 616,678 -.2 .4 -.2 Pennsylvania ........... 313,523 328,364 343,088 -.5 -.4 -.2 Great Lakes .............. 1,138,409 1,204,878 1,259,859 -.5 .1 .2 Illinois ............... 340,490 361,775 377,744 -.4 .4 -.4 Indiana ................ 139,454 148,767 155,365 -.7 .1 .2 Michigan ............... 250,211 263,252 277,296 -.8 -.3 1.0 Ohio ................... 279,342 294,027 305,643 -.3 .4 .3 Wisconsin .............. 128,912 137,056 143,811 -.6 -.1 -.1 Plains ................... 462,250 491,292 514,176 -.3 .6 .2 Iowa ................... 67,930 71,080 73,499 -.4 .4 -.4 Kansas ................. 63,721 67,780 71,194 -.2 .6 .7 Minnesota .............. 129,136 139,442 147,050 0 .8 .6 Missouri ............... 131,131 138,128 144,235 -.5 1.0 .7 Nebraska................ 40,722 42,949 45,065 -.7 -.2 -1.4 North Dakota ........... 13,330 14,521 14,773 -.4 -.5 -.9 South Dakota ........... 16,280 17,391 18,361 -.6 .3 -.2 Southeast ................ 1,532,182 1,633,047 1,712,414 -.1 .7 0 Alabama ................ 91,283 96,257 100,452 -.6 .3 .2 Arkansas ............... 51,059 53,962 56,752 -.6 .4 .6 Florida ................ 377,681 401,474 419,792 .3 .3 -.9 Georgia ................ 183,762 199,576 212,929 -.2 1.1 .5 Kentucky ............... 82,905 87,945 92,036 -.3 .8 .3 Louisiana .............. 92,290 97,516 99,887 -.2 .7 .2 Mississippi ............ 51,589 55,063 57,278 .1 1.2 .9 North Carolina ......... 179,688 192,070 198,943 -.1 1.1 -.8 South Carolina ......... 81,049 86,560 91,490 -.1 .8 .2 Tennessee .............. 125,449 133,514 140,234 -.5 .6 0 Virginia ............... 180,226 192,429 204,736 -.2 1.0 1.0 West Virginia .......... 35,200 36,679 37,884 -.1 .3 .4 Southwest ................ 677,722 732,117 773,803 .7 1.2 .8 Arizona ................ 103,704 112,635 120,360 -.3 -.3 -.5 New Mexico ............. 34,861 36,712 38,020 -.3 .1 -1.0 Oklahoma ............... 69,952 74,133 77,077 .1 1.1 .7 Texas .................. 469,205 508,636 538,345 1.0 1.7 1.3 Rocky Mountain ........... 206,831 223,051 238,235 -.3 -.1 -.6 Colorado ............... 108,763 118,514 127,955 -.4 -.4 -.4 Idaho .................. 25,217 26,986 28,582 -.9 -.7 -2.6 Montana ................ 17,721 18,755 19,438 .2 .4 -1.3 Utah ................... 43,696 46,831 49,600 -.2 .2 -.3 Wyoming ................ 11,434 11,966 12,660 .9 2.5 1.5 Far West ................. 1,187,903 1,273,263 1,362,427 -.2 .4 .3 Alaska ................. 16,465 17,167 17,704 .2 .3 .2 California ............. 862,114 924,253 991,382 -.1 .4 .3 Hawaii ................. 31,209 31,815 32,653 -.2 -.1 -1.1 Nevada ................. 47,254 51,976 56,127 -.1 2.1 2.2 Oregon ................. 80,578 85,197 89,614 -.6 .2 -.4 Washington ............. 150,283 162,855 174,948 -.7 -.3 .3 ----------------------------------------------------------------------------------------------------- Source: Bureau of Economic Analysis, U.S. Department of Commerce.