
News Release
U.S. International Transactions, First Quarter 2021 and Annual Update
Current Account Deficit Widens by 11.8 Percent in First Quarter
Current Account Balance, First Quarter
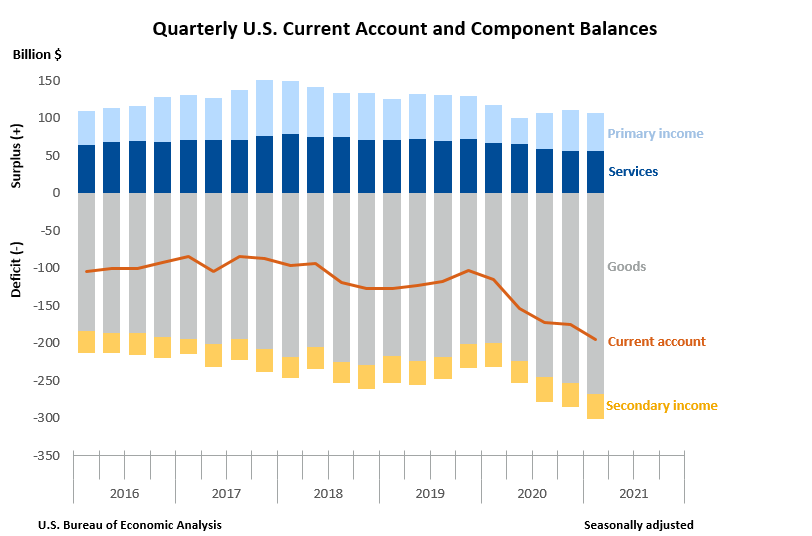
The U.S. current account deficit, which reflects the combined balances on trade in goods and services and income flows between U.S. residents and residents of other countries, widened by $20.7 billion, or 11.8 percent, to $195.7 billion in the first quarter of 2021, according to statistics from the U.S. Bureau of Economic Analysis (BEA). The revised fourth quarter deficit was $175.1 billion.
The first quarter deficit was 3.6 percent of current dollar gross domestic product, up from 3.3 percent in the fourth quarter.
The $20.7 billion widening of the current account deficit in the first quarter mostly reflected an increased deficit on goods and a reduced surplus on primary income.
Current Account Transactions (tables 1-5)
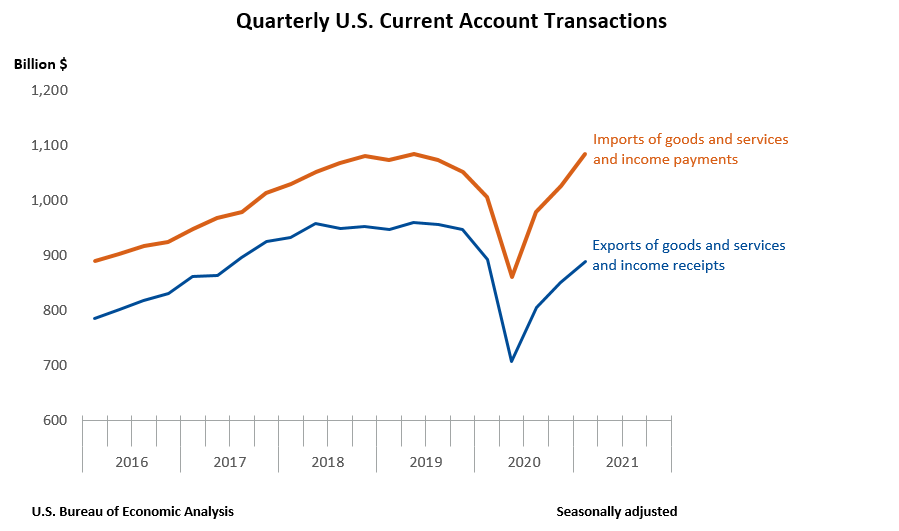
Exports of goods and services to, and income received from, foreign residents increased $36.8 billion, to $888.7 billion, in the first quarter. Imports of goods and services from, and income paid to, foreign residents increased $57.5 billion, to $1.08 trillion.
Trade in Goods (table 2)
Exports of goods increased $24.5 billion, to $408.6 billion, and imports of goods increased $39.9 billion, to $677.0 billion. The increases in both exports and imports reflected increases in nearly all major categories, led by industrial supplies and materials, primarily petroleum and products, that were partly offset by a decrease in automotive vehicles, parts, and engines.
Trade in Services (table 3)
Exports of services increased $1.1 billion, to $175.9 billion, reflecting mostly offsetting changes in several major categories. Increases were led by travel, mainly other personal travel; decreases were led by charges for the use of intellectual property, mainly for licenses to reproduce and/or distribute computer software. Imports of services increased $1.8 billion, to $120.2 billion, mostly reflecting an increase in transport, primarily sea freight transport.
Primary Income (table 4)
Receipts of primary income increased $9.6 billion, to $261.7 billion, mostly reflecting an increase in direct investment income, primarily earnings. Payments of primary income increased $13.5 billion, to $211.4 billion, mainly reflecting increases in direct investment income, mostly earnings, and in portfolio investment income, mostly interest on long-term debt securities.
Secondary Income (table 5)
Receipts of secondary income increased $1.6 billion, to $42.6 billion, mostly reflecting an increase in general government transfers, primarily public sector fines and penalties. Payments of secondary income increased $2.3 billion, to $75.9 billion, mainly reflecting an increase in general government transfers, primarily international cooperation.
Capital Account Transactions (table 1)
Capital transfer payments increased $1.6 billion, to $2.8 billion in the first quarter, mostly reflecting an increase in investment grants.
Financial Account Transactions (tables 1, 6, 7, and 8)
Net financial account transactions were −$175.2 billion in the first quarter, reflecting net U.S. borrowing from foreign residents.
Financial Assets (tables 1, 6, 7, and 8)
First quarter transactions increased U.S. residents’ foreign financial assets by $382.0 billion. Transactions increased portfolio investment assets, primarily long-term debt securities, by $304.7 billion; direct investment assets, primarily equity, by $64.0 billion; and other investment assets, primarily loans, by $15.4 billion. Transactions decreased reserve assets by $2.1 billion.
Liabilities (tables 1, 6, 7, and 8)
First quarter transactions increased U.S. liabilities to foreign residents by $554.9 billion. Transactions increased portfolio investment liabilities, primarily long-term debt securities, by $326.5 billion; other investment liabilities, primarily deposits and loans, by $163.9 billion; and direct investment liabilities, primarily equity, by $64.5 billion.
Financial Derivatives (table 1)
Net transactions in financial derivatives were −$2.3 billion in the first quarter, reflecting net U.S. borrowing from foreign residents.
|
Updates to Fourth Quarter 2020 International Transactions Accounts Balances Billions of dollars, seasonally adjusted |
||
| Preliminary estimate | Revised estimate | |
|---|---|---|
| Current account balance | −188.5 | −175.1 |
| Goods balance | −253.0 | −253.1 |
| Services balance | 53.0 | 56.3 |
| Primary income balance | 47.9 | 54.2 |
| Secondary income balance | −36.4 | −32.5 |
| Net financial account transactions | −262.4 | −271.2 |
Annual Update of the International Transactions Accounts (table 9)
The statistics in this release reflect the annual update of the U.S. international transactions accounts. With this update, BEA has incorporated newly available and revised source data for 2018–2020 and updated seasonal adjustments for 2016–2020 for most statistical series. The major exceptions are 1) direct investment positions, transactions in financial assets and liabilities, and related income receipts and payments for 2017–2020, which are revised to incorporate the results of BEA's 2017 Benchmark Survey of Foreign Direct Investment in the United States, and 2) insurance services exports and imports and insurance-related transfers in secondary income receipts and payments for 2013–2020, which are revised to incorporate the results of BEA's 2018 Benchmark Survey of Insurance Transactions by U.S. Insurance Companies with Foreign Persons.
Newly Available and Revised Source Data: Key Providers and Years Affected
| Agency | Data | Years affected |
|---|---|---|
| BEA | Benchmark and quarterly insurance services surveys | 2013–2020 |
| Benchmark, annual, and quarterly direct investment surveys | 2017–2020 | |
| Quarterly international services surveys | 2018–2020 | |
| U.S. Census Bureau | Revised source data for Census-basis goods | 2018–2020 |
| U.S. Department of the Treasury | Annual portfolio investment surveys | 2019–2020 |
| Quarterly and monthly portfolio and other investment surveys | 2017–2020 |
More information is available in “Preview of the 2021 Annual Update of the International Economic Accounts” in the April 2021 issue of the Survey of Current Business, and additional information will be provided in the July issue. An updated and expanded version of the U.S. International Economic Accounts: Concepts and Methods will be available in July 2021.
* * *
Next release: September 21, 2021 at 8:30 A.M. EDT
U.S. International Transactions, Second Quarter 2021
* * *