
News Release
Gross Domestic Product, 2nd Quarter 2025 (Second Estimate) and Corporate Profits (Preliminary)
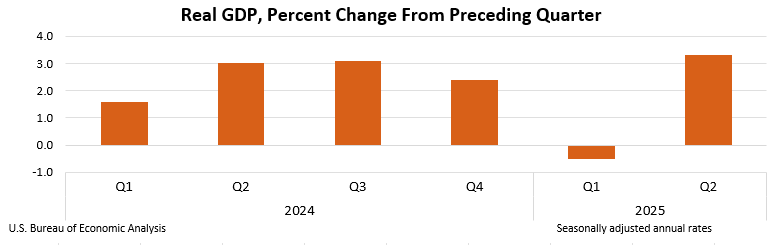
Real gross domestic product (GDP) increased at an annual rate of 3.3 percent in the second quarter of 2025 (April, May, and June), according to the second estimate released by the U.S. Bureau of Economic Analysis. In the first quarter, real GDP decreased 0.5 percent.
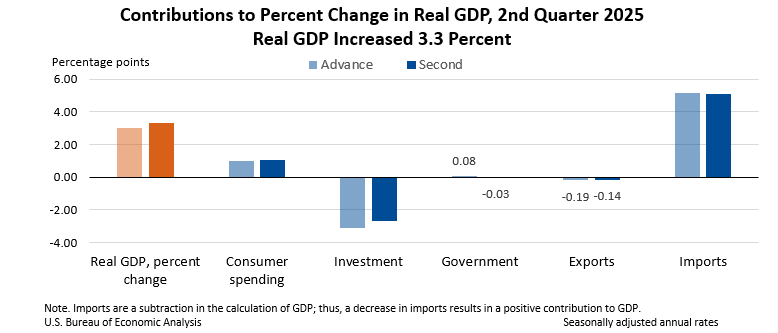
The increase in real GDP in the second quarter primarily reflected a decrease in imports, which are a subtraction in the calculation of GDP, and an increase in consumer spending. These movements were partly offset by decreases in investment and exports.
Real GDP was revised up 0.3 percentage point from the advance estimate, primarily reflecting upward revisions to investment and consumer spending that were partly offset by a downward revision to government spending and an upward revision to imports. For more information, refer to the “Technical Notes” below.
Compared to the first quarter, the upturn in real GDP in the second quarter primarily reflected a downturn in imports and an acceleration in consumer spending that were partly offset by a downturn in investment.
Real final sales to private domestic purchasers, the sum of consumer spending and gross private fixed investment, increased 1.9 percent in the second quarter, revised up 0.7 percentage point from the previous estimate.
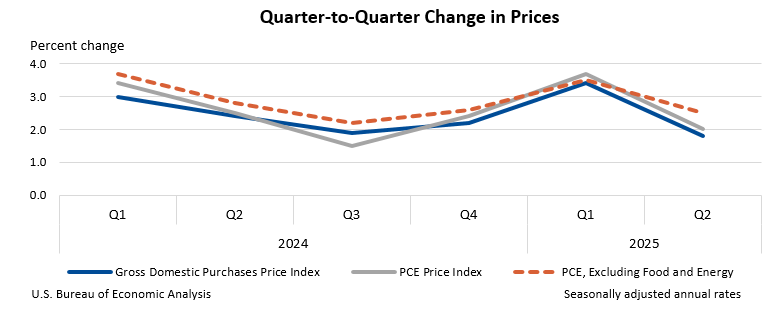
The price index for gross domestic purchases increased 1.8 percent in the second quarter, revised down 0.1 percentage point from the previous estimate. The personal consumption expenditures (PCE) price index increased 2.0 percent, revised down 0.1 percentage point from the previous estimate. Excluding food and energy prices, the PCE price index increased 2.5 percent, the same as previously estimated.
Real gross domestic income (GDI) increased 4.8 percent in the second quarter, compared with an increase of 0.2 percent in the first quarter. The average of real GDP and real GDI increased 4.0 percent, in contrast to a decrease of 0.1 percent in the first quarter.
Profits from current production (corporate profits with inventory valuation and capital consumption adjustments) increased $65.5 billion in the second quarter, in contrast to a decrease of $90.6 billion in the first quarter.
| Real GDP and Related Measures (Percent change from Q1 to Q2) | ||
|---|---|---|
| Advance Estimate | Second Estimate | |
| Real GDP | 3.0 | 3.3 |
| Current-dollar GDP | 5.0 | 5.3 |
| Real final sales to private domestic purchasers | 1.2 | 1.9 |
| Real GDI | … | 4.8 |
| Average of real GDP and real GDI | … | 4.0 |
| Gross domestic purchases price index | 1.9 | 1.8 |
| PCE price index | 2.1 | 2.0 |
| PCE price index excluding food and energy | 2.5 | 2.5 |
First Quarter Wages and Salaries
BEA’s standard practice for first-quarter estimates of wages and salaries is to incorporate data from the Bureau of Labor Statistics’ Quarterly Census of Employment and Wages (QCEW) program as part of the annual update of the National Economic Accounts. New QCEW data for the first quarter of 2025 will be incorporated in next month’s release along with the 2025 Annual Update of the National Economic Accounts (refer to box below for details).
BEA will begin releasing results from the 2025 annual update of the National Economic Accounts, which include the National Income and Product Accounts as well as the Industry Economic Accounts, on September 25, 2025. The update will present revised statistics for GDP, GDP by Industry, and GDI. For details, refer to Information on 2025 Annual Updates to the National, Industry, and State and Local Economic Accounts .
Next release:
September 25, 2025, at 8:30 a.m. EDT
Gross Domestic Product 2nd Quarter 2025 (Third Estimate)
GDP by Industry, and Corporate Profits (Revised)
Technical Notes
Sources of revisions to real GDP in the second estimate
Real GDP increased at an annual rate of 3.3 percent (0.8 percent at a quarterly rate ), an upward revision of 0.3 percentage point from the previous estimate, primarily reflecting upward revisions to investment and consumer spending that were partly offset by a downward revision to government spending and an upward revision to imports.
- Within investment, upward revisions to intellectual property products, equipment, and structures were partly offset by a downward revision to private inventory investment.
- The revision to intellectual property products reflected upward revisions to software, based on new Census Bureau Quarterly Services Survey data, and to research and development, based on newly available R&D expenses reported by publicly traded companies.
- The revision to equipment was led by transportation equipment (specifically, light trucks), based on new June IHS-Polk registrations data.
- The revision to structures was led by commercial and health care, based primarily on new June and revised April and May Census Bureau Value Put in Place construction spending data.
- Within private inventory investment, the revision primarily reflected a downward revision to nonfarm inventories (led by wholesale trade inventories), based primarily on revised Census Bureau book value data.
- The upward revision to consumer spending reflected upward revisions to both goods (notably, pharmaceutical products) and services (notably, health care as well as food services and accommodations).
- Within government, compensation was revised down, primarily reflecting revised BLS Current Employment Statistics data for state and local government.
- For both exports and imports, the revised estimates primarily reflected updated data from BEA’s International Transactions Accounts as well as new and revised Census Bureau trade in goods data for June.
- Within exports, the upward revision was to goods, led by industrial supplies and materials (notably, petroleum and products).
- Within imports, the upward revision was to goods, led by industrial supplies and materials as well as capital goods, except automotive.
More information on the source data and BEA assumptions that underlie the second-quarter estimate is shown in the key source data and assumptions table.
1 Percent changes in quarterly seasonally adjusted series are displayed at annual rates, unless otherwise specified. For more information, refer to the FAQ "Why does BEA publish percent changes in quarterly series at annual rates?".