
News Release
Marine Economy Satellite Account, 2023
New Statistics for 2023; 2014–2022 Updated
The Marine Economy Satellite Account statistics released today by the U.S. Bureau of Economic Analysis show the marine economy accounted for $511.0 billion, or 1.8 percent, of current-dollar U.S. gross domestic product in 2023, an increase from $482.4 billion in 2022 (tables 2 and 3). The marine economy accounted for $826.6 billion, or 1.7 percent, of current-dollar gross output in 2023 (table 8).
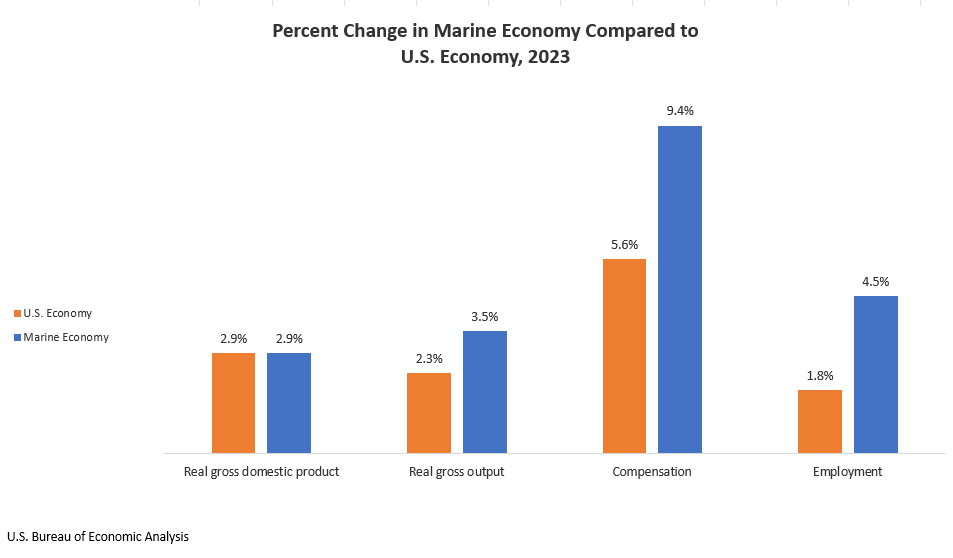
Real (inflation-adjusted) gross domestic product (GDP) for the marine economy increased 2.9 percent from 2022 to 2023 (table 1), compared with a 2.9 percent increase for the overall U.S. economy. Marine economy compensation increased 9.4 percent, or $19.1 billion, and employment increased 4.5 percent, or 111,000 full- and part-time employees.
Today’s release also reflects updated statistics for 2014–2022. Gross output, value added, employment, and compensation were updated to include the results of the 2023 comprehensive update and the 2024 annual update of the National Economic Accounts, which includes the Industry Economic Accounts. The updated statistics reflect newly available and revised source data.
Marine economy by activity
To estimate the marine economy by activity, this satellite account reorganizes industry value added (or GDP) and gross output statistics and presents the data in a framework that reflects marine-related activities. Marine economy activities fall into the following 10 general categories:
- Living resources, marine
- Construction, coastal and marine
- Research and education, marine
- Transportation and warehousing, marine
- Professional and technical services, marine
- Minerals, offshore
- Utilities, coastal
- Ship and boat building, nonrecreational
- Tourism and recreation, coastal and offshore
- National defense and public administration
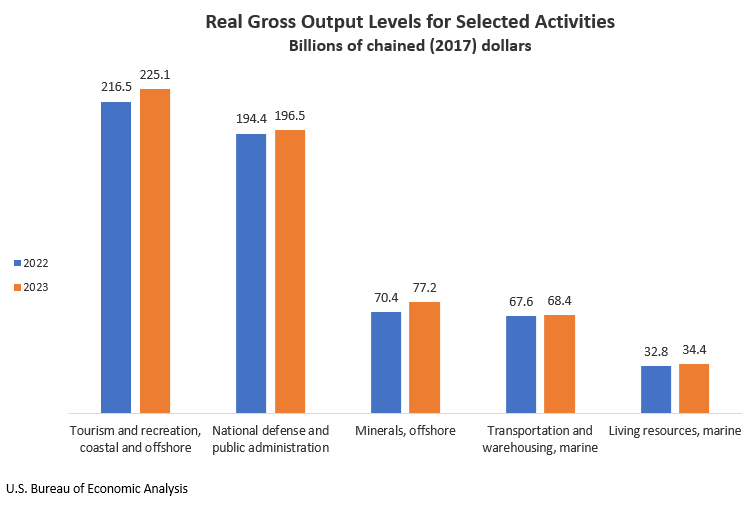
Marine economy real gross output—principally a measure of the marine economy's inflation-adjusted sales or receipts, which includes sales to final users in the economy (GDP) and sales to other industries (intermediate inputs)—increased 3.5 percent, or $22.7 billion, in 2023 (tables 7 and 9). Marine economy activity highlights for 2023 include the following:
- Tourism and recreation, coastal and offshore increased $8.6 billion, or 4.0 percent, to a level of $225.1 billion, making it the largest contributor to the growth in 2023 marine economy real gross output.
- Minerals, offshore increased $6.8 billion, or 9.6 percent, to $77.2 billion, making it the second-largest contributor to the overall growth.
- Living resources, marine increased $1.7 billion, or 5.1 percent, to $34.4 billion.
- Ship and boat building, nonrecreational decreased $68 million, or 0.3 percent, to $19.5 billion, making it the largest offset to the overall growth in 2023 marine economy real gross output.
Marine economy by industry
Industry statistics show the contributions of industries to the marine economy, including their impact on value added (or GDP by industry), gross output, employment, and compensation.
Marine economy industry highlights for 2023 include the following:
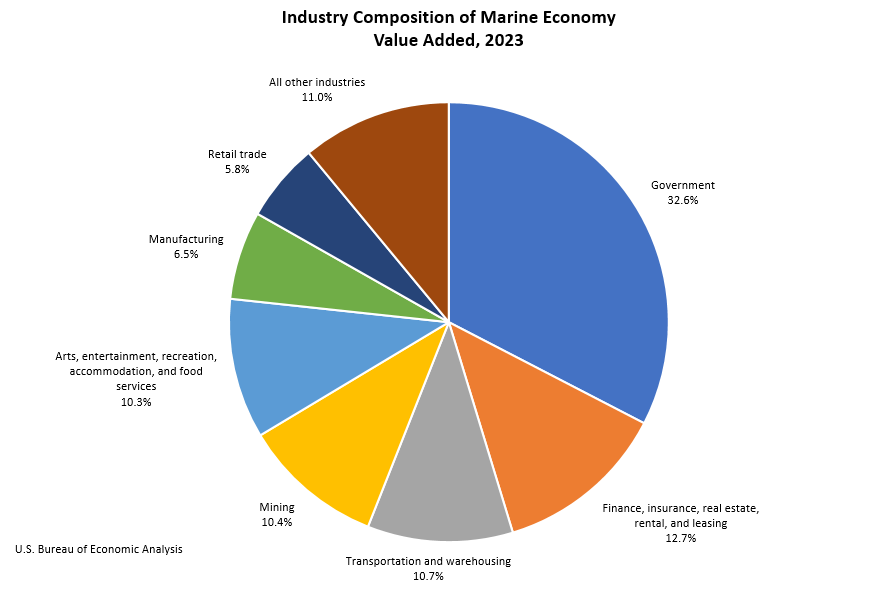
- Government, as a share of marine economy current-dollar value added, was the largest industry group and accounted for 32.6 percent, or $166.4 billion (table 6), and was the largest industry group for compensation ($101.3 billion) and for employment (about 793,000 full- and part-time jobs).
- Finance, insurance, real estate, rental, and leasing was the second-largest industry group as a share of the marine economy and accounted for 12.7 percent, or $64.7 billion, of current-dollar value added.
- Transportation and warehousing accounted for 10.7 percent, or $54.7 billion, of marine economy value added.
- Arts, entertainment, recreation, accommodation, and food services accounted for 10.3 percent, or $52.6 billion, of value added and was the second-largest industry group for employment (about 652,000 full- and part-time jobs) in 2023, with the second-largest level of compensation ($26.8 billion).
The Marine Economy Satellite Account (MESA) measures the economic activity associated with the marine economy, identifies the industries responsible for producing these goods and services, and measures the output, value added, compensation, and employment associated with that production. Like other BEA satellite accounts, the MESA was built on BEA’s comprehensive supply and use framework. The supply and use tables (SUTs) provide a detailed look at the relationships among industries and how each industry contributes to GDP. In practice, the MESA is a rearrangement of the published SUTs with new estimation methods that isolate marine-related spending and production. A variety of private and public data sources were used to identify marine-related spending and production to develop the MESA estimates.
An important feature of the MESA is the presentation of estimates of gross output and value added by marine economic activity, in addition to the standard presentation of estimates by industry. This allows for the marine economy to be better analyzed in areas where significant economic activity occurs across a variety of industries.
The geographic scope of the MESA includes the Atlantic, Pacific, and Arctic Oceans within the Exclusive Economic Zone (approximately 200 nautical miles off the U.S. coast) as well as marginal seas, such as the Chesapeake Bay, Puget Sound, Long Island Sound, San Francisco Bay, and others. Also included is the U.S. shoreline directly along these bodies of water. Furthermore, the Great Lakes are included up to the international boundary with Canada.
For additional information on the marine economy statistics as well as the data sources and methodology that underlie their preparation, refer to “Defining and Measuring the U.S. Ocean Economy.”
The Marine Economy Satellite Account was produced in partnership with the National Oceanic and Atmospheric Administration.
The complete set of detailed annual statistics for 2014–2023 are available on BEA’s website. Statistics include data on marine economy gross output and value added presented by both industry and activity as well as employment and compensation presented by industry.
For Marine Economy Satellite Account definitions and more, visit “Additional Information.”
Next release: Spring 2026
Marine Economy Satellite Account, 2024