
Methodology
This publication presents revised statistics on the activities of U.S. affiliates of foreign multinational enterprises (MNEs) produced from the 2017 Benchmark Survey of Foreign Direct Investment in the United States (FDIUS), conducted by the Bureau of Economic Analysis (BEA). The 2017 benchmark survey was conducted to obtain complete data on foreign direct investment in the United States for 2017. Reporting on the survey was mandatory under the International Investment and Trade in Services Survey Act1. Benchmark surveys, which are conducted every 5 years, are BEA’s most comprehensive surveys of foreign direct investment, in terms of both the number of companies covered and the amount of information gathered; the last benchmark survey covered the year 20122.
In this publication, two related types of statistics are presented for U.S. affiliates of foreign multinational enterprises: (1) activities statistics and (2) direct investment position and transactions statistics. The activities statistics provide a variety of indicators of the overall finances and operations of U.S. affiliates, including balance sheets and income statements; value added; goods and services supplied; taxes; property, plant, and equipment; employment and compensation of employees; U.S. trade in goods; and research and development activities. These data cover the entire operations of the U.S. affiliate regardless of the percentage of foreign ownership3.
The direct investment position and transactions statistics cover financial transactions, income payments, and positions between U.S. affiliates and their foreign parents and other members of their foreign parent groups. These data thus focus on the foreign parent’s share, or interest, in the affiliate rather than on the affiliate’s overall size or level of operations. In conjunction with the sample data collected in BEA’s quarterly surveys of foreign direct investment in the United States, the direct investment position and transactions data collected in the benchmark survey are the source of the official estimates of direct investment-related measures that are included in the U.S. national income and product accounts (NIPAs), the U.S. international transactions accounts, and the U.S. net international investment position. The direct investment financial transactions, income, and position data collected in the benchmark survey are presented in this publication on a historical-cost (book value) basis; prior to their inclusion in the international accounts and the NIPAs, they are adjusted to reflect current-period prices.
For the activities data, more detailed information was collected for majority-owned U.S. affiliates (that is, affiliates that are owned more than 50 percent by foreign direct investors) than for non-majority-owned U.S. affiliates (affiliates that are owned less than or exactly 50 percent by foreign direct investors) to focus on companies that are unambiguously under foreign control. Because of the presumption of foreign control, majority ownership is viewed by many as the preferred basis for selecting firms for the analysis of the role of multinational enterprises in a host country’s economy4. Majority ownership is also recommended as the primary basis for the compilation of statistics on the activities of foreign-owned firms by the Organisation for Economic Co-operation and Development’s (OECD) OECD Handbook on Economic Globalisation Indicators and by the Manual on Statistics of International Trade in Services, reflecting in part the emphasis placed on data for majority-owned affiliates by trade negotiators and other policymakers.
In this publication, statistics for U.S. affiliates are primarily presented separately for two affiliate groups: (1) all (at least 10 percent foreign-owned) affiliates (Part I) and (2) majority-owned affiliates (Part II). A few tables also present data with additional ownership detail, such as for those affiliates that are 100 percent foreign-owned, see tables I. A1, II. A10, and II. A11. Most of the tables cover majority-owned affiliates (Part II), reflecting the more detailed information collected on their activities. A variety of table formats are used: some tables present statistics for several related data items, each of which is disaggregated by industry or by country of foreign owner; other tables present statistics for a single data item disaggregated by industry cross classified by country, by country cross classified by industry, or by state cross classified by industry or by country.
The activities data from the benchmark survey extend the series that begin with 1977 and that are derived from both annual and benchmark surveys5. The benchmark survey data will be used as the primary basis for extrapolating the data for nonbenchmark years to universe levels. Data for nonbenchmark years are collected in BEA’s annual cutoff sample surveys, which cover a sample of U.S. affiliates above a size-exemption level.
The activities of multinational enterprises, or AMNE, data collected and tabulated from the 2017 benchmark survey provide more detailed information on the activities of majority-owned U.S. affiliates (affiliates that are owned more than 50 percent by their foreign parent) than on the activities of all (majority-owned and non-majority-owned) U.S. affiliates. The focus on majority-owned foreign affiliates facilitates efforts to evaluate the consequences of foreign investment to the U.S. economy. An understanding of the actions of these companies is aided by a conceptual framework in which an economic actor controls the global activities of an MNE and majority-ownership guarantees that the control exists. Most affiliates are in fact majority-owned and account for most of the data; they accounted for 90.5 percent of employment and 91.4 percent of assets of all U.S. affiliates in 2017.
The statistics in this publication are based on data collected at the enterprise—or company—level. Data presented at the establishment—or plant—level are also available for selected years as a result of several projects linking BEA’s enterprise data on foreign direct investment in the United States with more detailed establishment data from the U.S. Census Bureau and the Bureau of Labor Statistics (BLS)6.
Coverage
The benchmark survey covered every U.S. business enterprise that was a U.S. affiliate of a foreign owner in 2017. A U.S. affiliate is a U.S. business enterprise in which a foreign owner holds, directly or indirectly (through another U.S. affiliate), at least 10 percent of the voting securities if the enterprise is incorporated or an equivalent interest if the enterprise is unincorporated. Investments in U.S. private funds are included if the foreign owner ultimately owns at least 10 percent of an “operating company”—a business enterprise that is not a private fund or a holding company—through the U.S. private fund; otherwise, they are excluded7.
For both the activities data and the direct investment position and transactions data, the statistics presented in this publication cover every U.S. business enterprise that was a U.S. affiliate at the end of its 2017 fiscal year. The coverage of the direct investment position and transactions data in this publication is thus consistent with that of the activities data. However, it differs from the coverage of these data in the U.S. international investment position and international transactions accounts, which for a given calendar year, include transactions for U.S. businesses that were U.S. affiliates at some time during the year but that were not affiliates at the end of the year, because the foreign parents’ interest in them was liquidated or sold during the year.
Every U.S. affiliate was required to report in the 2017 benchmark survey. Affiliates completed the survey by submitting a BE-12A, BE-12B, or BE-12C form. The type of form filed depended on the size of the affiliate and whether the affiliate was majority owned. The size of an affiliate is determined by these items: total assets, sales, or net income (or loss). All majority-owned affiliates with one of these items valued at more than $300 million filed the most detailed BE-12A form. All majority-owned affiliates with any one of these items valued at more than $60 million, but with all items less than, or equal to, $300 million filed on the less detailed BE-12B form. All minority-owned affiliates with any of these items valued at more than $60 million also filed on the less detailed BE-12B form. Smaller affiliates that had total assets, sales, or net income (or loss) of less than or equal to $60 million filed an abbreviated form, BE-12C; and those with all of these three items below $20 million were required to report only some basic identification information and a few items indicating affiliate size—including total assets, sales, net income, and employment—on a shorter version of the BE-12C form. The use of the less detailed forms BE-12B and BE-12C allows BEA to reduce the burden on mid-sized, smaller, and minority-owned entities.
Concepts and Definitions
This section discusses the basic concepts and definitions used in the 2017 benchmark survey.
Direct investment
Direct investment implies that a person resident in one country exercises control or a significant degree of influence over the management of a business enterprise resident in another country. For the United States, in accordance with international guidelines, ownership or control of 10 percent or more of an enterprise’s voting securities, or the equivalent, is considered evidence of having at least a significant degree of influence over management, with control being deemed to exist if the investor owns more than 50 percent of the voting securities8. Thus, foreign direct investment in the United States is ownership or control, direct or indirect, by one foreign person of 10 percent or more of the voting securities of an incorporated U.S. business enterprise or an equivalent interest in an unincorporated U.S. business enterprise. Only foreign investment in the United States that is direct investment was covered by the 2017 benchmark survey.
Direct investment in a U.S. business enterprise can result from direct or indirect ownership by a foreign person. In direct ownership, the foreign person itself holds the ownership interest in the U.S. business enterprise. In indirect ownership, one or more tiers of ownership exist in the United States between the U.S. business enterprise and the foreign person. For example, a U.S. business enterprise may be directly owned by another U.S. business enterprise that is, in turn, owned by the foreign person. A foreign person’s percentage of indirect voting ownership in a given U.S. business enterprise is equal to the direct voting ownership percentage of the foreign person in the first U.S. business enterprise in the ownership chain, times the first enterprise’s direct voting ownership percentage in the second U.S. business enterprise in the chain, times the corresponding percentages for all intervening enterprises in the chain, times the last intervening enterprise’s direct voting ownership percentage in the given U.S. business enterprise. If a foreign person has claims on a U.S. business enterprise through more than one ownership chain, the percentages of direct and indirect ownership in all chains are summed to determine the foreign person’s ownership percentage.
Direct investment refers to ownership by a single person, not to the combined ownership by all the persons in a country. A “person” is broadly defined to include any individual, branch, partnership, associated group, association, estate, trust, corporation, or other organization (whether or not organized under the laws of any state) and any government (including a foreign government, the U.S. government, a state or local government, or any corporation, financial institution, or other entity or instrumentality thereof, including a government sponsored agency).
An associated group is treated in this definition as a single person. An associated group consists of two or more persons who exercise their voting privileges in a concerted manner—by the appearance of their actions, by agreement, or by an understanding—in order to influence the management of a business enterprise. The following are deemed associated groups: (1) members of the same family, (2) a business enterprise and one or more of its officers or directors, (3) members of a syndicate or joint venture, (4) a corporation and its domestic subsidiaries, and (5) the national and provincial levels of a foreign country’s government. Thus, direct investment is considered to exist as long as the combined ownership interest of all members of the group is at least 10 percent, even if no one member owns 10 percent or more. The definition assumes, in effect, that the members’ influence over management is comparable to that of a single person with the same ownership interest.
Investment by a foreign person of less than 10 percent in a U.S. business enterprise is not considered direct investment, even if another foreign person—of the same country or of another country—has an interest of at least 10 percent in the enterprise. Thus, if one foreign person owns 11 percent and another owns 9 percent, the 11 percent interest is included, but the 9 percent interest is excluded. However, if two or more foreign persons each hold an interest of at least 10 percent, each such interest is included.
Determination of residency
For purposes of the benchmark survey (and BEA’s other direct investment surveys), the “United States” means the 50 states, the District of Columbia, the Commonwealth of Puerto Rico, and all U.S. territories and possessions. U.S. offshore oil and gas sites are also considered to be in the United States.
“Foreign” means that which is situated outside the United States or which belongs to or is characteristic of a country other than the United States.
The country of residence, rather than the country of citizenship, of a person is used to determine whether a direct investor or the business enterprise owned by a direct investor is domestic (U.S.) or foreign. A U.S. person is any person who resides in or is subject to the jurisdiction of the United States, and a foreign person is any person who resides outside the United States or who is subject to the jurisdiction of a country other than the United States.
A person is considered a resident of or subject to the jurisdiction of the country in which the person is located if the person resides or expects to reside in it for 1 year or more. Under this rule, individuals who reside or expect to reside outside their country of citizenship for less than 1 year are considered residents of their country of citizenship, whereas individuals who reside or expect to reside outside their country of citizenship for 1 year or more are considered residents of the country in which they are residing.
There are two exceptions to this rule. First, individuals (and their immediate families) who either own or are employed by a business enterprise in their country of citizenship and who are residing outside of that country for 1 year or more in order to conduct business for the enterprise are considered residents of their country of citizenship if they intend to return within a reasonable period of time. Second, individuals who reside outside their country of citizenship because they are government employees (such as diplomats, consular officials, and members of the armed forces and their immediate families) are considered residents of their country of citizenship regardless of their length of stay.
The U.S. affiliate
A U.S. affiliate is a U.S. business enterprise in which there is foreign direct investment. The affiliate is called a U.S. affiliate to denote that it is located in the United States.
A business enterprise is any organization, association, branch, venture, or the ownership of real estate that exists for profitmaking purposes or to otherwise secure economic advantage. Therefore, by definition, a business enterprise excludes the ownership of real estate exclusively for personal use; a primary residence that is leased to others by an owner while outside the United States who intends to reoccupy it is considered real estate held for personal use and not a business enterprise.
A business enterprise, and therefore an affiliate, may be either incorporated or unincorporated. Unincorporated affiliates primarily take the form of branches and partnerships. They may also include directly held commercial property.
A U.S. affiliate that is a branch consists of operations or activities in the United States that a foreign person conducts in its own name rather than through an entity separately incorporated in the United States. By definition, a branch is wholly owned.
In general, the U.S. operations or activities of a foreign person are considered to be a U.S. affiliate if they are legally or functionally separable from the foreign operations or activities of the foreign person. In most cases, it is clear whether the U.S. operations or activities constitute a U.S. affiliate. If an operation or activity is incorporated in the United States—as most are—it is always considered a U.S. affiliate. The situation is not always so clear with unincorporated U.S. operations or activities. Most are legally or functionally separable from those of the foreign person and thus are considered U.S. affiliates, but some are not clearly separable, and the determination of whether they constitute U.S. affiliates is made on a case by case basis, depending on the weight of evidence. The following characteristics would indicate that the unincorporated operation or activity probably is a U.S. affiliate:
- It is subject to U.S. income taxes.
- It has a substantial physical presence in the United States, as evidenced by plant and equipment or employees that are permanently located in the United States.
- It has separate financial records that allow the preparation of financial statements, including a balance sheet and income statement. (A mere record of disbursements to or receipts from the U.S. operation or activity would not constitute a “financial statement” for this purpose.)
- It takes title to the goods it sells and receives revenues from the sale, or it receives funds from customers for its own account for services it performs.
The following characteristics would indicate that the unincorporated operation or activity probably is not a U.S. affiliate:
- It is not subject to U.S. income taxes.
- It has limited physical assets or few employees permanently located in the United States.
- It has no separate financial records that allow the preparation of financial statements.
- It conducts business in the United States only for the foreign person’s account, not for its own account.
- It engages only in sales promotion or public relations activities.
- Its expenses are paid by the foreign person.
Consistent with these guidelines, the U.S. stations, ticket offices, and terminal or port facilities of a foreign airline or ship operator that provide services only to the airline’s or ship operator’s operations are not considered U.S. affiliates, because most of the revenues, such as passenger fares and freight charges, collected by these facilities are generated by the travel and transportation services rendered by the airline or ship operator of which they are a part, not by the activities of these facilities. However, if the facilities provide services to unaffiliated persons, they are considered U.S. affiliates.
Each U.S. affiliate was required to report on a fully consolidated domestic (U.S.) basis. The full consolidation includes all U.S. business enterprises proceeding down each ownership chain whose voting securities are more than 50 percent owned by the U.S. business enterprise above. The consolidation excludes all other U.S. business enterprises and all foreign business enterprises owned by the U.S. affiliate. U.S. affiliates that are at least 10 percent indirectly owned by a foreign parent but are not consolidated into the report of another U.S. affiliate because they are not at least 50 percent owned by the U.S. business enterprise above are required to file a separate report.
As an exception to this general consolidation rule, a U.S. affiliate in which a direct ownership interest was held by one foreign person and an indirect ownership interest was held by another foreign person was not permitted to be consolidated in the report of another U.S. affiliate—it must file a separate report; this rule ensured that data on transactions and positions of both owners could be obtained from the affiliate.
The foreign owners
The existence of direct investment in a U.S. affiliate is determined solely on the basis of the voting shares (or the equivalent) held by its foreign parent. To more completely describe the foreign ownership of a U.S. affiliate, however, reference must be made to two additional entities—the foreign parent group and the ultimate beneficial owner (UBO). All three concepts are necessary to identify fully the owners of U.S. affiliates. The foreign parent of a U.S. affiliate must be identified to establish that foreign direct investment does in fact exist. The UBO of each U.S. affiliate is identified to determine the person that ultimately owns or controls and therefore, ultimately derives the benefits from owning or controlling the U.S. affiliate9. Members of the foreign parent group are identified to distinguish foreign persons that are affiliated with a U.S. affiliate from those that are not.
The affiliate’s transactions with all these persons are included in the income and financial accounts of the U.S. international transactions accounts. The direct investment positions in the affiliate that are held by all members of the foreign parent group, not just by its foreign parent, are included in the foreign direct investment position in the United States. While only foreign parents have equity transactions and positions with the affiliate, other members of the foreign parent group can engage in intercompany lending and borrowing with the affiliate10.
A given U.S. affiliate may have more than one ownership chain above it if it is owned at least 10 percent by more than one foreign person. In such cases, the affiliate may have more than one foreign parent, UBO, and foreign parent group.
A foreign parent is the first person outside the United States in a U.S. affiliate’s ownership chain that has a direct investment interest in the affiliate. By this definition, the foreign parent consists only of the first person outside the United States in the affiliate’s ownership chain; all other affiliated foreign persons are excluded.
The ultimate beneficial owner of a U.S. affiliate is that person, proceeding up a chain of majority-ownership (where the entity above owns more than 50 percent of the entity below), beginning with and including the foreign parent of the U.S. affiliate, that is not owned more than 50 percent by another person11. If the foreign parent is not owned more than 50 percent by another person, the foreign parent and the UBO are the same. Unlike the foreign parent, the UBO may be either a U.S. person or a foreign person (though most are foreign).
Both the foreign parent and the UBO are “persons.” Thus, they may be business enterprises; religious, charitable, or other nonprofit organizations; individuals; governments; estates or trusts; associated groups; and so forth. In the case of a foreign estate, the estate, not its beneficiary, is considered the foreign parent or UBO. For the investments of a foreign trust, either the creator or the beneficiary of the trust may be considered the foreign parent or UBO, depending on the circumstances. The creator is considered the foreign parent or UBO if the creator is a corporation or other organization that designates its own shareholders or members as beneficiaries or if there is a reversionary interest—that is, the interest in the trust may later be returned to the creator. In all other cases, the beneficiary of the trust is considered the foreign parent or UBO.
A foreign parent group consists of (1) the foreign parent, (2) any foreign person, proceeding up the foreign parent’s ownership chain, that owns more than 50 percent of the person below it, up to and including the UBO, and (3) any foreign person, proceeding down the ownership chain(s) of each of these members, that is owned more than 50 percent by the person above it.
Accounting Principles
In most cases, data in the 2017 benchmark survey were required to be reported as they would have been for stockholders’ reports rather than for tax or other purposes. Thus, unless otherwise indicated by the survey instructions, survey reporters were asked to report using U.S. generally accepted accounting principles (GAAP). The survey instructions departed from GAAP in cases where the departure would result in data that were conceptually or analytically more useful or appropriate for direct investment purposes. One major departure from GAAP was in the area of consolidation rules (see the preceding discussion of consolidated reporting for “The U.S. affiliate” in the section “Concepts and Definitions”).
Reporters that maintained their accounting records using international financial reporting standards (IFRS) or other reporting standards were asked to make adjustments, if feasible, to correct for any material differences between GAAP and the reporting standards used12.
Fiscal-Year Reporting
Data for U.S. affiliates were required to be filed on a fiscal-year basis. An affiliate’s 2017 fiscal year was defined to be the affiliate’s financial reporting year that ended in calendar year 2017. Because the fiscal-year data from the benchmark survey that are presented in this publication are not identical to the calendar year estimates that are needed for the U.S. international transactions accounts and in the foreign direct investment position in the United States, these data must be adjusted to a calendar year basis before they are entered into the international transactions and foreign direct investment position accounts.
The extent of noncomparablity between the benchmark survey data presented here and the direct investment statistics presented in the international transactions and foreign direct investment position accounts depends on the number and size of, and volatility of the data for, the U.S. affiliates whose fiscal years do not correspond to the calendar year. Selected data for affiliates classified by the affiliates’ fiscal year ending date are shown in table 1. As indicated in the addendum to the table, affiliates whose fiscal year exactly corresponded to the calendar year 2017 accounted for most of the foreign direct investment position and direct investment income for all affiliates.
Unlike the direct investment position and transactions data, activities data in all BEA surveys are consistently collected and published on a fiscal-year basis.
Confidentiality
Under the International Investment and Trade in Services Survey Act, the direct investment data collected by BEA from individual respondents are confidential; thus, they cannot be published in such a manner “that the person to whom the information relates can be specifically identified.” For these statistics, each cell in a table was tested to determine whether the data it contained should be suppressed (not be shown) for confidentiality reasons. A “(D)” in a cell indicates that the data were suppressed to avoid the disclosure of information on an individual company. For employment data, a letter representing a size range is entered in lieu of a “(D).”
The act further specifies that the data must be used for statistical and analytical purposes only; the use of an individual company’s data for tax, investigative, or regulatory purposes is prohibited. Access to the data is limited to officials and employees (including consultants and contractors and their employees) of government agencies designated by the President to perform functions under the act. In addition, as amended by the Foreign Direct Investment and International Financial Data Improvements Act of 1990, the act grants access to certain other government agencies for limited statistical purposes. For example, access is granted to the Census Bureau for the purpose of linking BEA’s enterprise , or company , level data for foreign direct investment to the Census Bureau’s establishment , or plant , level data for all U.S. companies to obtain more detailed data by industry and by state for the foreign owned enterprises that report to BEA. A separate act, the Confidential Information Protection and Statistical Efficiency Act of 2002 (Title V of Public Law 107–347), also authorizes the sharing of business confidential data (including BEA’s direct investment data) between BEA and the Bureau of Labor Statistics under specified conditions for statistical purposes.
Private individuals may obtain access to the data only in the capacity of experts, consultants, or contractors whose services are procured by BEA, usually on a temporary or intermittent basis, for purposes of carrying out projects under the Survey Act—for example, to perform research on foreign direct investment. Outside researchers can apply to use BEA’s company data for their statistical research under strict guidelines. Those who are approved take an oath to safeguard the data as special sworn research consultants of BEA13.
Classification of Data
Both the activities data and the direct investment position and transactions data from the benchmark survey can be classified by industry of affiliate, by country and industry of UBO, and by country and industry of foreign parent. In addition, the direct investment position and transactions data can be classified by country of each member of the foreign parent group.
Industry classification
In the 2017 benchmark survey, each U.S. affiliate was classified by industry using the International Survey Industry (ISI) classification system, which was updated for the benchmark survey to reflect the 2017 revision to the North American Industry Classification System (NAICS). The new 2017 ISI classifications differ minimally from the 2012 ISI classifications used in the benchmark and annual surveys for 2012–2016, which were based on the 2012 version of NAICS14.
For the most part, the ISI classifications are equivalent to NAICS four-digit industries; at its most detailed level, NAICS classifies industries at a six digit level. The ISI classification system is less detailed than NAICS because it is designed for classifying enterprises rather than establishments (or plants). Because many direct investment enterprises are active in several industries, it is not meaningful to classify all their data in a single industry if that industry is defined too narrowly.
Each U.S. affiliate was classified by industry based on its sales (or its total income, for holding companies) in a three step procedure. First, a given U.S. affiliate was classified in the two-digit NAICS sector that accounted for the largest percentage of its sales. Second, within the sector, the U.S. affiliate was classified in the three digit subsector in which its sales were largest. Third, within its three digit subsector, the U.S. affiliate was classified in the four digit industry in which its sales were largest. This procedure ensured that the U.S. affiliate was not assigned to a four digit industry outside either its two-digit sector or its three digit subsector15.
Tables I.A 2 and II.A 2 present selected activities data for U.S. affiliates classified by industry of affiliate; each four digit industry is shown separately and is grouped by the sector and subsector to which it belongs. (Table I.A 2 presents detailed industry data for all affiliates, and table II.A 2 presents detailed industry data for majority-owned affiliates.) Primarily because of confidentiality requirements, many of these four digit industries are not shown in the other tables in this publication. However, each industry that is included, but not identified, in an industry group shown in the other tables may be ascertained by referring to tables I.A 2 and II.A 2.
Each U.S. affiliate was classified in a single industry—the primary industry of the affiliate. As a result, any affiliate activities that take place in secondary industries are classified as activities in the primary industry. Because the benchmark survey data were collected on an enterprise basis, the reports for many affiliates reflect substantial activities in secondary industries. Information on the distribution of activities within each firm was obtained in the benchmark survey for two key items—sales and employment. Each majority-owned U.S. affiliate above a minimum size threshold was required to distribute its sales and its employment among the four digit industries in which it had sales16. Data on affiliate sales distributed by industry of sales are presented in tables II.A 8, II.D 7, II.D 8, and II.D 9; data on affiliate employment distributed by industry of sales are presented in tables II.A 8, II.G 10, II.G 11, and II.G 12. The data classified by industry of sales show that many affiliates had activities in more than one industry.
The distribution of affiliate data by industry of sales roughly approximates the distribution that would result if the data were reported and classified by industry of establishment because an affiliate that has an establishment in an industry usually also has sales in that industry. BEA is studying the feasibility of producing more granular industry and U.S. geographical detail for U.S. affiliates by participating in data blending projects with other statistical agencies.
The foreign parent and UBO of each affiliate were also classified by industry; however, because a breakdown was not obtained for each industry in which the foreign parent or UBO had sales, the categories used were much less detailed than those used for affiliates. In the benchmark survey, an affiliate had to assign its foreign parent and UBO to 1 of 32 broad NAICS based categories. Selected data for majority-owned affiliates classified by industry of UBO are presented in table II.A 6. Data by industry of affiliate cross-classified by industry of UBO are shown in tables II.B 5, II.D 5, II.F 4, and II.G 5.
The industry classification of an affiliate’s foreign parent may differ from that of its UBO. The foreign parent consists only of the first foreign person in the affiliate’s ownership chain, and its industry of classification reflects only the activities of that first foreign person. In contrast, the UBO’s industry reflects its fully consolidated worldwide activities, including the activities of both U.S. and foreign entities in the ownership chain below it.
A distribution of sales by industry was not obtained for UBOs or foreign parents. For affiliates that had more than one UBO or foreign parent, each UBO or foreign parent was classified. In the tables that show data disaggregated by industry of UBO or foreign parent, all data for these affiliates are shown in the industry of the UBO or foreign parent with the largest ownership share.
Country classification
In the benchmark survey, the UBO and the foreign parent of a U.S. affiliate were each classified by country. For affiliates that had more than one UBO or foreign parent, each UBO or foreign parent was classified; for most of the tables in this publication, the data for a given affiliate were then classified by the country of the UBO or the foreign parent that had the largest ownership share in the affiliate.
For most affiliates, the country of the UBO is the country of the foreign parent. Tables I.A 7 and II.A 7 compare data for selected items by country of UBO and by country of foreign parent for U.S. affiliates.
Most of the data in the tables that are disaggregated by country in this publication are classified by country of UBO. Classification by country of UBO usually is used for activities data because the country that ultimately owns or controls a U.S. affiliate and that therefore derives benefits from owning or controlling the affiliate generally is considered most important for analyzing these data. The direct investment position and transactions data in this publication are also classified by country of UBO so that both types of data presented will be classified on the same basis. In contrast, the data in the U.S. international transactions accounts and in the foreign direct investment position in the United States are usually classified by the country of each member of the foreign parent group with which there are transactions or positions. Statistics on the direct investment position and direct investment income by country of UBO are also available as part of the Direct Investment by Country and Industry statistics17.
Tables I.A 3 and II.A 3 present selected activities data for U.S. affiliates by each country in which a UBO was located in 2017. Primarily because of confidentiality requirements, many countries could not be shown in the other tables in this publication. However, each country included, but not identified, in a geographic group shown in the other tables may be ascertained by referring to these tables.
Estimation and General Validity of the Data
These statistics cover the universe of U.S. affiliates. They were derived from data reported at the enterprise, or company, level by U.S. affiliates reporting in BEA’s Benchmark Survey of Foreign Direct Investment in the United States.
Every U.S. affiliate was required to report in the benchmark survey for 2017. Affiliates completed the survey by submitting a BE-12A, BE-12B, or BE-12C form. The type of form filed depended on the size of the affiliate and whether the affiliate was majority-owned. Specific reporting requirements for each form were described above. The BE-12A form is the longest form, filed by the largest majority-owned U.S. affiliates. The use of the less detailed forms BE-12B and BE-12C allows BEA to reduce the burden on mid-sized, small, and minority-owned entities. For affiliates filing the BE-12C form, BEA estimated items that appear on the B form. For majority-owned entities filing the BE-12B and BE-12C forms, BEA estimated the items that appear only on the A form, so that the results are presented in the same detail for all majority-owned affiliates. However, estimates of items that appear only on the A form are not prepared for non-majority-owned affiliates. Therefore, the results for all affiliates (majority-owned plus non-majority-owned affiliates) cover only the items that are on the less detailed B form.
For both majority-owned and non-majority-owned affiliates, the statistics include imputations for affiliates that failed to report in the benchmark survey but for which BEA had a basis for estimation, usually from data reported in other BEA surveys. The statistics do not include estimates for affiliates unknown to BEA.
The data reported by U.S. affiliates had to pass a substantial number of computerized edit checks and review by BEA staff. Where possible, the data for an affiliate were reviewed for their consistency with related data for the affiliate from other parts of the report form, with data provided in related report forms, with comparable data reported by other affiliates, and with comparable data from outside sources. As a result of this edit and review process, a number of changes were made to the reported data, usually after consultation with the reporting affiliate. For smaller affiliates filing the BE-12C form, auto-editing applications were used to impute missing or erroneously reported data.
Number of Affiliates
Several tables in this publication present the number (by industry, country, or state) of affiliates with total assets, sales, or net income (or loss) greater than $20 million, the minimum size threshold for reporting in the 2017 benchmark survey using the full version of Form BE–12C or a more detailed survey form. The affiliate number counts shown in the tables of this publication exclude very small affiliates; that is, they exclude affiliates with total assets, sales, and net income (or loss) of $20 million or less. These very small affiliates consist of affiliates that were only required to file an abbreviated version of Form BE-12C. In terms of value, the affiliates below this threshold account for only a tiny percentage of the data for all affiliates.
The published figures may also be subject to some imprecision because some affiliates that were required to file a report did not do so. Because of limited resources, BEA’s efforts to ensure compliance with reporting requirements focused mainly on larger affiliates. As a result, some smaller affiliates that were not aware of the reporting requirements and that were not on BEA’s mailing list may not have filed reports. Although the omission of these affiliates from the benchmark survey results probably has not significantly affected the aggregate value of the various data items collected, it likely caused an understatement of the number of affiliates.
Even an exact count of U.S. affiliates would be difficult to interpret because each report covers a fully consolidated U.S. business enterprise, which may consist of multiple companies. The number of fully consolidated enterprises varies according to the degree of consolidation used and the differences in the organizational structure of the company. Several tables in this publication (for example, table I.A 1) show the number of companies consolidated in the affiliates’ reports in addition to the number of affiliates. Because the report for one affiliate may cover multiple companies, the total number of companies consolidated is substantially higher than the total number of affiliates.
This publication includes affiliate number counts by state for all affiliates with employment (table I.A 9) and for majority-owned affiliates with employment (tables II.A 9 and II.G 16). For a given state, an affiliate is counted even if it only has a few employees in the state. The significance of small operations in a particular state can be ascertained from table II.G 16, which shows the number of affiliates with employment disaggregated by size class.
Activities Data
Activities data focus on the overall operations of U.S. affiliates. Among the items covered by these data are the following: balance sheets and income statements; value added; goods and services supplied; taxes; property, plant, and equipment; employment and compensation of employees; U.S. trade in goods; and research and development activities.
The activities data for U.S. affiliates are not adjusted for the ownership share of the foreign direct investors. Thus, for example, the employment data include all the employees of each affiliate, including affiliates in which the foreign investor’s ownership share is less than 100 percent.
Most of the concepts and definitions used in reporting the activities data can be found in the instructions of the survey forms. The following discussion focuses on the concepts, definitions, and statistical issues that require further explanation or that are not covered in the forms.
Balance sheets and income statements
U.S. affiliates’ balance sheets and income statements are required to be reported as they would have been for stockholders’ reports if they were required—preferably according to U.S. generally accepted accounting principles18. Therefore, any major changes in GAAP will affect the affiliate data.
For most affiliates, the income statement includes all types of income, both ordinary and extraordinary. However, for some affiliates, such as those in insurance, GAAP requires certain unrealized gains and losses to be carried directly to owners’ equity in the balance sheet rather than to be recorded on the income statement.
Under GAAP, depreciation and depletion charges are used to distribute the cost of an asset over that asset’s estimated useful life. For example, affiliates engaged in extracting natural resources report net income after the deduction of book depletion—that is, those expenses representing the periodic chargeoff of the actual cost of natural resources. Tax or percentage depletion is not deducted.
Value added
Value added is an economic accounting measure of the production of goods and services. A U.S. affiliate’s value added measures the value of its production net of any intermediate inputs produced by others; it thus measures the affiliate’s direct contribution to U.S. gross domestic product (GDP).
For U.S. affiliates value added estimates are calculated using the income method as the sum of costs incurred (except for intermediate inputs) and profits earned in production. The costs fall into four major categories: compensation of employees, net interest paid, taxes on production and imports, and the capital consumption allowance19. Alternatively, a U.S. affiliate’s value added can be measured as gross output (revenue) less its intermediate inputs (purchased goods and services used in production).
Value added is generally preferred to sales or other measures used to assess the direct economic impact of affiliates on the entire U.S. economy and on individual industries. Value added permits a more focused analysis of the impact of affiliates because it measures only the affiliates’ own contribution to economic output, whereas sales do not distinguish between the affiliates’ own contribution and the value of output embodied in inputs purchased from other companies. In addition, value added estimates measure the contribution to the economy by affiliates during a specific period. In contrast, some of the sales in a given period may represent production from earlier periods.
Goods and services supplied
For majority-owned affiliates, the 2017 benchmark survey collected affiliate sales (or gross operating revenues) disaggregated into goods, services, and investment income. Services were further disaggregated according to whether the customer was affiliated or unaffiliated with the seller and whether the customer was a resident of the United States. Supplemental information collected in the benchmark survey for affiliate activities in the banking and insurance industries was used to adjust the reported data on sales of goods and services to produce statistics on goods and services supplied, BEA’s featured measures of the output of goods and services provided by U.S. affiliates20.
For purposes of distributing sales into goods, services, and investment income, “goods” are generally defined to be economic outputs that are tangible, and “services” are generally defined to be economic outputs that are intangible21. Information on investment income was collected primarily to ensure that, if investment income was included in total sales (or gross operating revenues), it would not be included in sales of services. In finance and insurance, affiliates include investment income in sales because it is generated by a primary activity of the affiliate. In other industries, most affiliates consider investment income an incidental revenue source and include it in the income statement in an “other income” category rather than in sales.
For most industries, goods and services supplied by affiliates are equal to the reported values of affiliate sales of goods and services. Adjustments to these reported sales values are made for bank affiliates and for affiliates with activities in insurance or in wholesale or retail trade to better measure their output22. For banks, services supplied includes explicit fees and commissions and an estimate of the value of implicit charges for services provided by banks (often referred to as financial intermediation services indirectly measured, or FISIM)23. For insurance, services supplied consists of BEA’s estimate of premiums remaining after provision for expected or “normal” losses and a measure of premium supplements, which represent income earned on funds insurers hold on policymakers’ behalf. For wholesalers and retailers, services supplied includes an estimate of the distributive services affiliates provide by selling or arranging for the sales of goods; this estimate of distributive services is subtracted from the reported value of sales of goods to produce a measure of goods supplied that includes only the value of the goods resold. These adjustments to reported sales of goods and services affect the distribution of sales between goods and services supplied but do not affect the total value of sales.
Employment and compensation of employees
In the benchmark survey, affiliates were requested to report employment as the number of full time and part time employees on the payroll at the end of fiscal year 2017. However, a count taken during the year was accepted if it was a reasonable proxy for the end of year number. In addition, if employment at the end of the year was unusually high or low because of temporary factors, such as seasonal variations or a strike, a number reflecting normal operations was requested.
For majority-owned affiliates, employment is classified both by industry of affiliate and by industry of sales. The classification by industry of sales is based on information supplied by each affiliate above a minimum size threshold on employment in the four digit industries in which it had sales.
Data were collected on employment and compensation of employees covering affiliates’ total U.S. operations. In addition, the data on affiliate employment were broken down by state.
Although the data on employment and compensation of employees from the benchmark survey can be used to compute rates of compensation per employee and wages and salaries per employee, these rates may not accurately reflect the compensation rates normally paid by affiliates (and, thus, are not shown in this publication). The computed rates may be distorted by the inclusion of part time employees because part time employees are counted the same as full time employees or by data that cover only part of the year—for example, data for an affiliate that was newly established during the year24.
U.S. trade in goods
The concepts and definitions underlying the data collected in the benchmark survey on U.S. trade in goods of U.S. affiliates are nearly identical to those used for the data on total U.S. trade in goods compiled by the Census Bureau. The trade data are particularly difficult for affiliates to report, but BEA’s review of the reported data indicates that most of the data conform well to Census Bureau concepts and definitions. However, because of certain reporting issues, the affiliate trade data are not completely comparable with the Census Bureau trade data. In the benchmark survey, data on U.S. trade in goods were requested to be reported on a “shipped” basis—that is, on the basis of when, where, and to (or by) whom the goods were shipped—in order for them to be comparable with official U.S. trade data. However, most affiliates keep their accounting records on a “charged” basis—that is, on the basis of when, where, and to (or by) whom the goods were charged. The two bases are usually the same, but they can differ substantially. For example, if a U.S. affiliate buys goods from country A and sells them to country B and if the goods are shipped directly from country A to country B, the affiliate’s books would show a purchase from country A and a sale to country B. Because the goods never entered or left the United States, on a shipped basis, they would not be recorded as either U.S. imports or U.S. exports. However, if the affiliate’s trade data were reported on a charged basis, the purchase would appear as a U.S. import, and the sale would appear as a U.S. export.
On the basis of its review, BEA believes most affiliates reported on a shipped, rather than on a charged, basis. However, some affiliates had difficulty obtaining data on a shipped basis, which usually requires using shipping department invoices rather than accounting records. If BEA determined that the data were reported on a charged basis and that these data were likely to differ materially from data reported on a shipped basis, it required revised reports to be filed. However, some cases of erroneous reporting were probably not identified.
In addition, the data on trade by U.S. affiliates that are collected by BEA are on a fiscal-year basis, whereas the data on total U.S. trade in goods that are collected by the Census Bureau are on a calendar-year basis. Exports and imports of goods classified by the affiliates’ fiscal year ending date are shown in table 1.
Additional differences between the BEA trade data and the Census Bureau trade data may have resulted simply because the data come from different sources: the BEA data are based on company records, whereas the Census Bureau data are compiled from export and import documents filed by shippers with the U.S. Bureau of Customs and Border Protection on individual transactions. The timing, valuation, origin or destination, shipper, and product involved in a given transaction may be recorded differently on company records than on these export and import documents.
In the 2017 benchmark survey, as in previous benchmark surveys, exports shipped by majority-owned U.S. affiliates were disaggregated by country of destination, and imports shipped to majority-owned U.S. affiliates were disaggregated by country of origin. To reduce the reporting burden on U.S. affiliates, breakdowns of trade in goods by country of destination or origin are collected only in benchmark survey years. In the 2017 benchmark survey, imports shipped to majority-owned U.S. affiliates were disaggregated by intended use into three categories: capital equipment, goods for resale without further manufacture, and goods for further manufacture.
Research and development
The 2017 benchmark survey collected data on two technology related items—research and development (R&D) expenditures and the number of employees engaged in R&D related activities.
As in previous benchmark surveys, the 2017 benchmark survey data on R&D expenditures were collected on two bases: R&D performed by the affiliate (whether the R&D was for its own use or for use by others) and R&D funded by the affiliate (whether the R&D was performed internally or by others). R&D performed can be used to gauge the technological capabilities of affiliates. R&D funded views R&D from the perspective of the costs of production and can be used as an indicator of affiliates’ use of technology; this basis is consistent with GAAP accounting for the costs of R&D. A detailed description of what is considered an R&D employee is available in the survey instructions.
Direct Investment Position and Transactions Statistics
Direct investment position and transactions statistics measure the U.S. affiliate’s positions and transactions with its foreign parent and other members of its foreign parent group25. In contrast, affiliate activities data provide measures of the U.S. affiliate’s overall operations, including its transactions and positions with all persons. For example, the direct investment position in an affiliate is equal to its foreign parent group’s equity in, and net outstanding loans to, its U.S. affiliate; a U.S. affiliate’s total assets, in contrast, are equal to the sum of (1) the total owners’ equity in the affiliate held both by members of the foreign parent group and by all other persons and (2) the total liabilities owed by the affiliate both to members of the foreign parent group and to all other persons26.
In the benchmark survey, data for the direct investment position and transactions items for affiliates were obtained in part III of Forms BE-12A and BE-12B.
For foreign direct investment in the United States, two major items appear in the U.S. international transactions accounts: direct investment financial transactions and direct investment income. Two adjustments are made to the direct investment transactions data before they are entered into the U.S. international accounts. First, the two items are adjusted to reflect current-period prices27. Second, the data from the benchmark survey are adjusted from a fiscal-year basis to a calendar-year basis. As discussed in the section on fiscal year reporting, the direct investment position and transactions data collected in the 2017 benchmark survey are on a fiscal-year basis. Thus, before the data are incorporated into the U.S. international transactions accounts and the investment position, which are on a calendar-year basis, they are adjusted from a fiscal-year basis to a calendar-year basis. The adjusted data for 2017 are extrapolated forward to derive universe estimates for calendar years after 2017 based on sample data collected in BEA’s quarterly surveys28.
Foreign direct investment position in the United States
The foreign direct investment position in the United States at historical cost is equal to the net book value of the foreign parent groups’ equity in and net outstanding loans to their U.S. affiliates. The position may be viewed as the cumulative financing provided in the form of equity or debt by foreign parent groups to U.S. affiliates.
The direct investment position data presented in this publication are valued at historical cost (book value) and are not adjusted to current value. Thus, they largely reflect prices at the time of investment rather than prices of the current period. Because historical cost (book value) is the basis used for valuation in company accounting records in the United States, it is generally the only basis on which companies can report data in BEA’s direct investment surveys29. It is also the only basis on which detailed estimates of the position are available by country, by industry, and by account. However, BEA does provide aggregate estimates of the position valued in current period prices30.
Direct investment equity positions in U.S. affiliates are, by definition, held only by foreign parents. Foreign parents may also have direct debt positions with U.S. affiliates.31 For other members of the foreign parent groups, only direct debt positions are included in the direct investment position.
Foreign parents’ equity in incorporated affiliates can be broken down into foreign parents’ holdings of capital stock in, and other capital contributions to, their U.S. affiliates and foreign parents’ equity in the retained earnings of their U.S. affiliates. Capital stock consists of all the stock of the affiliates—both common and preferred and voting and nonvoting. Other capital contributions by foreign parents, also referred to as the “foreign parents’ equity in additional paid in capital,” consist of the invested and contributed capital that is not included in capital stock, such as cash contributions, the amount paid for stock in excess of its par or stated value, and the capitalization of intercompany accounts (conversions of debt to equity) that do not result in the issuance of capital stock. Foreign parents’ equity in retained earnings is the foreign parents’ shares of the cumulative undistributed earnings of their incorporated U.S. affiliates. Unincorporated affiliates are wholly owned by their foreign parent and do not disaggregate equity into subcategories.
Foreign parent groups’ net outstanding loans to their U.S. affiliates, also referred to as the “debt instruments” position, consist of trade accounts and trade notes payable, other current liabilities, and long term debt owed by the affiliates to their foreign parents or other members of their foreign parent groups, net of similar items due to the affiliates from their foreign parents or other members of their foreign parent groups.
The debt instruments position includes the value of leases between U.S. affiliates and their foreign parent groups. The value of property leased to a U.S. affiliate by its foreign parent group is included in affiliates’ payables, and the value of property leased by a U.S. affiliate to the foreign parent group is included in affiliates’ receivables. The value of the leased property is calculated according to GAAP; under GAAP, the lessee records either the present value of the future lease payments or the fair market value, whichever is lower, and the lessor records the present value of future lease receipts.
For U.S. affiliates that are in the finance industry (including banking, excluding insurance) with foreign parents that are also in the finance industry, the foreign direct investment position is defined to include only their foreign parents’ equity investment in the affiliate and excludes debt. This treatment, which was introduced with the position statistics for 2007, follows the sixth edition of the Balance of Payments and International Investment Position Manual, issued by the International Monetary Fund, which recommends that all debt between affiliated financial intermediaries be removed from direct investment and be included in other investment accounts. Similarly, the direct investment transactions that enter the U.S. international transactions accounts for these affiliates exclude all debt investment and associated interest.
A foreign parent and its U.S. affiliate may have a two way financial relationship—each may have debt or equity investment in the other. Thus, a foreign parent may have investment in a U.S. affiliate that, in turn, has investment in the parent as a result of the affiliate’s lending funds to or acquiring voting securities or other equity interest in the parent. In addition, the other members of the foreign parent group may have debt investment in a U.S. affiliate, and a U.S. affiliate may have debt or equity investment in them. In the debt-instruments portion of the position, affiliates’ receivables from their foreign parent groups (reverse debt investment) are netted against affiliates’ payables to their foreign parent groups. Equity investment by U.S. affiliates in members of their foreign parent groups is included in the U.S. direct investment position abroad if the affiliate’s ownership is 10 percent or more and in the “portfolio investment” component of U.S. assets if the affiliate’s ownership is less than 10 percent.
The direct investment position at the end of the year is equal to the position at the end of the previous year plus the change in the position during the year (table 8). The change during the year is the sum of direct investment financial transactions (defined below) and other changes. Other changes primarily reflect differences between the transactions values, which are used to record direct investment financial flows, and the book values on U.S. affiliates’ books, which are used to record the position and, hence, changes in the position. For example, other changes include differences between the sale value and the book value of affiliates that are sold by foreign parents and differences between the purchase price and the book value of affiliates that are acquired by foreign parents32. They also include currency-translation adjustments—that is, the gains and losses that arise because of changes in the exchange rates used in translating affiliates’ foreign currency denominated assets and liabilities into U.S. dollars—and other capital gains and losses, such as revaluations of assets that result from mergers and acquisitions.
Direct investment financial transactions
Direct investment financial transactions arise from transactions that change U.S. affiliate claims (assets) and obligations (liabilities) toward their foreign parents or other members of their foreign parent groups. Direct investment financial transactions consist of equity other than reinvestment of earnings, reinvestment of earnings, and debt instruments. This section first defines these components and then discusses the coverage, measurement, and presentation of direct investment financial transactions.
Equity other than reinvestment of earnings. Equity other than reinvestment of earnings is the net of increases and decreases in foreign parent equity in their U.S. affiliates. It excludes changes in equity that result from the reinvestment of earnings, which are recorded as a separate component of direct investment financial transactions. Increases in equity other than reinvestment of earnings result from the foreign parents’ establishment of new U.S. affiliates, from initial acquisitions of a 10 percent or more ownership interest in existing U.S. businesses, from acquisitions of additional ownership interests in existing U.S. affiliates, and from capital contributions to U.S. affiliates. Decreases in equity other than reinvestment of earnings result from liquidations of U.S. affiliates, from partial or total sales of ownership interests in U.S. affiliates, and from the return of capital contributions. Decreases also include liquidating dividends, which are a return of capital to foreign parents. Decreases in equity other than reinvestment of earnings are netted against increases to derive net transactions in equity other than reinvestment of earnings.
Increases and decreases in equity other than reinvestment of earnings are recorded at transactions values. In most cases, transactions values may be obtained from the books of the U.S. affiliates. However, in some cases, such as when a foreign parent purchases or sells capital stock in the affiliate from or to an unaffiliated third party, the transactions value may be obtained only from the parent’s books. In addition, transactions values on foreign parents’ books reflect the actual cost of ownership interests in affiliates that are acquired or sold by foreign parents, including any premium or discount; such values may differ from the book values recorded on the affiliates’ books.
Reinvestment of earnings. Reinvestment of earnings of U.S. affiliates equals total earnings less distributed earnings. Earnings are foreign parents’ shares in the net income of their U.S. affiliates after provision for U.S. income taxes; earnings are from the books of the U.S. affiliate33. A foreign parent’s share in earnings is based on its directly held equity interest in the U.S. affiliate. The earnings and reinvestment of earnings estimates in this publication are not adjusted to reflect current period prices because the source data needed to adjust the estimates by detailed country and industry are not available.
Reinvestment of earnings is shown as a separate component of direct investment financial transactions in recognition of the fact that the earnings of a U.S. affiliate are income to the foreign parent and generate an entry in the direct investment income account, whether they are reinvested in the affiliate or remitted to the parent34. However, because reinvested earnings are not actually transferred to the foreign parent but increase the parent’s investment in its affiliate, an entry of equal magnitude, but opposite direction, is made in the direct investment financial account, offsetting the “reinvested earnings” entry made in direct investment income payments.
For incorporated U.S. affiliates, distributed earnings are dividends on common and preferred stock held by foreign parents. Distributions can be paid out of current or past earnings. Dividends exclude stock and liquidating dividends. Stock dividends are excluded because they are a capitalization of retained earnings—a substitution of one type of equity (capital stock) for another (retained earnings); they reduce the amount of retained earnings available for distribution but leave total owners’ equity unchanged. Thus, stock dividends do not give rise to entries in the international transactions accounts35. Liquidating dividends are excluded because they are a return of capital rather than a remittance of earnings (liquidating dividends are included as decreases in equity in the direct investment financial transactions). For unincorporated affiliates, distributed earnings are earnings distributed to foreign parents out of current or past earnings.
Distributed earnings, like total earnings, are based on the books of the U.S. affiliate. Because they are on an accrual basis, they are reported as of the date that they are either paid to foreign parents or entered into intercompany accounts with the foreign parents. Distributed earnings are included whether they are paid in cash, through debt creation, or in kind.
Debt instruments. Debt instrument transactions result from changes during the year in net outstanding loans between foreign parents (or other members of the foreign parent group) and their U.S. affiliates, including loans by foreign parent group members to affiliates and loans by affiliates to foreign parent group members. The change for a given period is derived by subtracting the U.S. affiliate’s net outstanding debt balance with its foreign parent group (that is, affiliate payables less affiliate receivables) at the end of the previous period from the net outstanding balance at the end of the current period.
When a member of a foreign parent group lends funds to a U.S. affiliate, the balance of the affiliate’s payables (amounts owed) to the foreign parent group increases; subsequently, when the affiliate repays the principal owed to a member of the foreign parent group, the balance of the affiliate’s payables to the group is reduced. Similarly, when a member of the foreign parent group borrows funds from a U.S. affiliate, the balance of the affiliate’s receivables (amounts due) from the group increases; subsequently, when the member of the group repays the principal owed to the affiliate, the balance of the affiliate’s receivables from the group is reduced36.
Increases in U.S. affiliates’ payables to or reductions in U.S. affiliates’ receivables from their foreign parent groups result in increases in U.S. affiliates’ net liabilities and give rise to inflows in debt instruments. Reductions in U.S. affiliates’ payables to or increases in U.S. affiliates’ receivables from their foreign parent groups result in decreases in U.S. affiliates’ net liabilities and give rise to outflows in debt instruments.
Not all debt instrument transactions reflect actual flows of funds. For example, when distributed earnings or interest from a U.S. affiliate accrue to a foreign parent group, the full amount is included as an income payment. If part of that amount is not actually transferred to the foreign parent group, the amount not transferred is entered into debt instruments as an increase in the U.S. affiliate’s payables to its foreign parent group.
Transactions in debt instruments include changes in the value of leases of more than 1 year between foreign parent groups and their U.S. affiliates. When property is leased by a U.S. affiliate from its foreign parent group, the value of the leased property is recorded as a liability of the U.S. affiliate because it increases its payables (a debt instruments inflow). The subsequent payment of principal on a lease is a return of capital and is recorded as a reduction in the U.S. affiliate’s liabilities because it reduces its payables (a debt instruments outflow). Similarly, when property is leased by a U.S. affiliate to its foreign parent group, the value of the leased property is recorded as an asset of the U.S. affiliate because it increases its receivables (a debt instruments outflow). The subsequent payment of principal on a lease is a return of capital and is recorded as a reduction in the U.S. affiliate’s assets because it reduces its receivables (a debt instruments inflow).
Coverage, measurement, and presentation. Equity and debt instrument investment mainly result from transactions between foreign parents (or, in the case of debt instrument investment, other foreign parent group members) and their U.S. affiliates. However, some investment may result from transactions between foreign parents and unaffiliated U.S. persons; for example, direct investment equity investment results from a transaction between a foreign parent and an unaffiliated U.S. person when the parent purchases an affiliate’s capital stock from the unaffiliated person.
In general, direct investment financial transactions exclude financing among members of a foreign parent group or between the members of the group and other foreigners, because foreign to foreign transactions are not international transactions of the United States. Thus, if a foreign parent purchases additional capital stock in a U.S. affiliate from another foreign person, the foreign parent’s ownership interest in the U.S. affiliate will increase, but no equity investment is recorded, because the transaction occurs entirely outside the United States. In addition, there is no net increase in foreign claims on the United States; instead, the foreign parent’s claims have merely been substituted for the claims of the other foreign person37.
However, if the foreign parent’s original interest only represented a less than 10 percent investment interest and if the combined interests qualify as a direct investment as a result of the purchase of an additional interest, a direct investment financial inflow equal to the value of the additional interest is recorded. In addition, a valuation adjustment is made to the direct investment position to bring the original interest into the position. If a foreign parent’s interest in an affiliate falls below 10 percent, a direct investment financial outflow is recorded and a valuation adjustment is made to extinguish the remaining direct investment interest. (In both cases, offsetting adjustments would be made to the “equity and investment fund shares” component of U.S. portfolio investment liabilities, so that the reclassification would not affect the overall U.S. international investment position.)
Equity and debt instrument investment can be disaggregated into several subaccounts. Equity other than reinvestment of earnings, which is recorded as a net amount, can be disaggregated to show increases and decreases in equity. Debt instrument transactions are disaggregated to show both the flows resulting from changes in U.S. affiliates’ payables and the flows resulting from changes in U.S. affiliates’ receivables. Certain transactions may affect two or more of these subaccounts simultaneously and by offsetting amounts. Such transactions are “grossed up;” that is, the inflows and the offsetting outflows are recorded in the affected subaccounts rather than being netted to zero and not recorded in any subaccount. However, because such gross flows are offsetting, they have no effect on net financial transactions. For example, the capitalization of debt instruments, which brings about a decrease in debt instrument investment (an outflow) and an offsetting increase in equity investment (an inflow), results in gross, but not net, transactions.
Direct investment income
Direct investment income is the return on the foreign direct investment position in the United States; that is, it is the foreign parents’ return on their equity and debt investments in their U.S. affiliates plus the return of other members of the foreign parent groups on their debt investments in the U.S. affiliates. Direct investment income consists of income on equity, or earnings, (that is, the foreign parent share in the net income of their U.S. affiliates) plus interest on intercompany accounts of U.S. affiliates with their foreign parent groups (interest is defined as the interest paid by U.S. affiliates to their foreign parent groups net of the interest received by U.S. affiliates from their foreign parent groups). Earnings are the foreign parents’ return on their equity investment, and interest is the foreign parent groups’ return on their debt investment in U.S. affiliates. Tables I. J5 and I. J6 show direct investment income and the relationships among its components for all U.S. affiliates from the 2017 benchmark survey.
Direct investment income is reported as accrued. Direct investment income and earnings exclude currency translation adjustments and other capital gains and losses, whether or not such gains and losses are included in net income for income statement purposes. This treatment is intended to make income and earnings correspond more closely to the current operating performance of affiliates as recommended by international guidelines for the compilation of balance-of-payments accounts.
Direct investment income is measured before deduction (that is, gross) of all U.S. and foreign withholding taxes38. This treatment views taxes as being levied upon the recipient of the distributed earnings or interest and thus as being paid across borders, even though, as an administrative convenience, the taxes actually were paid by the firm whose disbursements gave rise to them. Thus, U.S. withholding taxes on dividends and withdrawals and on interest received by the foreign parent group are recorded as if they were paid by the foreign parent group, not by the U.S. affiliate. Similarly, foreign withholding taxes on interest payments by the foreign parent group are recorded as if they were paid by the U.S. affiliate, not by the foreign parent group. Counterentries for these taxes are made in the U.S. international transactions accounts under “secondary income (current transfer) payments and receipts.”
Income on equity. Direct investment income on equity represents the foreign parents’ shares in the net income of their U.S. affiliates, after provision for U.S. income taxes. A parent’s share in net income is based on its directly held equity interest in the affiliate; a parent’s directly held debt in the affiliate is not considered in determining the parent’s share because debt is not an indication of ownership. The two major components of direct investment income on equity are dividends and withdrawals and reinvested earnings.
Dividends and withdrawals are distributed earnings allocated to the owners of a business for placing funds at the disposal of the business. For incorporated affiliates, they represent the payment of dividends to the owners of equity; they are the returns to the shareholders or owners. In addition to dividends from corporations, withdrawals from unincorporated affiliates are included in income on equity. From an economic point of view, the withdrawal of such income is equivalent to the distribution of corporate income through dividends.
Reinvested earnings are the earnings that remain after distributions have been made to the owners of the U.S. affiliate. They represent the net savings of the affiliate in the period. Because reinvested earnings, or net savings, represent an addition to the owners’ capital, an offsetting entry of equal magnitude is made in the direct investment component of the financial account. The offsetting entry is presented as reinvestment of earnings and is listed separately along with other transactions in equity and debt instruments as components of the owners’ investment in the enterprise.
Interest. Interest is recorded on a net basis as interest paid or credited to foreign parents and other members of the foreign parent groups on debt owed to them by U.S. affiliates less interest received from, or credited by, foreign parents and other members of the foreign parent groups on debt owed by them to U.S. affiliates39. Interest receipts are netted against interest payments because in the debt instruments component of the direct investment position, debt owed by foreign parent groups to U.S. affiliates is netted against debt owed by U.S. affiliates to foreign parent groups. Like other components of direct investment income, interest is reported as accrued. It includes interest paid through debt creation or in kind as well as interest paid in cash.
Interest includes net interest payments on leases between U.S. affiliates and their foreign parent groups because the outstanding capitalized value of such leases is included in the debt instruments component of the direct investment position40.
Data Availability
Detailed statistics of U.S. affiliate operations for 1977–2018 are available on BEA’s website. For information on these statistics and how to access them, see Activities of U.S. Affiliates of Multinational Enterprises (MNEs) on BEA’s Web page.
Staff Contacts
For additional information about the revised 2017 statistics, email internationalaccounts@bea.gov.
General Notes to the Tables
A U.S. affiliate is a U.S. business enterprise in which a single foreign person owns or controls, directly or indirectly, 10 percent or more of the voting securities if the enterprise is incorporated or an equivalent interest if the enterprise is unincorporated. “Person” is broadly defined to include any individual, corporation, branch, partnership, associated group, association, estate, trust, or other organization and any government (including any corporation, institution, or other entity or instrumentality of government). A “foreign person” is any person resident outside the United States—that is, outside the 50 States, the District of Columbia, the Commonwealth of Puerto Rico, and all U.S. territories and possessions.
A majority-owned U.S. affiliate is a U.S. affiliate that is owned more than 50 percent by foreign direct investors.
A foreign parent is the first person outside the United States in a U.S. affiliate’s ownership chain that has a direct investment interest in the affiliate.
The ultimate beneficial owner (UBO) is that person, proceeding up a chain of majority-ownership (where the entity above owns more than 50 percent of the entity below), beginning with and including the foreign parent of the U.S. affiliate, that is not owned more than 50 percent by another person. The UBO ultimately owns or controls, and thus ultimately derives the benefits and assumes the risks from owning or controlling, an affiliate. The country of the UBO is often the same as that of the foreign parent, but it may be a different country or the United States.
A foreign parent group consists of (1) the foreign parent, (2) any foreign person, proceeding up the foreign parent’s ownership chain, that owns more than 50 percent of the person below it, up to and including the UBO, and (3) any foreign person, proceeding down the ownership chains of each of these members, that is owned more than 50 percent by the person above it.
The statistics in this publication cover the universe of U.S. affiliates of foreign multinational enterprises. The one exception is number of U.S. affiliates, which cover affiliates with total assets, sales, or net income (or loss) of more than $20 million.
The statistics are on a fiscal year basis. The fiscal year of an affiliate is defined as the financial reporting year that ended in the calendar year. Unless otherwise specified, all balances are as of the close of fiscal year 2017.
To ascertain the subindustries in an industry group, see tables I.A 2 and II.A 2.
To ascertain the countries in a geographical area, see tables I.A 3 and II.A 3.
The European Union (28) comprises Austria, Belgium, Bulgaria, Croatia, Cyprus, the Czech Republic, Denmark, Estonia, Finland, France, Germany, Greece, Hungary, Ireland, Italy, Latvia, Lithuania, Luxembourg, Malta, the Netherlands, Poland, Portugal, Romania, Slovakia, Slovenia, Spain, Sweden, and the United Kingdom.
OPEC is the Organization of Petroleum Exporting Countries. In 2017, its members were Algeria, Angola, Ecuador, Equatorial Guinea, Gabon, Iran, Iraq, Kuwait, Libya, Nigeria, Qatar, Saudi Arabia, the United Arab Emirates, and Venezuela. The aggregate for OPEC was discontinued after the 2017 reference year.
The “United Kingdom Islands, Caribbean” consists of the British Virgin Islands, the Cayman Islands, Montserrat, and the Turks and Caicos Islands.
In the tables in which the data are disaggregated by state, “other U.S. areas” consists of the U.S. Virgin Islands, Guam, American Samoa, U.S. offshore oil and gas sites, and all other outlying U.S. areas. For employment, the “foreign” category consists of the employees of U.S. affiliates working abroad for more than 1 year. For property, plant, and equipment, the “foreign” category consists primarily of movable fixed assets temporarily located outside the United States; it excludes assets carried on the books of foreign affiliates.
In the tables in which the data are disaggregated by the industry of the ultimate beneficial owner, the industry “government and government related entities” consists of foreign governments, government owned or government-sponsored agencies, quasi government organizations, and government run pension funds.
An asterisk “(*)” indicates a nonzero value between −$500,000 and $500,000 or fewer than 50 employees.
Detail may not add to the total, because of rounding.
A “(D)” indicates that the data have been suppressed to avoid the disclosure of the data of individual companies. For employment cells that have been suppressed, a letter in the data cell indicates an employment size range; the ranges are indicated at the bottom of the tables.
Table Footnotes
Part I. All Affiliates
- Table I.A 1
- 1. This includes U.S. affiliates which are 100 percent directly owned by their foreign parent(s).
- 2. This includes U.S. affiliates in which the combined ownership of all foreign parents, either directly or indirectly, exceeds 50 percent, but the direct ownership is less than 100 percent.
- 3. This includes U.S. affiliates in which ownership by all foreign parents, either directly or indirectly, is less than 50 percent. Any affiliates that are 50 percent foreign-owned but are not 50 percent directly owned are also included in this category.
- 4. The affiliate number counts presented in this publication exclude very small affiliates—those with total assets, sales, and net income (or loss) all less than $20 million—that, in the 2017 benchmark survey, were only required to report basic identification information and a few measures of affiliate size. Values for all items other than number counts include estimates for such small affiliates.
- 5. The number of companies consolidated on the reports of affiliates generally is substantially higher than the number of affiliates because the report for a single affiliate may represent the consolidation of many companies.
- 6. Expenditures include the net book value of transfers of property, plant, and equipment to the affiliate from related companies.
- Tables I.A 4 and I.A 5
- 1. The affiliate number counts presented in this publication exclude very small affiliates—those with total assets, sales, and net income (or loss) all less than $20 million—that, in the 2017 benchmark survey, were only required to report basic identification information and a few measures of affiliate size. Values for data items other than number counts include estimates for such small affiliates. Thus, in industries or countries for which only a few affiliates are shown in the counts presented in this table, the corresponding totals for other data items include estimates for an additional number of such very small affiliates.
- 2. The number of companies consolidated on the reports of affiliates generally is substantially higher than the number of affiliates because the report for a single affiliate may represent the consolidation of many companies.
- Table I.A 9
- 1. This table shows the number of affiliates with total assets, sales, or net income (or loss) greater than $20 million that had employment. Statistics on employment shown in other tables in this publication include estimates for smaller affiliates. Thus, in states for which only a few affiliates are shown in the counts in this table, the corresponding totals for employment shown in other tables include estimates for an additional number of such very small affiliates.
- 2. A given affiliate is counted once in the all-U.S. total. It is also counted once in each state in which it has employment. Because an affiliate may have employment in more than one state, the sum across states exceeds the all-U.S. total.
- Table I.C 7
- 1. Includes aircraft, railroad rolling stock, satellites, undersea cable, and trucks engaged in interstate transportation.
- Table I.J 1 and I.J 2
- 1. These statistics are adjusted from a fiscal-year basis to a calendar-year basis before they are entered into the U.S. international investment position.
- 2. These statistics are adjusted from a historical-cost basis to a market-value basis before they are entered into the U.S. international investment position. These adjustments do not appear in the direct investment position tables that are disaggregated by industry or by country.
- 3. Consists of common or preferred stock owned by foreign parents, plus foreign parents’ equity in additional paid-in capital, less foreign parents’ equity in treasury stock held by their U.S. affiliates.
- 4. Foreign parents’ equity in retained earnings.
- 5. Includes foreign parents’ share of total owners’ equity of the unincorporated affiliates that did not provide a breakdown of equity by type and the foreign parents’ share in the cumulative amount of capital gains and losses associated with currency translations adjustments—that is, gains and losses that arise because of changes from the end of one accounting period to the next in the exchange rates applied in translating affiliates’ foreign-currency-denominated assets and liabilities into U.S. dollars—and in all other components of accumulated comprehensive income.
- Table I.J 3 and I.J 4
- 1. These statistics are adjusted from a fiscal-year basis to a calendar-year basis before they are entered into the U.S. international transactions accounts.
- 2. These statistics are adjusted to a current-cost basis before they are entered into the U.S. international accounts. These adjustments do not appear in the direct investment tables that are disaggregated by industry or by country.
- 3. Net increases or decreases in foreign parents’ equity in their U.S. affiliates, whether incorporated or unincorporated; excludes reinvestment of earnings.
- Table I.J 5 and I.J 6
- 1. These statistics are adjusted from a fiscal-year basis to a calendar-year basis before they are entered into the U.S. international transactions accounts.
- 2. These statistics are adjusted to a current-cost basis before they are entered into the U.S. international accounts. These adjustments do not appear in the direct investment tables that are disaggregated by industry or by country.
- 3. Excludes capital gains and losses.
- 4. Before deduction of withholding taxes.
Part II. Majority-Owned Affiliates
- Table II.A 1
- 1. The affiliate number counts presented in this publication exclude very small affiliates—those with total assets, sales, and net income (or loss) all less than $20 million—that, in the 2017 benchmark survey, were only required to report basic identification information and a few measures of affiliate size. Values for all items other than number counts include estimates for such small affiliates.
- 2. The number of companies consolidated on the reports of affiliates generally is substantially higher than the number of affiliates because the report for a single affiliate may represent the consolidation of many companies.
- 3. Expenditures include the net book value of transfers of property, plant, and equipment to the affiliate from related companies.
- 4. For most industries, goods supplied generally are defined as sales of outputs that are tangible. For wholesalers and retailers, goods supplied includes only the value of goods resold; BEA estimates the value of the distributive services affiliates provide by selling, or arranging for the sale of, goods and includes it in services supplied.
- 5. For most industries, services supplied generally are defined as sales of outputs that are intangible. For insurance, services supplied consists of BEA’s estimate of the portion of premiums remaining after provision for expected or “normal” losses and a measure of premium supplements, which represent income earned on funds insurers hold on policyholders’ behalf. For banks, it includes explicit fees and commissions and an estimate of the value of implicit services provided by banks. For wholesalers and retailers, services supplied includes an estimate of the distributive services affiliates provide by selling, or arranging for the sales of, goods.
- 6. “Other” consists largely of investment income that is included in “sales or gross operating revenues” in the income statement. In finance and insurance, affiliates include investment income in sales because it is generated by a primary activity of the company. For insurance, “other” consists of reported investment income less BEA’s estimate of premium supplements, which represent income earned on funds that insurers hold on policyholders’ behalf plus BEA’s estimate of premiums set aside for the settlement of expected or “normal” losses. For banking, “other” consists of the investment income remaining after BEA’s estimate of the value of implicit services provided by banks is excluded. (The values subtracted from and added to other sales in insurance and banking are added to and subtracted from, respectively, reported sales of services to calculate services supplied). For most affiliates in industries other than finance and insurance, investment income earned on secondary activities in finance and insurance is considered an incidental source of revenue; this income is therefore included in the income statement in a separate “other income” category, and is not included in the affiliates’ sales or on this line.
- 7. Profit-type return is an economic accounting measure of profits from current production. Unlike net income, it is gross of U.S. income taxes, excludes capital gains and losses and income from equity investments, and reflects certain other adjustments needed to convert profits from a financial accounting basis to an economic accounting basis.
- 8. Consists of all employees engaged in research and development, including managers, scientists, engineers, and other professional and technical employees.
- 9. Interest receipts exclude, but interest payments and dividends or remitted profits include, withholding taxes.
- Tables II.A 4 and II.A 5
- 1. The affiliate number counts presented in this publication exclude very small affiliates—those with total assets, sales, and net income (or loss) all less than $20 million—that, in the 2017 benchmark survey, were only required to report basic identification information and a few measures of affiliate size. Values for all items other than number counts include estimates for such small affiliates. Thus, in industries or countries for which only a few affiliates are shown in the counts presented in this table, the corresponding totals for other data items include estimates for an additional number of such very small affiliates.
- 2. The number of companies consolidated on the reports of affiliates generally is substantially higher than the number of affiliates because the report for a single affiliate may represent the consolidation of many companies.
- Table II.A 6
- 1. The affiliate number counts presented in this publication exclude very small affiliates—those with total assets, sales, and net income (or loss) all less than $20 million—that, in the 2017 benchmark survey, were only required to report basic identification information and a few measures of affiliate size. Values for all items other than number counts include estimates for such small affiliates. Thus, in industries for which only a few affiliates are shown in the counts presented in this table, the corresponding totals for other data items include estimates for an additional number of such very small affiliates.
- 2. The number of companies consolidated in the reports of affiliates generally is substantially higher than the number of affiliates because the report for a single affiliate may represent the consolidation of many companies.
- 3. Includes rental and leasing (except real estate); administrative and support services; waste management and remediation services; health care and social assistance; accommodation and food services; and miscellaneous services.
- Table II.A 8
- 1. For industry classification, each U.S. affiliate was required to disaggregate its sales by four-digit International Surveys Industry Classification codes; the affiliate was classified in the industry within its major group in which its sales were largest.
When sales and employment are disaggregated by industry of affiliate, total sales and employment of a given affiliate are shown in the industry in which the affiliate was classified. When sales and employment are disaggregated by industry of sales, they are distributed among all the industries in which the affiliate reported sales; that is, the sales and employment associated with each industry of sales are shown in that industry regardless of the affiliate’s industry of classification. - 2. Includes employees on the payrolls of administrative offices and other auxiliary units. Excludes administrative or auxiliary employees that are located at an operating unit and serve only that operating unit; these employees are classified in the industry of sales of the operating unit that they serve.
- 3. In the breakdown of sales and employment by industry of sales, U.S. affiliates that filed Form BE-12A had to specify their ten largest sales categories, and U.S. affiliates that filed Form BE-12B had to specify their four largest sales categories. In addition, affiliates were required to report their employment in auxiliaries. This line shows sales and employment in all unspecified industries combined.
- 1. For industry classification, each U.S. affiliate was required to disaggregate its sales by four-digit International Surveys Industry Classification codes; the affiliate was classified in the industry within its major group in which its sales were largest.
- Table II.A 9
- 1. This table shows the number of affiliates with total assets, sales, or net income (or loss) greater than $20 million that had employment. Statistics on employment shown in other tables in this publication include estimates for smaller affiliates. Thus, in states for which only a few affiliates are shown in the counts in this table, the corresponding totals for employment shown in other tables include estimates for an additional number of such very small affiliates.
- 2. A given affiliate is counted once in the all-U.S. total. It is also counted once in each state in which it has employment. Because an affiliate may have employment in more than one state, the sum across states exceeds the all-U.S. total.
- Tables II.A 10 and II.A 11
- 1. The affiliate number counts presented in this publication exclude very small affiliates—those with total assets, sales, and net income (or loss) all less than $20 million—that, in the 2017 benchmark survey, were only required to report basic identification information and a few measures of affiliate size. Values for all items other than number counts include estimates for such small affiliates. Thus, in industries or countries for which only a few affiliates are shown in the counts presented in this table, the corresponding totals for other data items include estimates for an additional number of such very small affiliates.
- 2. The number of companies consolidated on the reports of affiliates generally is substantially higher than the number of affiliates because the report for a single affiliate may represent the consolidation of many companies.
- Tables II.B 1 and II.B 2
- 1. Includes common and preferred stock and additional paid-in capital, less treasury stock.
- 2. Includes cumulative translation adjustments and all other components of accumulated comprehensive income for all affiliates and total owners’ equity of those unincorporated affiliates that could not provide detail on equity by type. For all affiliates combined, cumulative translation adjustments as of yearend 2017 were negative $22.4 billion.
- Table II.C 4
- 1. Includes the net book value of transfers of property, plant, and equipment to the affiliate from related companies.
- 2. Includes transfers of property, plant, and equipment from the affiliate to related companies.
- 3. Consists of the following: 1) Restatements resulting from a change in the entity, and revaluations of property, plant, and equipment to a fair market or appraised value and 2) the property, plant, and equipment balance on the date of acquisition of majority-owned affiliates that were acquired during the year, less the closing FY 2016 balance of affiliates that left the universe of majority-owned affiliates in 2017 because they were sold or liquidated or because the foreign parents’ interest was otherwise reduced to 50 percent or less.
- 4. The “net property, plant, and equipment” category on this line differs from that in column 4 of tables II.B 1 and II.B 2. Net property, plant, and equipment on this line covers all property, plant, and equipment wherever carried in the balance sheet, including that carried in the “property, plant, and equipment” account, the “other assets” account, and the “inventories” account. In contrast, net property, plant, and equipment in column 4 of tables II.B 1 and II.B 2 covers only property, plant, and equipment carried in the “property, plant, and equipment” account of the balance sheet. For example, the value of commercial buildings held by insurance companies for investment purposes is included on this line but excluded from column 4 of tables II.B 1 and II.B 2 because such property is normally carried in the “other assets” account of the balance sheet, not in the “property, plant, and equipment” account.
- Tables II.C 5 and II.C 6
- 1. Consists of the gross book value of all commercial buildings and associated land that are owned by the affiliate and that are either used or operated by the affiliate or leased or rented to others. Commercial buildings include apartment buildings, office buildings, hotels, motels, and buildings used for wholesale, retail, and services trades, such as shopping centers, recreational facilities, department stores, bank buildings, restaurants, public garages, and automobile service stations.
- 2. Includes the gross book value of property, plant, and equipment used for agriculture and forestry, mining, manufacturing, or other industrial purposes. Also includes the gross book value of equipment used in commercial buildings.
- Table II.C 7
- 1. Consists of the gross book value of all commercial buildings and associated land that are owned by the affiliate and that are either used or operated by the affiliate or leased or rented to others. Commercial buildings include apartment buildings, office buildings, hotels, motels, and buildings used for wholesale, retail, and services trades, such as shopping centers, recreational facilities, department stores, bank buildings, restaurants, public garages, and automobile service stations.
- 2. Includes the gross book value of property, plant, and equipment used for agriculture and forestry, mining, manufacturing, or other industrial purposes. Also includes the gross book value of equipment used in commercial buildings.
- 3. Includes aircraft, railroad rolling stock, satellites, undersea cable, and trucks engaged in interstate transportation.
- Table II.C 8
- 1. All data for a given U.S. affiliate are shown in the single industry in which the affiliate was classified on the basis of its total U.S. operations. The affiliate’s activity in a particular state may differ from that of its total U.S. operations.
- 2. Includes aircraft, railroad rolling stock, satellites, undersea cable, and trucks engaged in interstate transportation.
- Tables II.C 9 and II.C 10
- 1. Includes aircraft, railroad rolling stock, satellites, undersea cable, and trucks engaged in interstate transportation.
- Table II.C 11
- 1. Consists of the gross book value of all commercial buildings and associated land that are owned by the affiliate and that are either used or operated by the affiliate or leased or rented to others. Commercial buildings include apartment buildings, office buildings, hotels, motels, and buildings used for wholesale, retail, and services trades, such as shopping centers, recreational facilities, department stores, bank buildings, restaurants, public garages, and automobile service stations.
- Table II.C 12
- 1. Consists of the gross book value of all commercial buildings and associated land that are owned by the affiliate and that are either used or operated by the affiliate or leased or rented to others. Commercial buildings include apartment buildings, office buildings, hotels, motels, and buildings used for wholesale, retail, and services trades, such as shopping centers, recreational facilities, department stores, bank buildings, restaurants, public garages, and automobile service stations.
All data for a given U.S. affiliate are shown in the single industry in which the affiliate was classified on the basis of its total U.S. operations. The affiliate’s activity in a particular state may differ from that of its total U.S. operations.
- 1. Consists of the gross book value of all commercial buildings and associated land that are owned by the affiliate and that are either used or operated by the affiliate or leased or rented to others. Commercial buildings include apartment buildings, office buildings, hotels, motels, and buildings used for wholesale, retail, and services trades, such as shopping centers, recreational facilities, department stores, bank buildings, restaurants, public garages, and automobile service stations.
- Table II.C 13
- 1. Consists of the gross book value of all commercial buildings and associated land that are owned by the affiliate and that are either used or operated by the affiliate or leased or rented to others. Commercial buildings include apartment buildings, office buildings, hotels, motels, and buildings used for wholesale, retail, and services trades, such as shopping centers, recreational facilities, department stores, bank buildings, restaurants, public garages, and automobile service stations.
- Table II.C 14
- 1. This table shows the number of affiliates with total assets, sales, or net income (or loss) greater than $20 million that had property, plant, and equipment. Statistics on the value of property, plant, and equipment shown in other tables in this publication include estimates for smaller affiliates. Thus, in states for which only a few affiliates are shown in the counts in this table, the corresponding totals for the value of property, plant, and equipment shown in other tables include estimates for an additional number of such very small affiliates.
- 2. A given affiliate is counted once in the all-U.S. total; it is also counted once in each state in which it has property, plant, and equipment. Because an affiliate may have property, plant, and equipment in more than one state, the sum across states exceeds the all-U.S. total.
- 3. Includes aircraft, railroad rolling stock, satellites, undersea cable, and trucks engaged in interstate transportation.
- Table II.C 15
- 1. This table shows the number of affiliates with total assets, sales, or net income (or loss) greater than $20 million that had property, plant, and equipment. Statistics on the value of property, plant, and equipment shown in other tables in this publication include estimates for smaller affiliates. Thus, in states for which only a few affiliates are shown in the counts in this table, the corresponding totals for the value of property, plant, and equipment shown in other tables include estimates for an additional number of such very small affiliates.
- 2. A given affiliate is counted once in the total for both use categories combined; it is also counted once in each use category in which it has property, plant, and equipment. Because an affiliate may have property, plant, and equipment in both use categories, the sum across use categories exceeds the total for both use categories combined.
- 3. Consists of affiliates with commercial property. Commercial property comprises all commercial buildings and associated land owned by the affiliate that are either used or operated by the affiliate or leased or rented to others. Commercial buildings include apartment buildings, office buildings, hotels, motels, and buildings used for wholesale, retail, and services trades, such as shopping centers, recreational facilities, department stores, bank buildings, restaurants, public garages, and automobile service stations.
- 4. Consists of affiliates with property, plant, and equipment used for agriculture, mining, manufacturing, or other industrial purposes.
- 5. A given affiliate is counted once in the all-U.S. total; it is also counted once in each state in which it has property, plant, and equipment. Because an affiliate may have property, plant, and equipment in more than one state, the sum across states exceeds the all-U.S. total.
- 6. Includes aircraft, railroad rolling stock, satellites, undersea cable, and trucks engaged in interstate transportation.
- Table II.C 16
- 1. Includes the net book value of transfers of property, plant, and equipment to the affiliate from related companies.
- Table II.C 17
- 1. Includes the net book value of transfers of plant and equipment to the affiliate from related companies.
- Tables II.D 1 and II.D 2
- 1. Consists of gains or losses resulting from the sale or other disposition of assets, changes in the dollar value of the affiliates’ foreign-currency-denominated assets and liabilities that are caused by changes in exchange rates, and all other unusual or nonrecurring gains or losses, including those resulting from the revaluation of assets, whether realized or not.
- Tables II.D 7 and II.D 8
- 1. For industry classification, each U.S. affiliate was required to disaggregate its sales by four-digit International Surveys Industry Classification codes; the affiliate was classified in the industry in which its sales were largest.
When sales are disaggregated by industry of affiliate, total sales of a given affiliate are shown in the industry in which the affiliate was classified. When sales are disaggregated by industry of sales, they are distributed among all the industries in which the affiliate reported sales; that is, sales associated with each industry of sales are shown in that industry regardless of the affiliate’s industry of classification. - 2. In the breakdown of sales by industry of sales, U.S. affiliates that filed Form BE–12A had to specify their ten largest sales categories, and U.S. affiliates that filed Form BE–12B had to specify their four largest sales categories. Sales in all unspecified industries combined are shown on this line.
- 1. For industry classification, each U.S. affiliate was required to disaggregate its sales by four-digit International Surveys Industry Classification codes; the affiliate was classified in the industry in which its sales were largest.
- Table II.D 9
- 1. For industry classification, each U.S. affiliate was required to disaggregate its sales by four-digit International Surveys Industry Classification codes; the affiliate was classified in the industry in which its sales were largest.
When sales are disaggregated by industry of affiliate, total sales of a given affiliate are shown in the industry in which the affiliate was classified. When sales are disaggregated by industry of sales, they are distributed among all the industries in which the affiliate reported sales; that is, sales associated with each industry of sales are shown in that industry regardless of the affiliate’s industry of classification. - 2. Includes sales in all unspecified industries, which are not shown in a separate column in this table. The all-industries total in this column thus exceeds the sum across the industries shown in this table by the amount of sales in all unspecified industries.
- 1. For industry classification, each U.S. affiliate was required to disaggregate its sales by four-digit International Surveys Industry Classification codes; the affiliate was classified in the industry in which its sales were largest.
- Tables II.E 1 and II.E 2
- 1. Goods supplied are generally defined as sales of economic outputs that are tangible. For sales in wholesale and retail trade, goods supplied include only the value of goods resold; they consist of reported sales of goods less BEA’s estimate of the value of the distributive services provided by selling, or arranging for the sale of, goods (this estimate is added to reported sales of services to calculate services supplied).
- 2. Services supplied are generally defined as sales of economic outputs that are intangible. For sales in insurance, services supplied consist of reported premiums less BEA’s estimates of the premiums set aside for expected or “normal” losses plus a measure of premium supplements, which represent income earned on funds that insurers hold on policyholders’ behalf. For sales in banking, services supplied include not only the explicit fees and commissions reported as sales but also BEA’s estimate of the value of implicit services provided by banks. (The values subtracted from and added to sales of services in insurance and banking are added to and subtracted from, respectively, reported values of other income.) For sales in wholesale and retail trade, services supplied include BEA’s estimate of the value of the distributive services provided by selling, or arranging for the sales of, goods (this estimate is subtracted from reported sales of goods to calculate goods supplied). For industries other than insurance, banking, and wholesale and retail trade, services supplied consist of reported sales of services.
- 3. “Other” consists largely of investment income that is included in “sales or gross operating revenues” in the income statement. In finance and insurance, affiliates include investment income in sales because it is generated by a primary activity of the company. For insurance, “other” consists of reported investment income less BEA’s estimate of premium supplements, which represent income earned on funds that insurers hold on policyholders’ behalf plus BEA’s estimate of premiums set aside for the settlement of expected or “normal” losses. For banking, “other” consists of the investment income remaining after BEA’s estimate of the value of implicit services provided by banks is excluded. (The values subtracted from and added to other sales in insurance and banking are added to and subtracted from, respectively, reported sales of services to calculate services supplied). For most affiliates in industries other than finance and insurance, investment income earned on secondary activities in finance and insurance is considered an incidental source of revenue; this income is therefore included in the income statement in a separate “other income” category, and is not included in the affiliates’ sales or in this column.
- 4. Services supplied to other U.S. affiliates include only services supplied to U.S. affiliates owned by the same foreign parent group as the supplying U.S. affiliate. Services supplied to U.S. affiliates not owned by the same foreign parent group as the supplying U.S. affiliate are included in the column for unaffiliated U.S. persons.
- 5. Services supplied to the foreign parent group include only services supplied to the foreign parent group of the supplying U.S. affiliate. Services supplied to members of foreign parent groups that do not own the supplying U.S. affiliate are not included.
- 6. Services supplied to foreign affiliates include only services supplied to foreign affiliates owned by the supplying U.S. affiliate. Services supplied to foreign affiliates that are not owned by the supplying U.S. affiliate are not included.
- Table II.E 3
- 1. Goods supplied are generally defined as sales of economic outputs that are tangible. For sales in wholesale and retail trade, goods supplied include only the value of goods resold; they consist of reported sales of goods less BEA’s estimate of the value of the distributive services provided by selling, or arranging for the sale of, goods (this estimate is added to reported sales of services to calculate services supplied).
- Table II.E 4
- 1. Services supplied are generally defined as sales of economic outputs that are intangible. For sales in insurance, services supplied consist of reported premiums less BEA’s estimates of the premiums set aside for expected or “normal” losses plus a measure of premium supplements, which represent income earned on funds that insurers hold on policyholders’ behalf. For sales in banking, services supplied include not only the explicit fees and commissions reported as sales but also BEA’s estimate of the value of implicit services provided by banks. (The values subtracted from and added to sales of services in insurance and banking are added to and subtracted from, respectively, reported values of other income.) For sales in wholesale and retail trade, services supplied include BEA’s estimate of the value of the distributive services provided by selling, or arranging for the sales of, goods (this estimate is subtracted from reported sales of goods to calculate goods supplied). For industries other than insurance, banking, and wholesale and retail trade, services supplied consist of reported sales of services.
- Table II.F 1
- 1. Profit-type return is an economic accounting measure of profits from current production. Unlike net income, it is gross of U.S. income taxes, excludes capital gains and losses and income from equity investments, and reflects certain other adjustments needed to convert profits from a financial accounting basis to an economic accounting basis.
- 2. Equals interest payments (column 2 in table II.I 1), plus imputed interest paid, minus interest receipts (column 1 in table II.I 1), minus imputed interest received. Imputed interest paid and received, which correspond to measures of the value of services provided by life insurance carriers and financial intermediaries without explicit charge, are estimated.
- 3. Equals column 4 in table II.I 1.
- Table II.F 6
- 1. Profit-type return is an economic accounting measure of profits from current production. Unlike net income, it is gross of U.S. income taxes, excludes capital gains and losses and income from equity investments, and reflects certain other adjustments needed to convert profits from a financial accounting basis to an economic accounting basis.
- Tables II.G 1 and II.G 2
- 1. Consists of all employees engaged in research and development, including managers, scientists, engineers, and other professional and technical employees.
- Table II.G 7
- 1. All data for a given U.S. affiliate are shown in the single industry in which the affiliate was classified on the basis of its total U.S. operations. The affiliate’s activity in a particular state may differ from that of its total U.S. operations.
- Tables II.G 10 and II.G 11
- 1. For industry classification, each U.S. affiliate was required to disaggregate its sales by four-digit International Surveys Industry Classification codes; the affiliate was classified in the industry in which its sales were largest.
When employment is disaggregated by industry of affiliate, total employment of a given affiliate is shown in the industry in which the affiliate was classified; when employment is disaggregated by industry of sales, it is distributed among all the industries in which the affiliate reported sales; that is, the number of employees associated with each industry of sales is shown in that industry regardless of the affiliate’s industry of classification. - 2. Includes employees on the payrolls of administrative offices and other auxiliary units. Excludes administrative or auxiliary employees that are located at an operating unit and serve only that operating unit; these employees are classified in the industry of sales of the operating unit that they serve.
- 3. In the breakdown of sales and employment by industry of sales, U.S. affiliates that filed Form BE–12A had to specify their ten largest sales categories, and U.S. affiliates that filed Form BE–12B had to specify their four largest sales categories. In addition, affiliates were required to report their employment in administrative offices and other auxiliary units. Employment in all unspecified industries combined is shown on this line.
- 1. For industry classification, each U.S. affiliate was required to disaggregate its sales by four-digit International Surveys Industry Classification codes; the affiliate was classified in the industry in which its sales were largest.
- Table II.G 12
- 1. For industry classification, each U.S. affiliate was required to disaggregate its sales by four-digit International Surveys Industry Classification codes; the affiliate was classified in the industry within its major group in which its sales were largest.
When employment is disaggregated by industry of affiliate, total employment of a given affiliate is shown in the industry in which the affiliate was classified; when employment is disaggregated by industry of sales, it is distributed among all the industries in which the affiliate reported sales; that is, the number of employees associated with each industry of sales is shown in that industry regardless of the affiliate’s industry of classification. - 2. Includes employment in auxiliaries and in all unspecified industries, which are not shown in separate columns in this table. The all-industries total in this column thus exceeds the sum across the industries shown in this table by the amount of employment in auxiliaries and in all unspecified industries.
- 1. For industry classification, each U.S. affiliate was required to disaggregate its sales by four-digit International Surveys Industry Classification codes; the affiliate was classified in the industry within its major group in which its sales were largest.
- Table II.G 13
- 1. Manufacturing employees are employees on the payroll of manufacturing plants located in the state. Manufacturing employment includes administrative office and other auxiliary employees located at a manufacturing plant that serve only that plant, but excludes all other employees on the payrolls of administrative offices or other auxiliary units.
- Table II.G 14
- 1. Consists of all employees engaged in research and development, including managers, scientists, engineers, and other professional and technical employees.
- Table II.G 16
- 1. This table shows the number of affiliates with total assets, sales, or net income (or loss) greater than $20 million that had employment. Statistics on employment shown in other tables in this publication include estimates for smaller affiliates. Thus, in states for which only a few affiliates are shown in the counts in this table, the corresponding totals for employment shown in other tables include estimates for an additional number of such very small affiliates.
- 2. A given affiliate is counted once in the all-U.S. total; it is also counted once in each state in which it has employment. Because an affiliate may have employment in more than one state, the sum across states exceeds the all-U.S. total.
- Tables II.H 1 and II.H 2
- 1. Consists of exports to, or imports from, foreign business enterprises in which the U.S. affiliate has a 10 percent or more voting ownership interest.
- Tables II.H 9 and II.H 21
- 1. A U.S. affiliate was required to disaggregate its U.S. exports and imports by country of destination or origin only for those countries to which its exports, or from which its imports, were $500,000 or more. Its exports to, or imports from, all other countries were reported as a single item and are classified in “unallocated.” For estimated reports, exports to, and imports from, unaffiliated foreigners could not be distributed by country of destination or origin and are thus included in this category.
- Tables II.H 22 and II.H 23
- 1. Consists of imports from foreign business enterprises in which the U.S. affiliate has a 10 percent or more voting ownership interest.
- 2. Consists of imports of capital equipment and other goods that are intended for use by the affiliate itself and that are charged to the affiliate’s property, plant, and equipment account (rather than expensed or added to inventories).
- Tables II.I 1 and II.I 2
- 1. Interest receipts exclude, but interest payments and dividends or remitted profits include, withholding taxes.
- Tables II.I 4 and II.I 5
- 1. Consists of research and development performed for foreign business enterprises in which the U.S. affiliate has a 10 percent or more voting ownership interest.
- Public Law 472, 94th Congress, 90 stat. 2059, 22 U.S.C. 3101–3108, as amended.
- Available from Foreign Direct Investment in the United States: Final Results from the 2012 Benchmark Survey.
- To be classified as a U.S. affiliate, however, the foreign share of ownership in the enterprise must be equal to 10 percent or more of the voting securities if the enterprise is incorporated or an equivalent interest if the enterprise is unincorporated; see the definition of direct investment in the section “Concepts and Definitions.”
- See, for example, Robert E. Lipsey, “Foreign Direct Investment and the Operations of Multinational Firms: Concepts, History, and Data,” in Handbook of International Trade, ed. Kwan Choi and James Harrigan (Oxford, United Kingdom: Basil Blackwell, 2003).
- Estimates for nonbenchmark survey years from BEA’s annual surveys provide information similar to estimates for benchmark survey years from the benchmark surveys, but they are less detailed.
- These data can be accessed from BEA’s website.
- Private Fund (PF) refers to the same class of financial entities defined by the Securities and Exchange Commission as private funds on Form PF: “any issuer that would be an investment company as defined in section 3 of the Investment Company Act of 1940 but for section 3(c)(1) or 3(c)(7) of … [that] Act.” Additional information is available from BEA’s website.
- See International Monetary Fund (IMF), Balance of Payments and International Investment Position Manual, 6th ed. (Washington, DC: IMF, 2009); and Organisation for Economic Co-operation and Development (OECD), OECD Benchmark Definition of Foreign Direct Investment, 4th ed. (Paris: OECD, 2008).
- UBOs that are individuals were not required to be identified by name; however, their countries of location were required.
- Another type of transaction—trade in goods between affiliates and members of their foreign parent groups—is also included in the U.S. international transactions accounts, but it is not shown separately. Separate data on such trade, however, were obtained in the benchmark survey as part of the U.S. affiliate activities data; see the section “Activities Data.”
- This definition is equivalent to the OECD’s definition of the “ultimate investor”; see OECD Benchmark Definition of Foreign Direct Investment, 4th ed., Annex 10, p. 208.
- A major difference between international financial reporting standards (IFRS) and Generally Accepted Accounting Principles (GAAP) is the more extensive use under IFRS of fair value accounting—as opposed to valuation at historical cost—in valuing assets or liabilities. Fair value accounting is the valuing of assets or liabilities at current market prices or fair market value rather than at purchase prices (historical cost); see footnote 43.
- Additional information on BEA’s Special Sworn Researcher Program is available on BEA’s website.
- Further information on the international surveys industry classification system used is available on BEA’s website.
- The following example illustrates the three-stage classification procedure. Suppose an affiliate’s sales were distributed as follows:
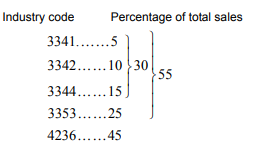
where industry codes 3341, 3342, 3344, and 3353 are in the manufacturing sector and code 4236 is in the wholesale trade sector. Because 55 percent of the affiliate’s sales were in manufacturing and only 45 percent were in wholesale trade, the affiliate’s sector is manufacturing. Because the largest share of its sales within manufacturing is in the three-digit subsector 334 (computers and electronic products, which includes industry codes 3341, 3342, and 3344), the affiliate’s three-digit subsector is 334. Finally, because its sales within subsector 334 were largest in industry 3344, the affiliate’s four-digit industry is 3344 (semiconductors and other electronic components). Thus, the affiliate was assigned to industry 3344, even though its sales in that industry were smaller than its sales in either industry 4236 or industry 3353. - Specifically, large majority-owned U.S. affiliates (those with total assets, sales, or net income greater than $300 million) had to specify their sales and employment in the 10 industries in which their sales were largest; medium-sized majority-owned affiliates (those with assets, sales, or net income greater than $60 million but not greater than $300 million) had to specify their sales in the 4 industries in which their sales were largest. For majority-owned affiliates, affiliate sales and employment in all other industries are shown in the “unspecified” row in tables II.A 8, II.D 7, II.D 8, II.G 10, and II.G 11.
- These data are available on BEA’s website.
- As noted in the section “Accounting Principles,” the accounting records of some U.S. affiliates are based on IFRS rather than GAAP.
In the U.S. national income and product accounts, two measures of depreciation, or capital consumption, are used—the capital consumption allowance and consumption of fixed capital. The capital consumption allowance (CCA) consists of depreciation charges, which are based largely on tax returns, and allowances for accidental damage to fixed capital. Consumption of fixed capital consists of CCA plus an adjustment to place depreciation on an economic basis that uses economic service lives, depreciation that follows a geometric pattern, and replacement-cost valuation.
For U.S. affiliates, the only measure of capital consumption available from BEA’s survey data is the book value of depreciation, reported on a basis consistent with GAAP. Because this measure does not provide for replacement cost valuation, it is termed the “capital consumption allowance” in this publication (see table II.F 1).
The basis used to measure depreciation has no effect on the measurement of total value added; any differences between the measures of depreciation, which is a cost of production, have equal and offsetting effects on the profit type return component.
- Statistics on services supplied though U.S. affiliates are presented together with statistics on services supplied through foreign affiliates and on trade in services as part of BEA’s International Services (Expanded Detail) dataset.
- Tangible outputs are typically associated with establishments in the following six North American Industry Classification System (NAICS) sectors: agriculture, forestry, fishing, and hunting (except support activities for agriculture and forestry); mining (except support activities); construction; manufacturing; wholesale trade; and retail trade. Intangible outputs are typically associated with establishments in the 14 other NAICS sectors—utilities; transportation and warehousing; information; finance and insurance; real estate and rental and leasing; professional, scientific, and technical services; management of companies and enterprises; administrative and support and waste management and remediation services; educational services; health care and social assistance; arts, entertainment, and recreation; accommodation and food services; other services (except public administration); and public administration—and with establishments that provide support activities for agriculture and forestry and for mining.
- See Obie G. Whichard and Maria Borga, “Selected Issues in the Measurement of International Services,” Survey of Current Business 82 (June 2002): 36–56.
- The implicit service charges reduce the rate paid to depositors, who forego some interest in exchange for services, and increase the rates charged to borrowers. These implicitly priced services include processing of checks and electronic payments, disbursing or transferring funds when and where needed, protecting deposited funds, bookkeeping, bill payment, check cashing, investment services, screening and monitoring borrowers, and loan underwriting. See Kyle K. Hood, “Alternative Measures of Implicitly Priced Financial Services of Savings Institutions and Credit Unions,” Survey 91 (November 2013): 27–35.
- Employee compensation rates are better measured by hourly wage rates, which do not suffer from these shortcomings. Data on hourly wage rates for foreign-owned U.S. businesses are available for selected years as a result of several projects linking BEA’s enterprise data on foreign direct investment in the United States with more detailed establishment data from the U.S. Census Bureau and the Bureau of Labor Statistics, see footnote 6.
- In this publication, the direct investment position and transactions data are presented according to the directional principle, which focuses on the direction of the direct investment relationship. For a discussion of the directional principle and its contrast with the asset and liability presentation of direct investment data, see IMF, Balance of Payments and International Investment Position Manual, 6th ed., pp. 107–109. See also Marilyn Ibarra-Caton and Raymond J. Mataloni, “Direct Investment Positions for 2013: Country and Industry Detail,” Survey 94 (July 2014).
- To illustrate, suppose that an affiliate is owned 80 percent by its foreign parent and that the affiliate has total owners’ equity of $50 million and total liabilities of $100 million, of which $20 million is owed to the parent. In this case, the affiliate’s total assets would be $150 million (total owners’ equity of $50 million plus total liabilities of $100 million), and the parents’ position in the affiliate would be $60 million (80 percent of the $50 million of owners’ equity plus the $20 million of intercompany debt). Most affiliates, however, are 100 percent directly owned by their foreign parents (see Table I.A 1).
- The adjustments are made only at the global level; the source data needed to adjust the estimates by detailed country and industry are not available. The adjustment converts depreciation reported for financial accounting purposes to a measure more consistent with economic accounting principles. The adjustment converts depreciation valued at historical cost to current (replacement) cost and adds depletion of natural resources back to earnings for consistency with national economic accounts.
- As noted in the section on coverage, the universe estimates in the U.S. international transactions accounts include transactions for affiliates that were liquidated or sold during a given calendar year. In contrast, the direct investment transactions data collected in the 2017 benchmark survey and presented in these statistics do not cover transactions for enterprises that were no longer U.S. affiliates at the end of the 2017 fiscal year.
In recent years, however, use of fair value accounting—under which assets and liabilities are valued at current market prices or fair market value rather than at historical cost—has become more prevalent among companies reporting in BEA’s direct investment surveys. This shift reflects changes to GAAP and a growing number of respondents using other accounting standards, such as IFRS.
GAAP is shifting to allow or require more types of assets and liabilities to be recorded at fair value. In the past, most data reported on BEA’s surveys was valued at historical cost and use of fair value accounting was very limited (it was primarily used to record debt and equity securities held for trading purposes). GAAP now allows more types of financial assets and liabilities to be recorded at fair value and requires business combinations to be recorded at fair value. IFRS goes further than GAAP by allowing fixed assets to be recorded at fair value. As a result, many companies have balance sheets that include both fair value and historical cost valuations.
- Estimates of the U.S. direct investment position on an asset/liability basis measured at market value are published each quarter as part of the U.S. International Investment Position.
- The foreign parent group can have debt positions, but not equity positions, in U.S. affiliates that they indirectly own through another U.S. affiliate.
- For the current-price estimates of the foreign direct investment position entered in the U.S. international investment position, the corresponding adjustments would reflect differences between the transactions values and the estimated current values of the affiliates.
- As discussed in the next section, “Direct investment income,” earnings exclude capital gains and losses, whether or not such gains and losses are included in net income for income statement purposes.
- See the next section, “Direct investment income.”
- “Stock dividends” are used here to refer to essentially the same concept that is discussed in IMF, Balance of Payments and International Investment Position Manual, 6th ed. (see footnote 11) under the heading of “bonus shares.” BEA has retained its terminology because it conforms to what U.S. firms understand by the term “stock dividends.”
- Following the recommendations in IMF, Balance of Payments and International Investment Position Manual, 6th ed., all debt transactions between affiliated bank or finance companies (excluding insurance companies) are excluded from intercompany debt inflows.
- If this exchange involves more than one country, offsetting valuation adjustments are made to the direct investment position, reducing the position of the seller’s country and increasing the position of the purchaser’s country.
- Withholding taxes are taxes withheld at the source on income or other funds that are distributed or remitted.
- For U.S. affiliates that are depository institutions (commercial banks, savings and loan institutions, and credit unions) and for nonbank affiliates that are primarily engaged in financial intermediation, all interest on intercompany debt is excluded from direct investment income payments. The treatment of interest for these affiliates parallels the treatment of their debt transactions with their foreign parent groups, as described in the section “Foreign direct investment position in the United States.”
- Although the value of operating leases of more than 1 year is also included in the intercompany debt position, payments of net rent (which covers interest, administrative expenses, and profit) on such leases are recorded as charges for the use of tangible property (part of the services account in the ITAs) rather than as interest.