
Posted: May 2024
As an early barometer of spending in the United States, BEA has been researching the use of card transaction data. These data, available in near real time, can be used to develop more timely and granular estimates of spending than can be produced from the government's monthly surveys. Estimates based on these data from credit card, debit card, and gift card transactions are presented below.
Note that these payment card transactions are not necessarily representative of total spending in an industry and the data have other limitations, described below. These estimates are not a substitute for BEA's monthly and quarterly official data, which are grounded in well-tested and proven methodologies.
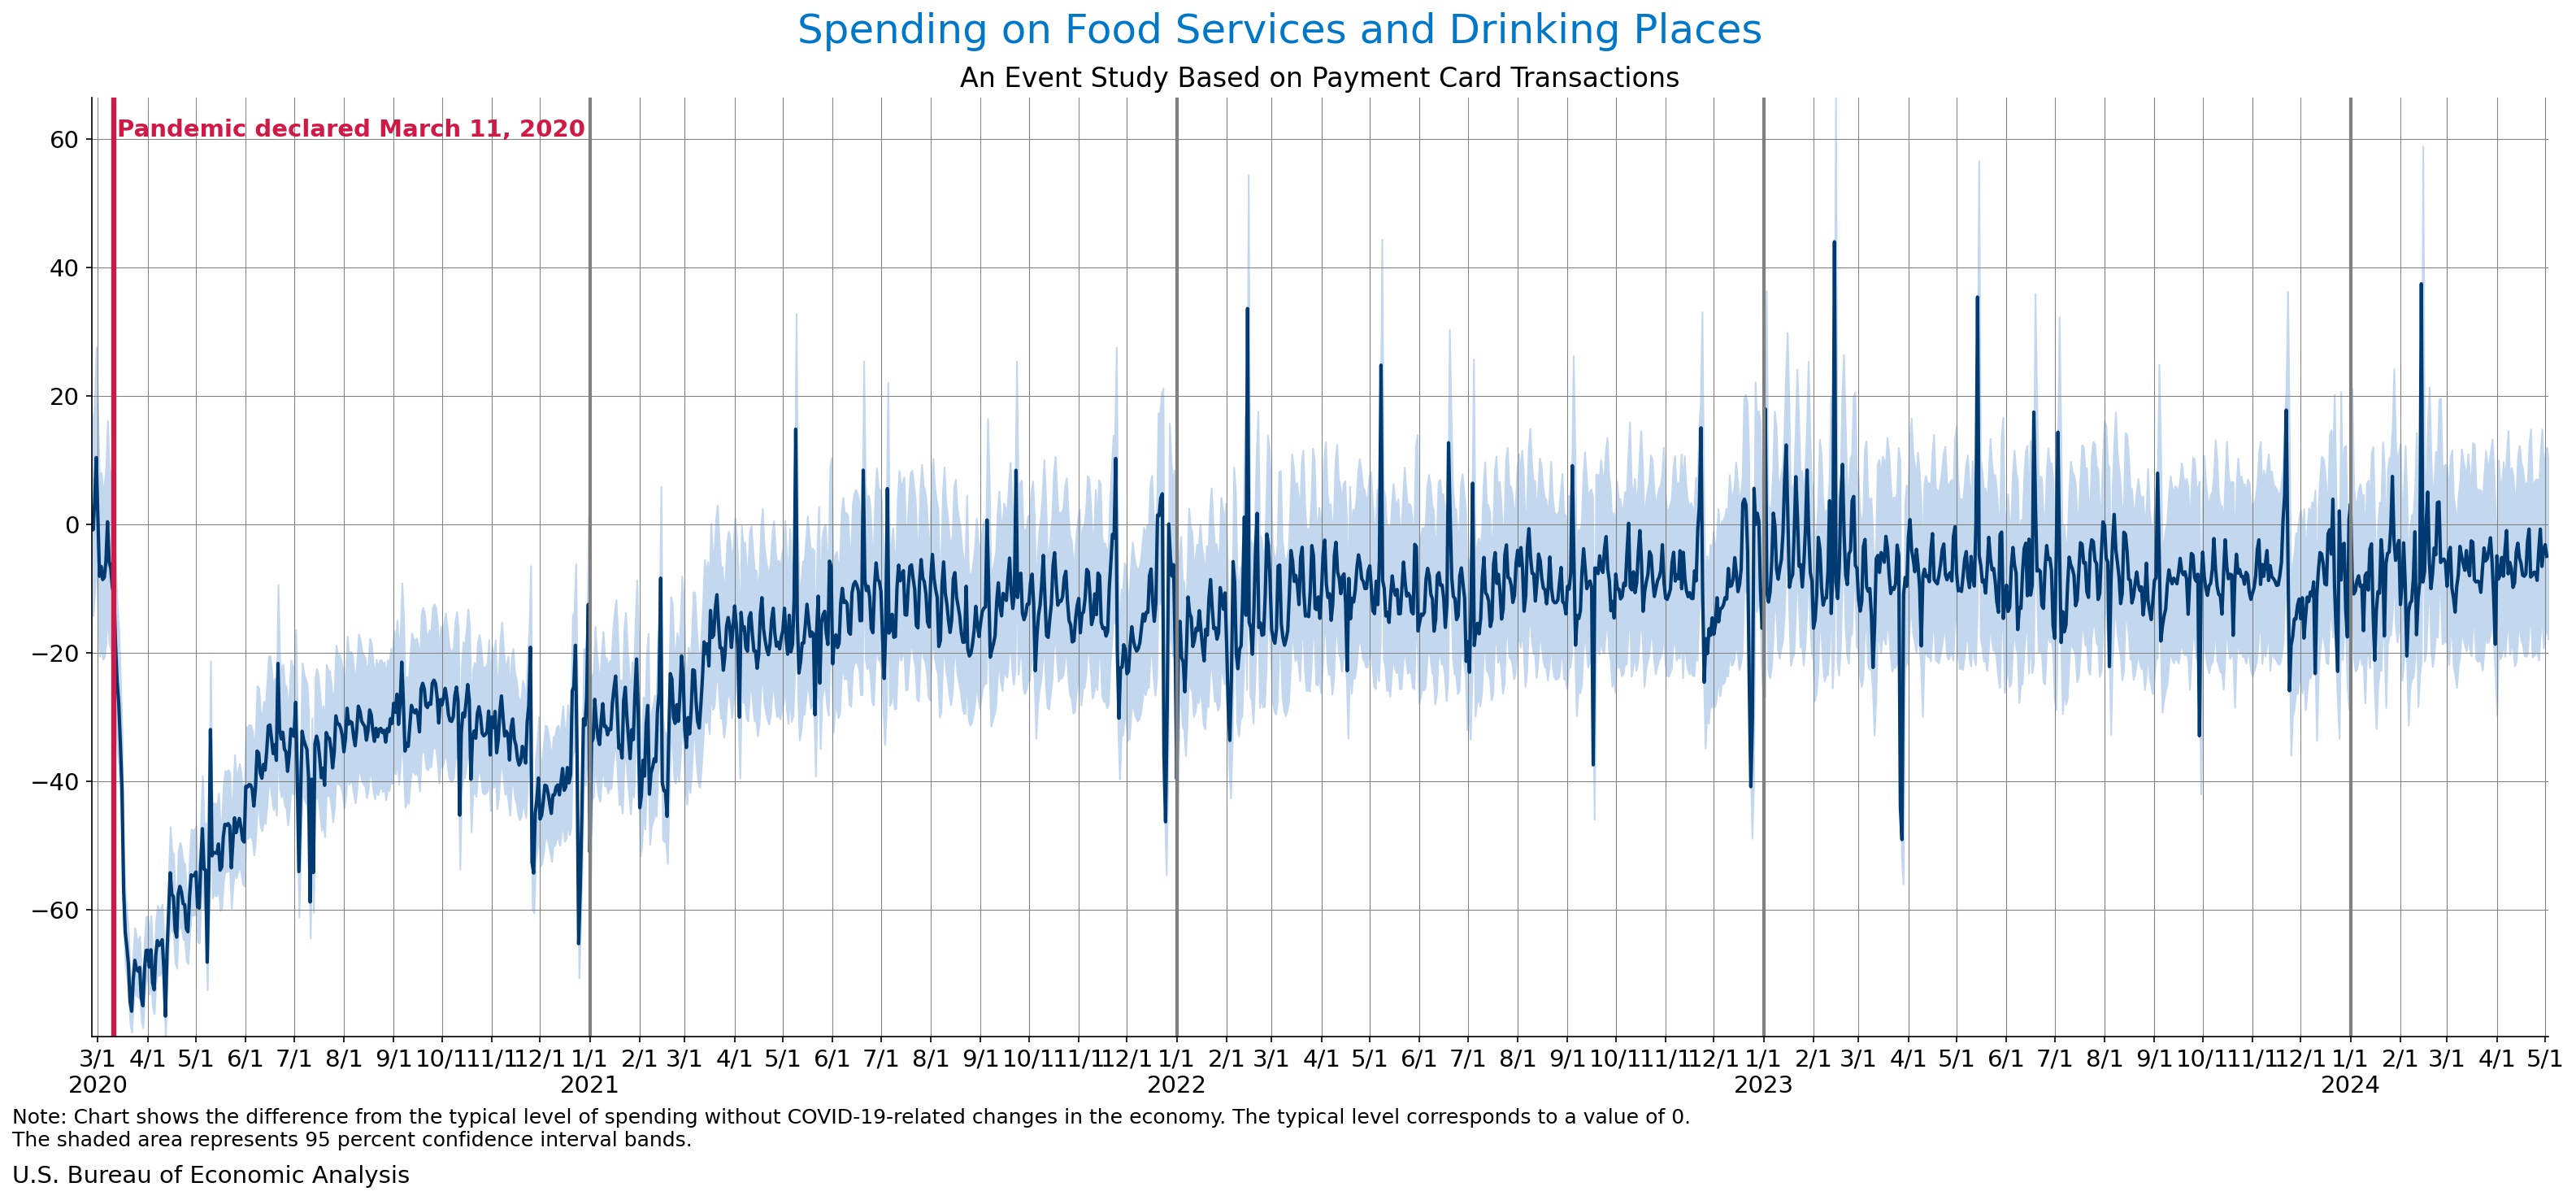
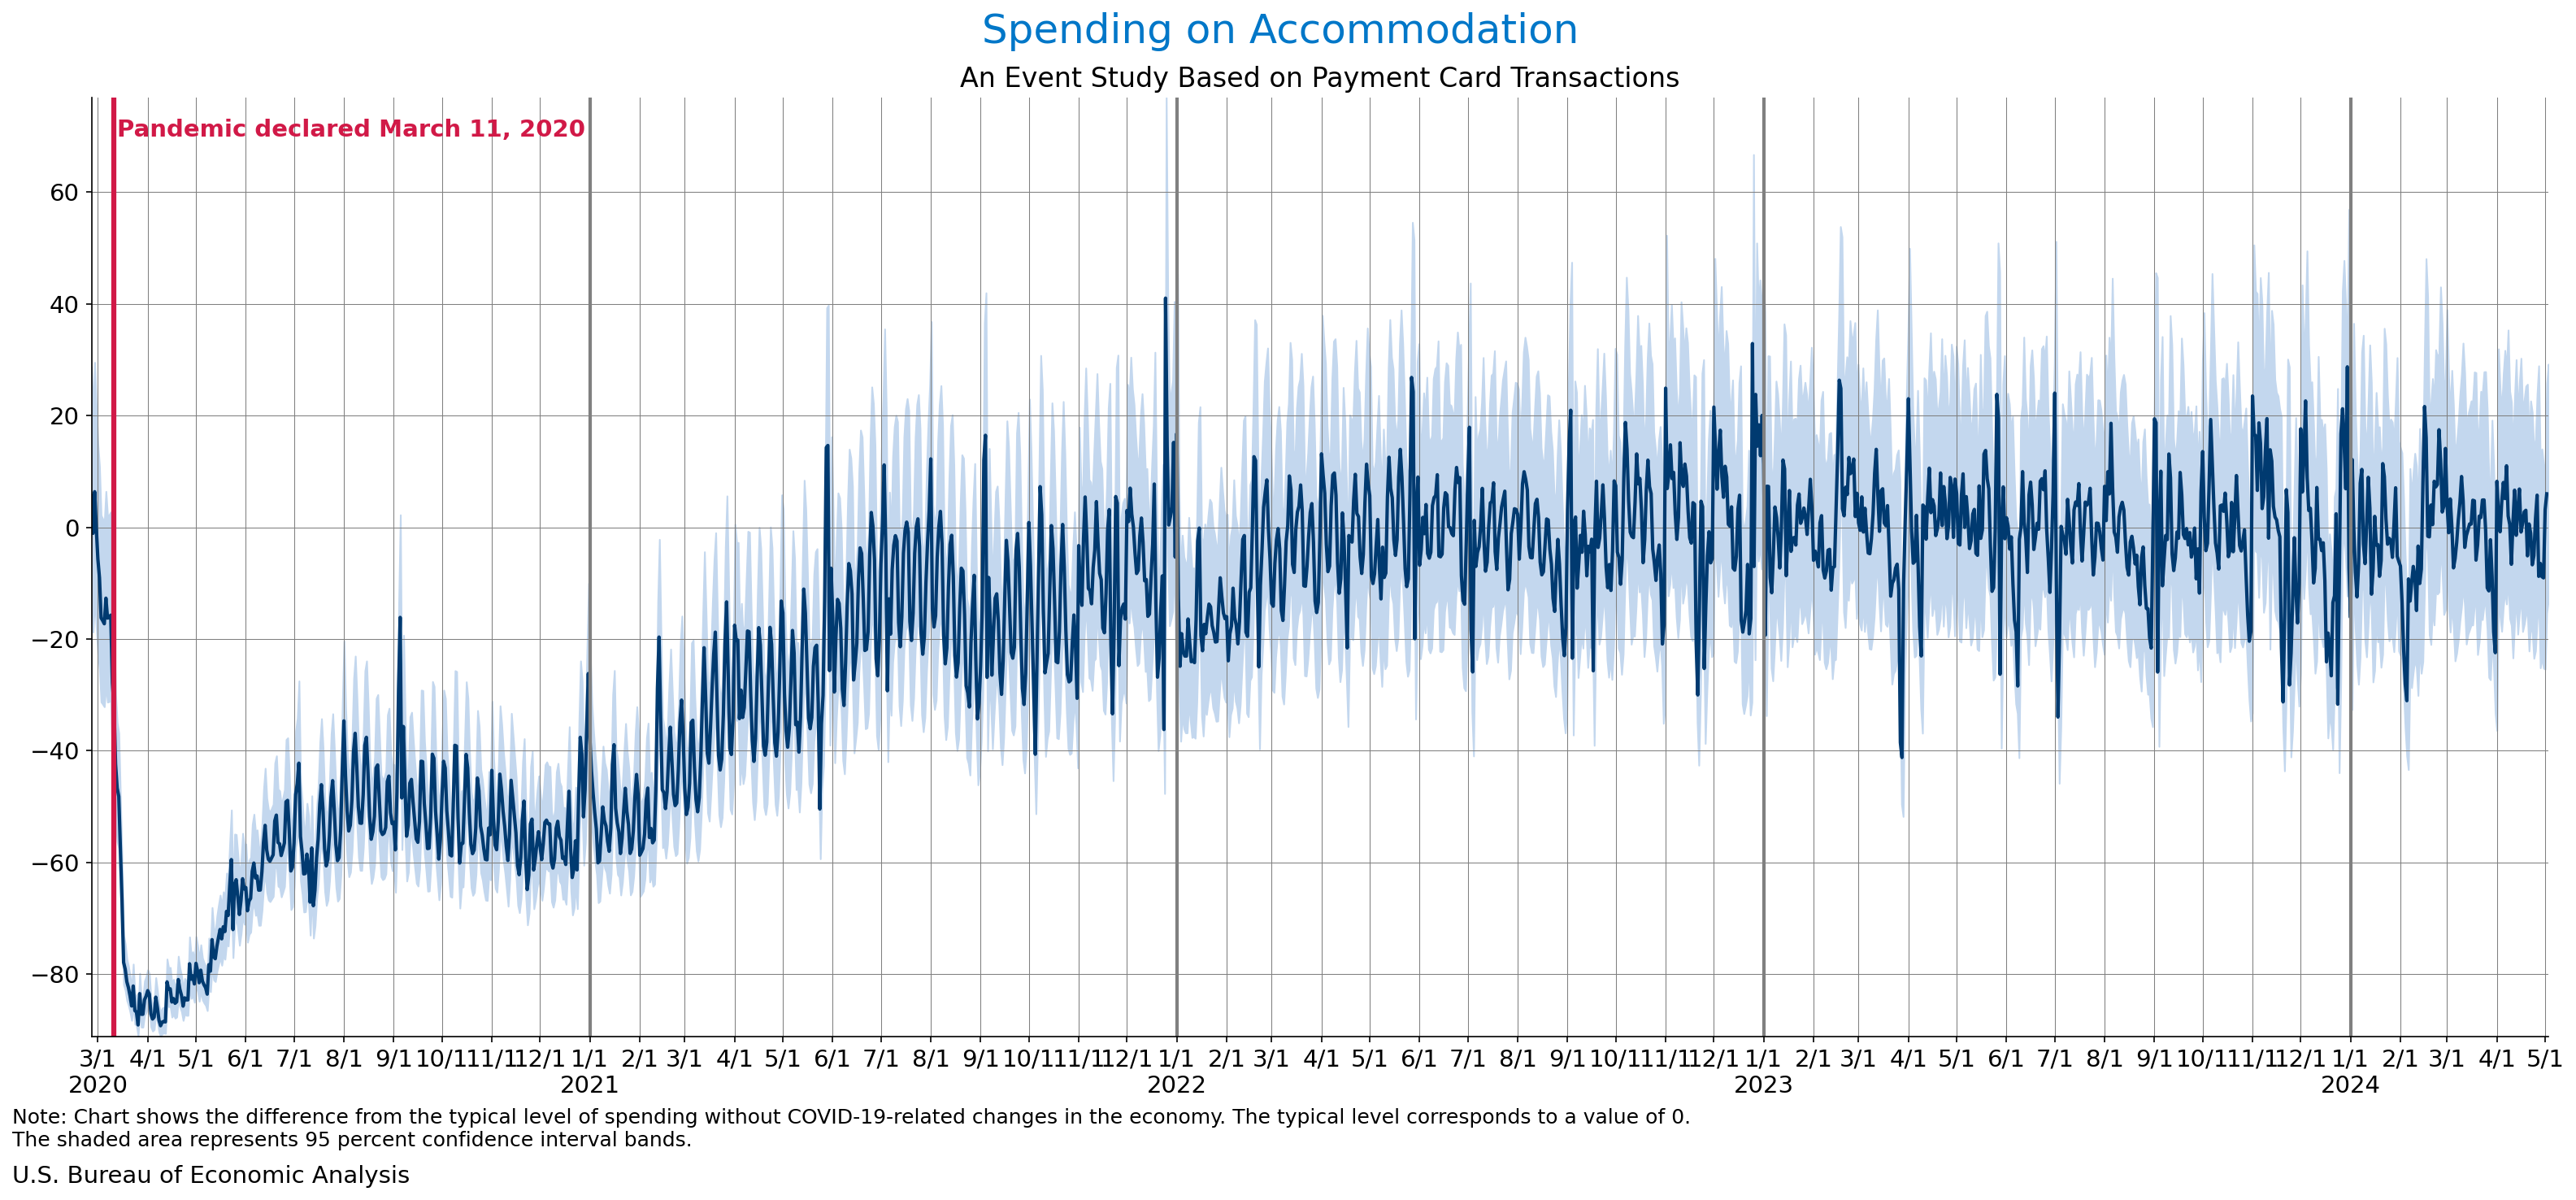
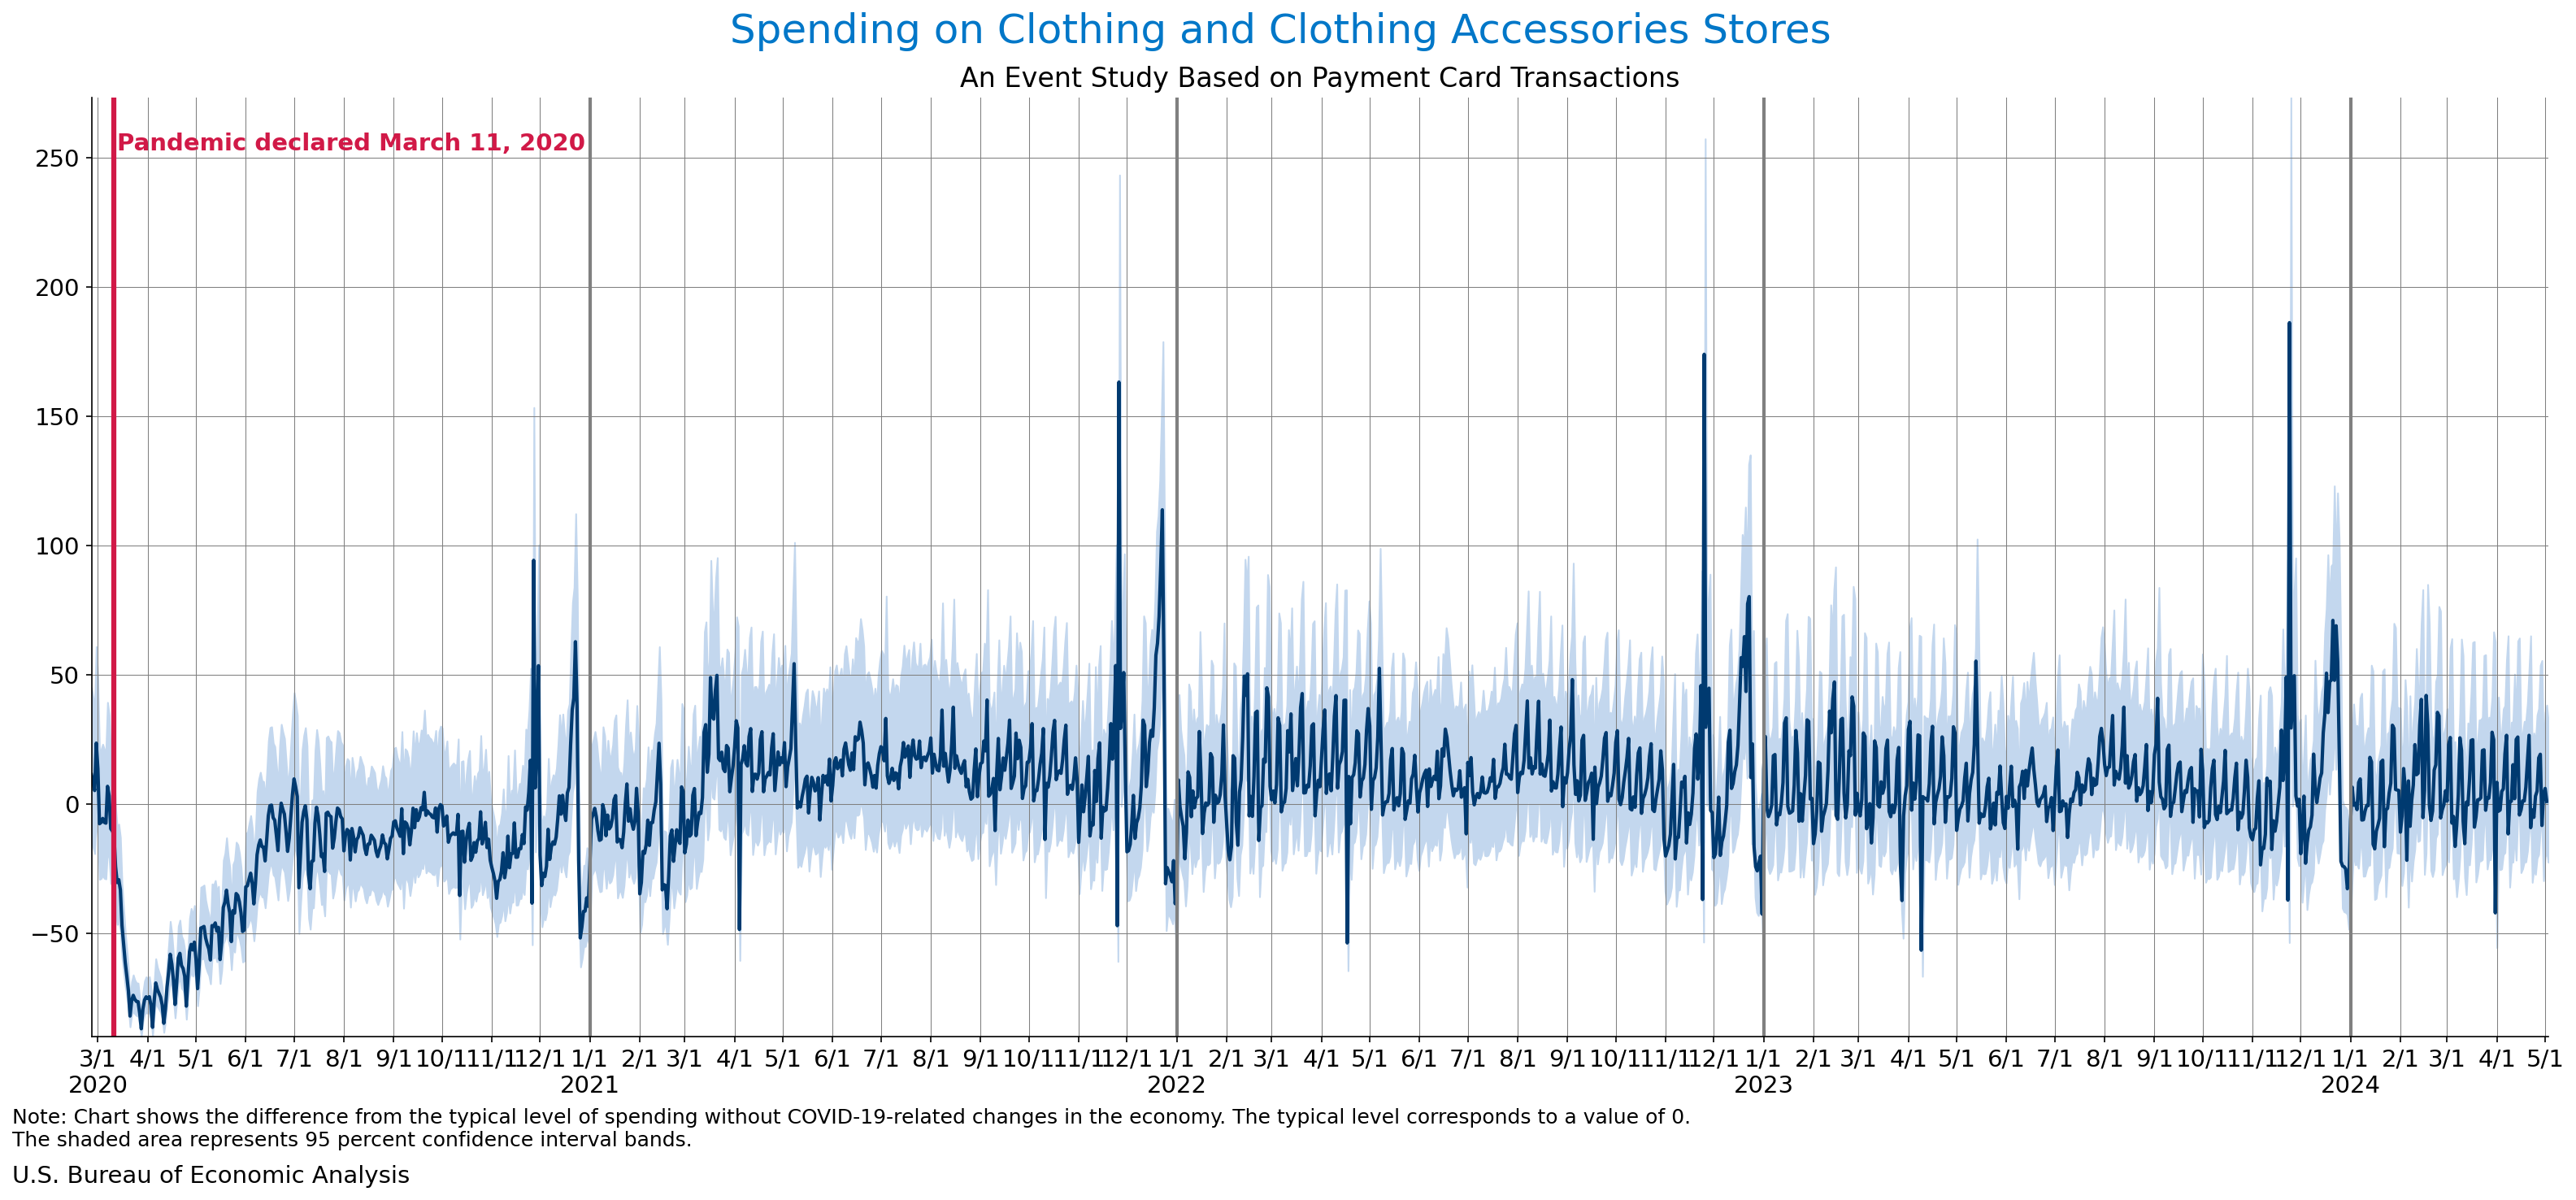
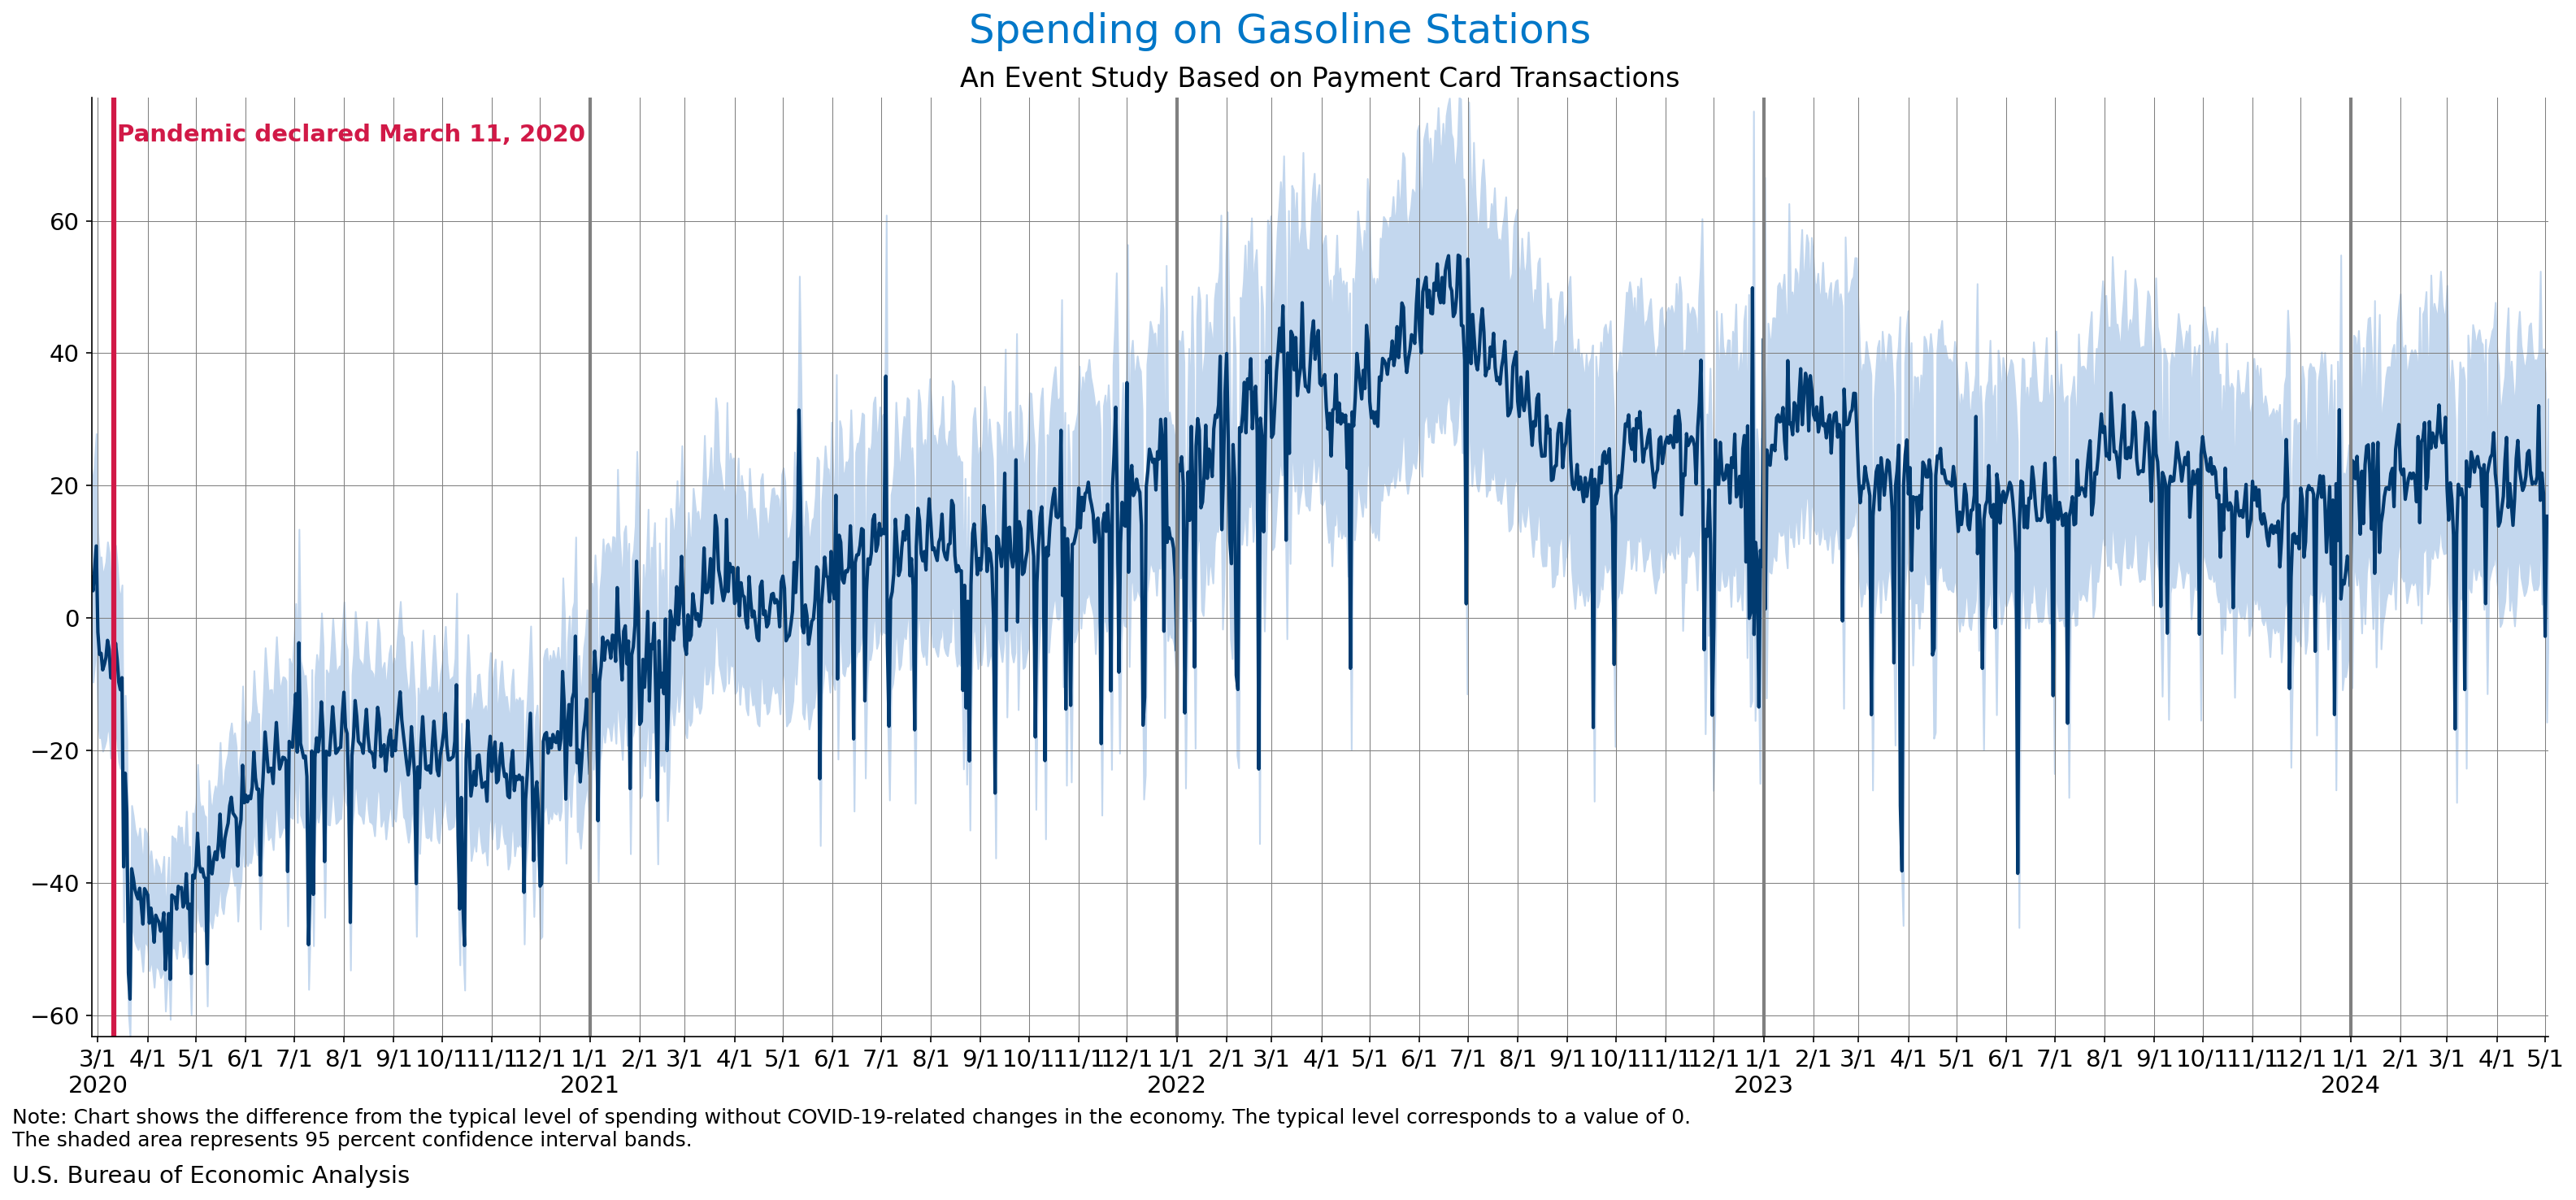
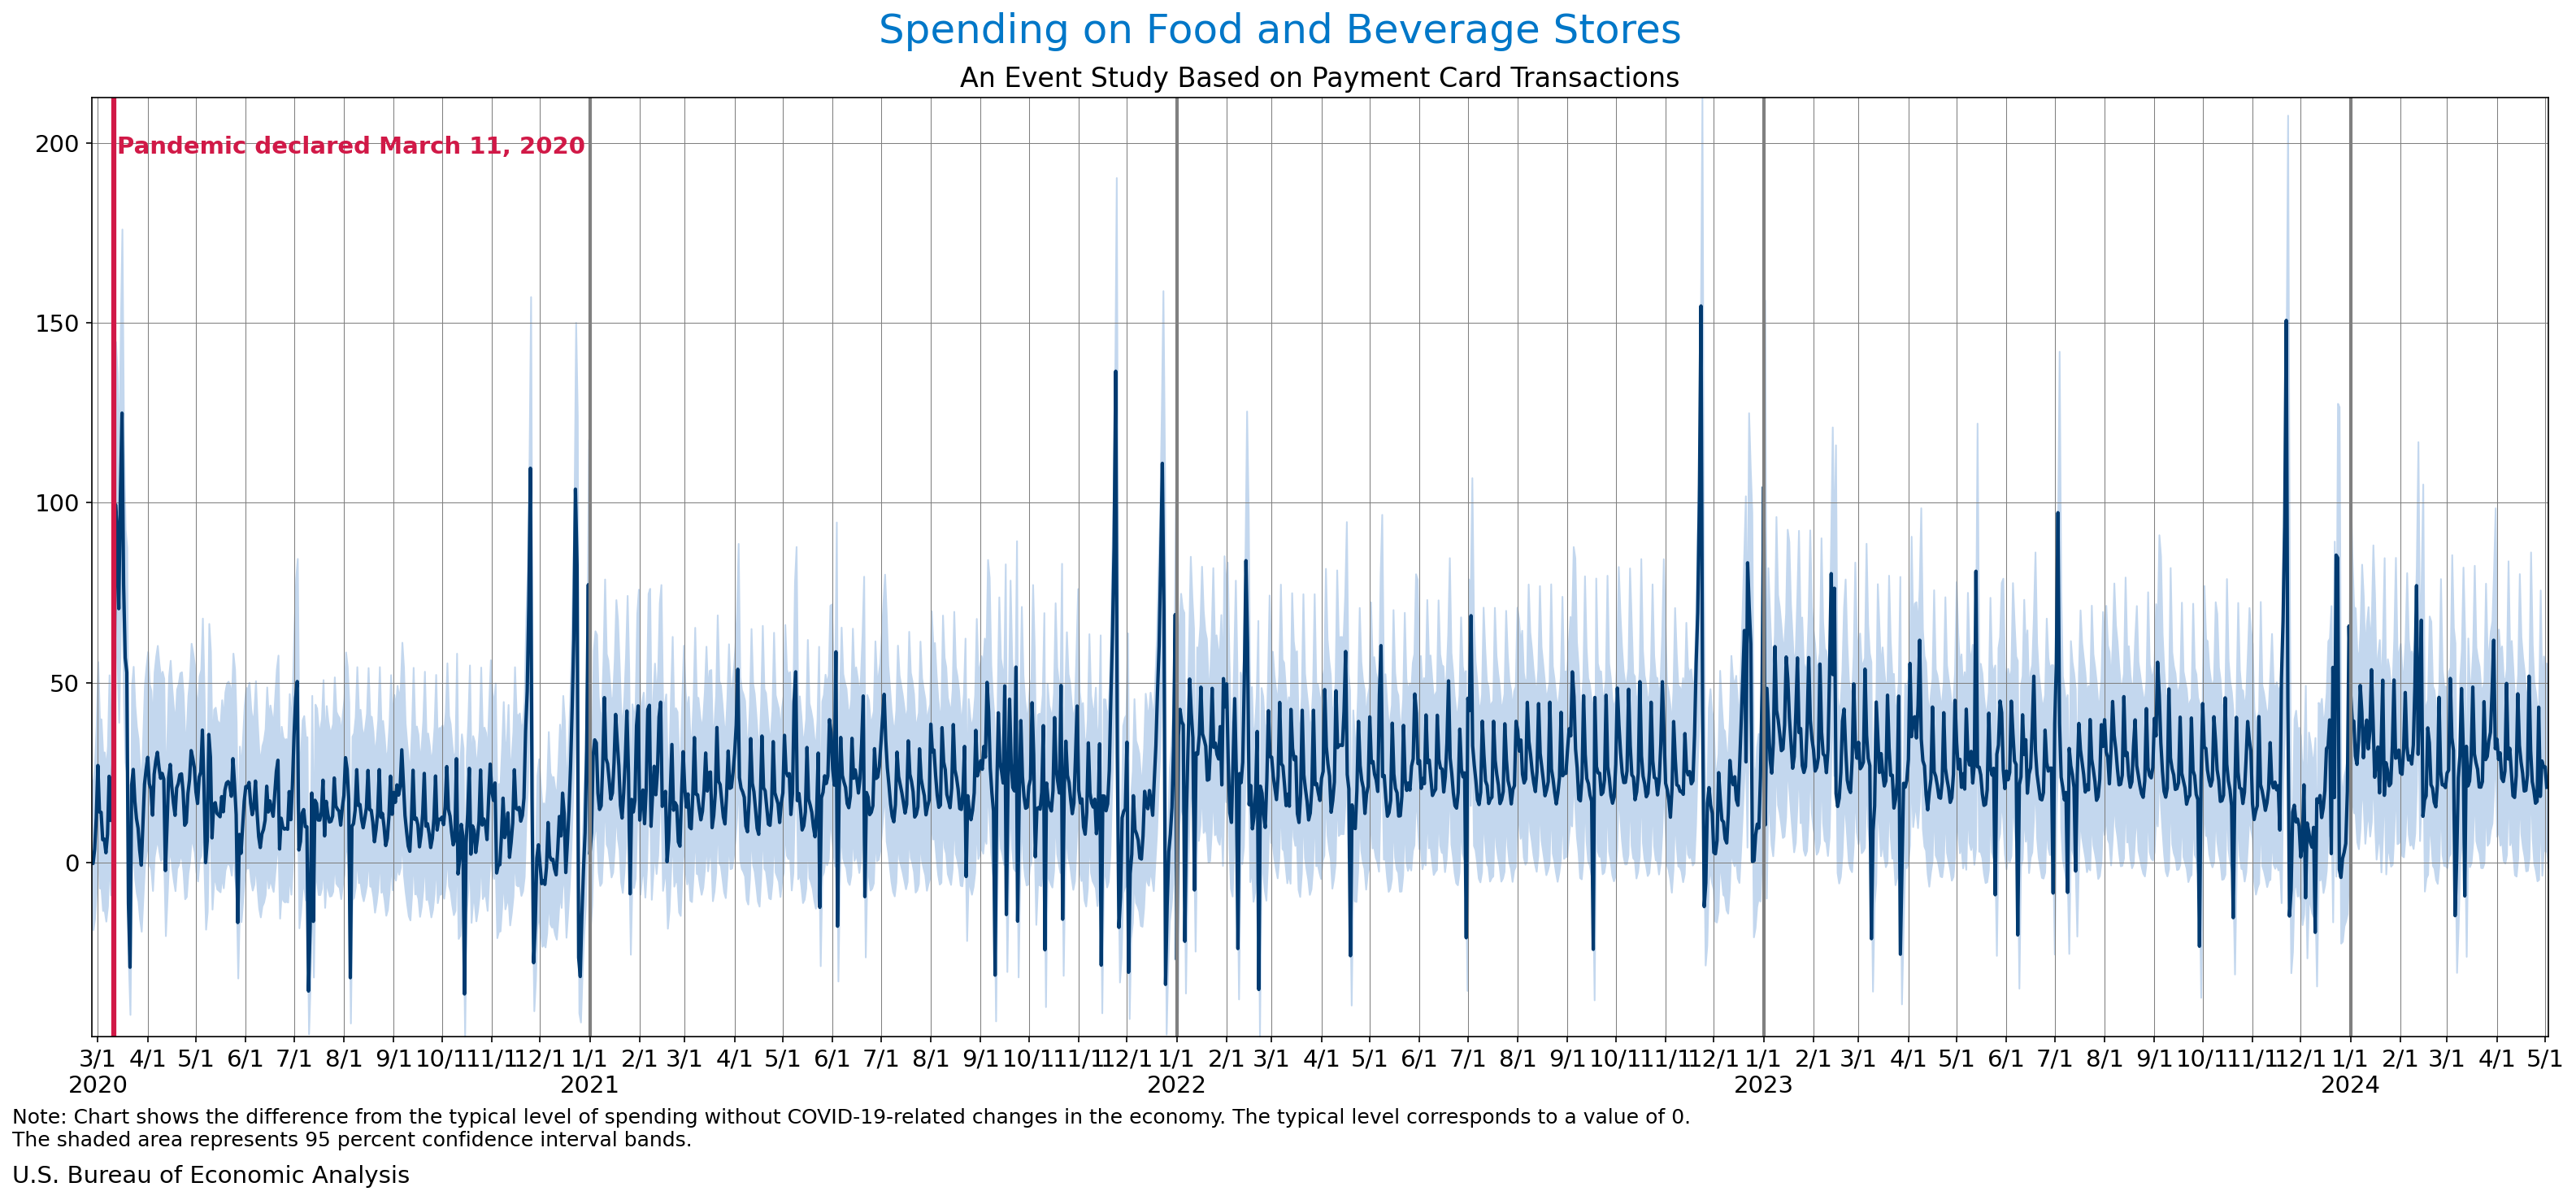
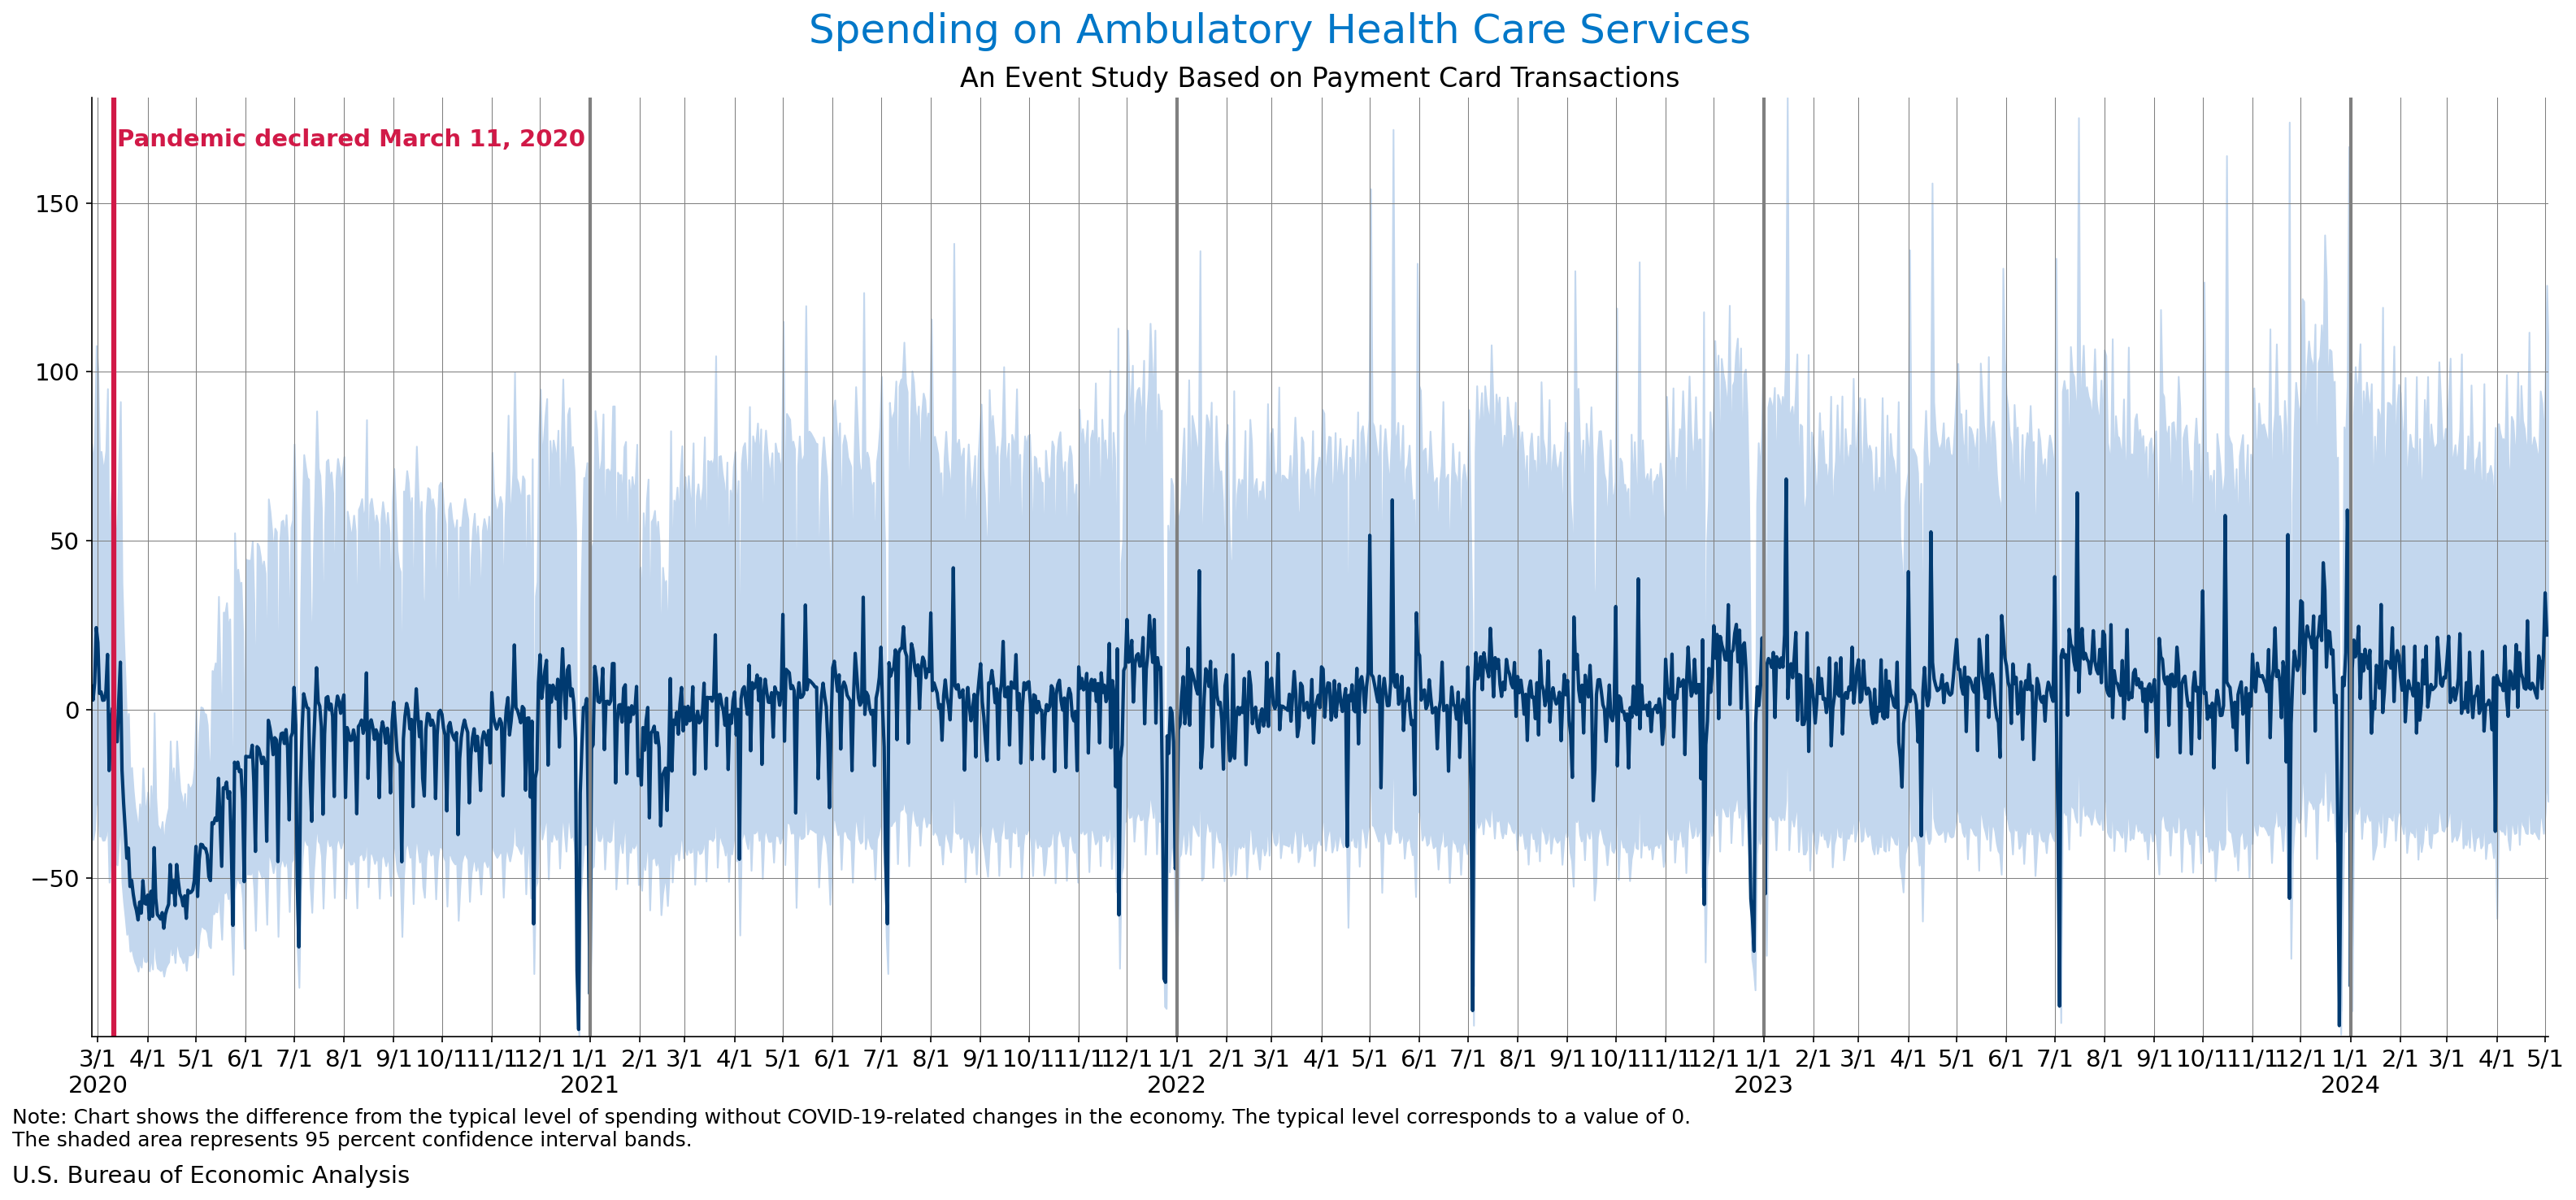
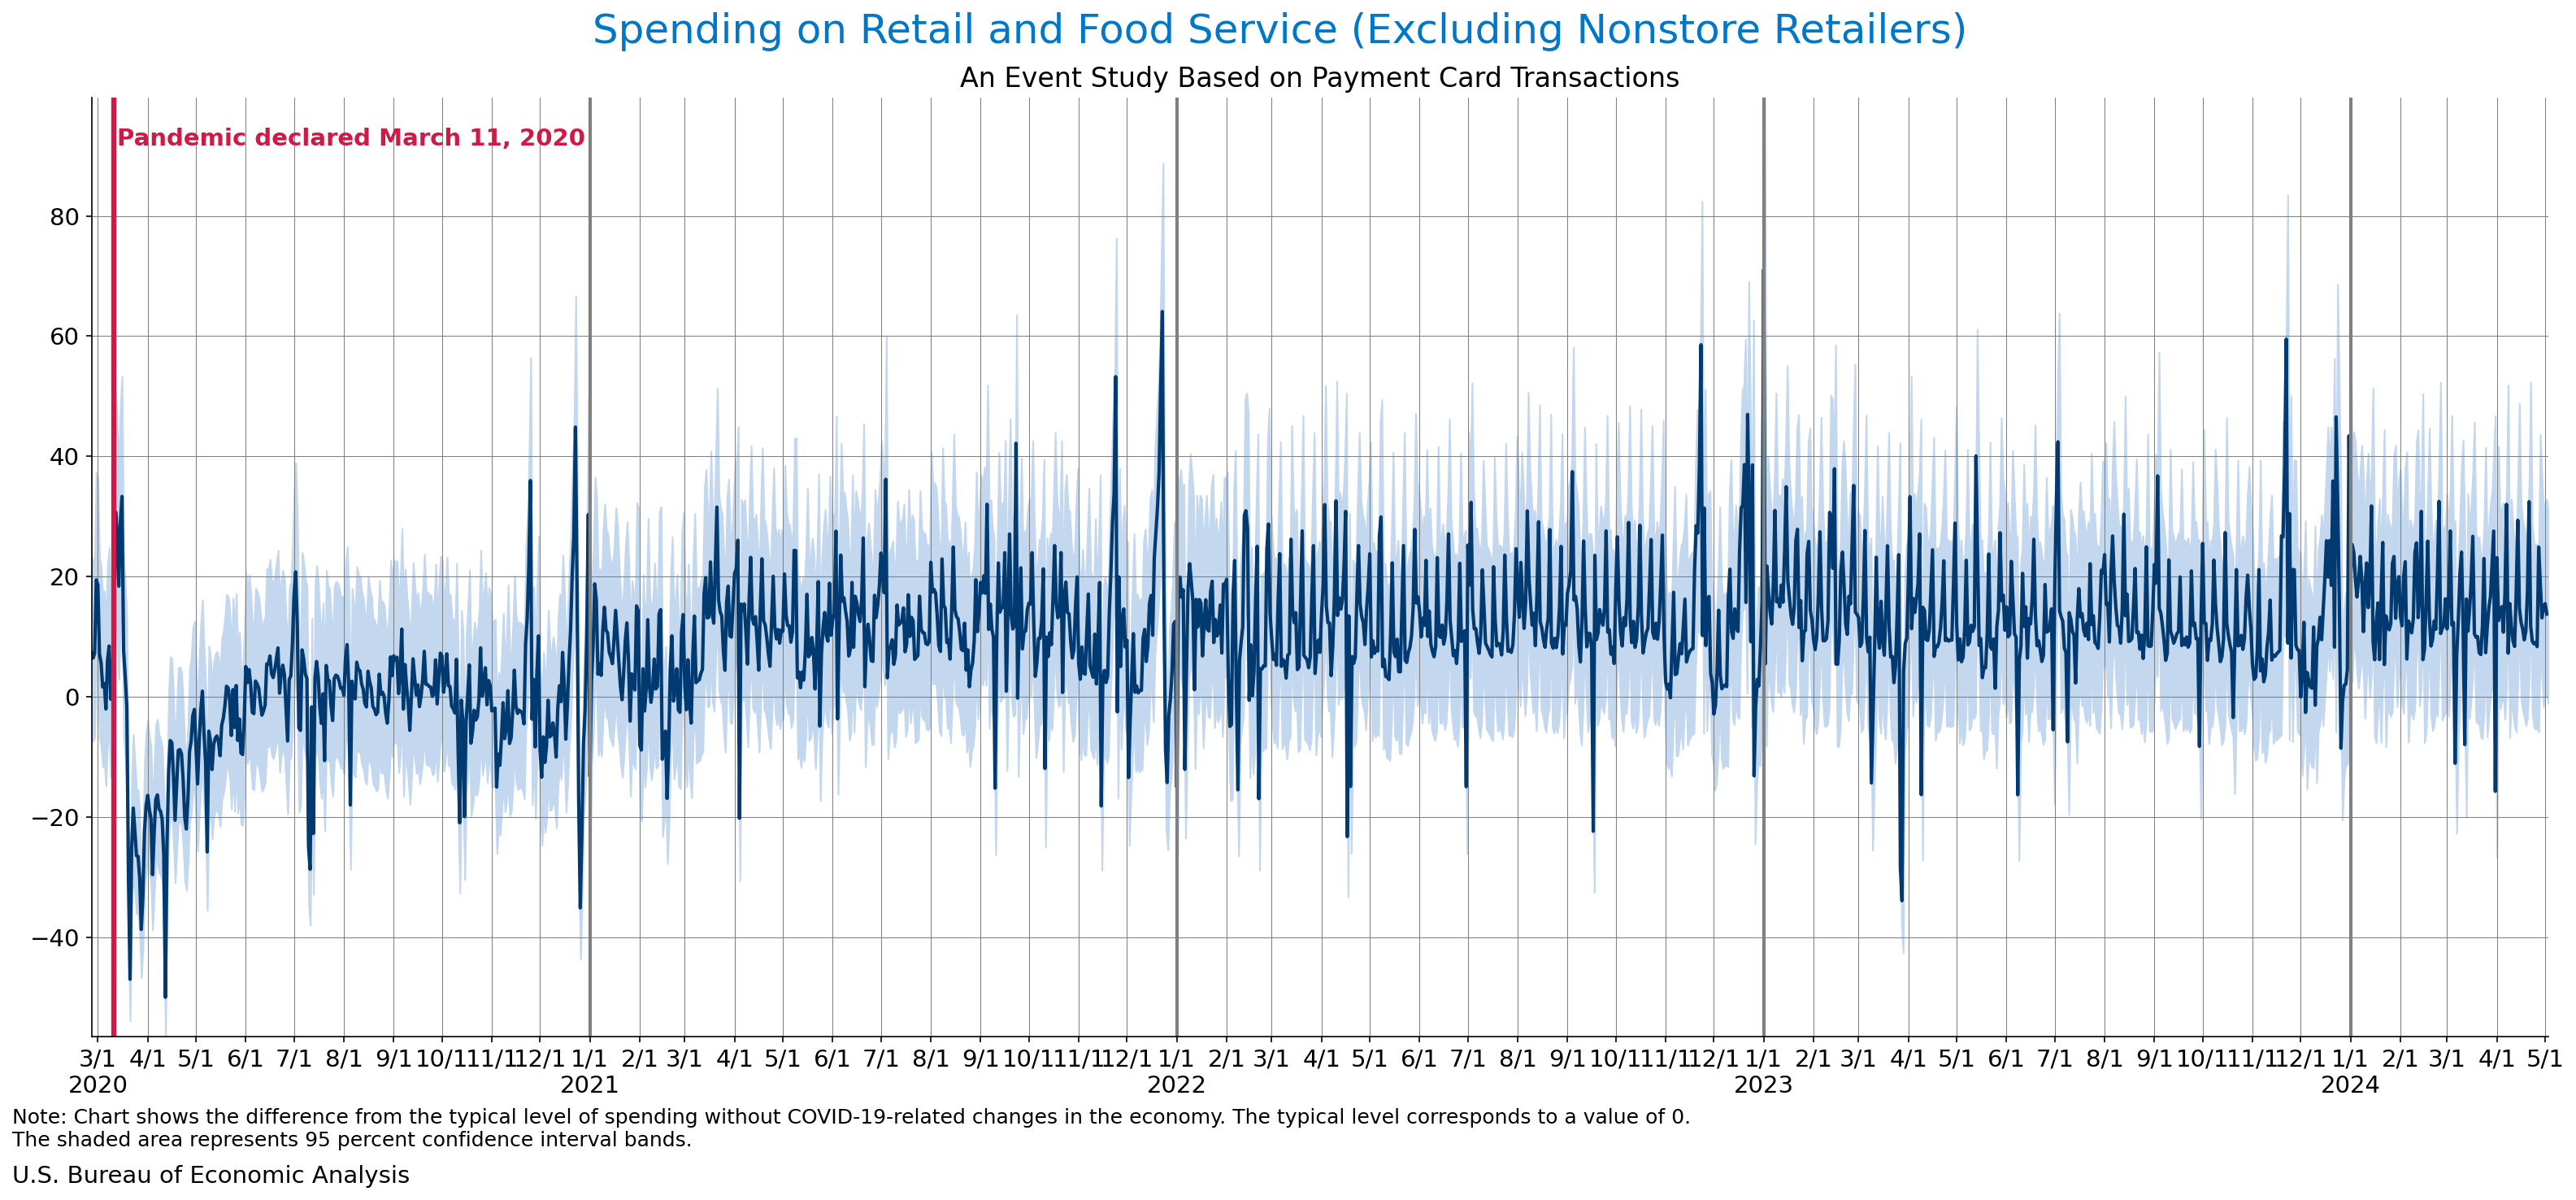
BEA began publishing these charts and tables in response to the public and policymakers' demands for more frequent and timely data related to the effects of the COVID-19 pandemic. An event study methodology is used to estimate the difference (in percentage points) in spending from the typical level (relative to the day of week, month, and annual trends) prior to the pandemic declared by the World Health Organization on March 11, 2020.

Daily Spending by Industry
These estimates were last updated on May 7, 2024.
Data
- Weekly Event Study of Estimates Using Card Transactions XLSX
- Weekly Event Study of Spending Estimates Using Card Transactions CSV
- Monthly Event Study of Estimates Using Card Transactions XLSX
About These Estimates
The underlying card transaction data for these estimates of spending by industry group were collected by Fiserv, one of the largest card intermediaries in the country. Each observation in the data corresponds to a single transaction (for example, a consumer using a credit card, debit card, or gift card). All data are aggregated to the state and national levels and thus anonymous.
The method used to produce this card spending data series was first developed by staff at the Board of Governors of the Federal Reserve System, with the assistance of data scientists from Palantir, a technology company specialized in managing and analyzing big data. We present estimates of weekly and monthly data based on an event study analysis on this data series. The estimates adjust for day of week, month, holidays, and broad annual trends. The event study estimates may be interpreted as changes in spending relative to expected levels prior to the pandemic.
It is important to understand the limitations to these data, including:
- The data set is not necessarily representative of each industry, even after reweighting and applying adjustments to the series. In contrast, BEA's official statistics are structured to be nationally representative.
- The data cover primarily brick-and-mortar merchants. (The nonstore retail category is intended to capture firms that do most of their business through e-commerce, but it is unclear how well this category is represented.)
- The estimates are built around merchants that continually contribute to the data over a 13-month period. Merchants that exit the sample entirely are not included, so our analysis will miss the decline in overall sales associated with exits. This may be particularly problematic during a sharp downturn in the economy; these estimates may understate the true declines in many sectors.
- The pandemic may be accelerating the shift away from cash toward paperless transactions, which may also lead to an understatement of the true decline in spending.
Overall, the estimates should be used with caution based on their limitations. They provide timely data but are a complement to, not a substitute for, the government's official data series.
For more information on the data and estimation procedure, see:
- "Measuring the Effects of the COVID-19 Pandemic on Consumer Spending Using Card Transaction Data"
Abe Dunn, Kyle Hood and Alexander Dreissen (2020), BEA Working Paper Series, WP2020-5 - "From Transactions Data to Economic Statistics: Constructing Real-Time, High-Frequency, Geographic Measures of Consumer Spending"
Aditya Aladangady, Shifrah Aron-Dine, Wendy Dunn, Laura Feiveson, Paul Lengermann, and Claudia Sahm.
Forthcoming in Big Data for 21st Century Economic Statistics, edited by Katharine G. Abraham, Ron S. Jarmin, Brian Moyer, and Matthew D. Shapiro. Chicago: University of Chicago Press, for the National Bureau of Economic Research.
Primary Contact
-
Assistant Chief EconomistAbe Dunn
Additional Personnel Contacts
-
Research EconomistKyle Hood
-
EconomistAlex Driessen