|
The tables in this release are available in an XLS spreadsheet and the entire release is available in PDF format.
Many of the tables in our news releases are very wide. Printing tips are available.
| Marian Sacks |
(202) |
606–9274 |
(Estimates) |
BEA 03—28 |
| G. Andrew Bernat Jr.: |
(202) |
606–9235 |
(Analysis) |
| E-mail inquiries: |
RegRelease@bea.gov |
State Personal Income: First Quarter 2003
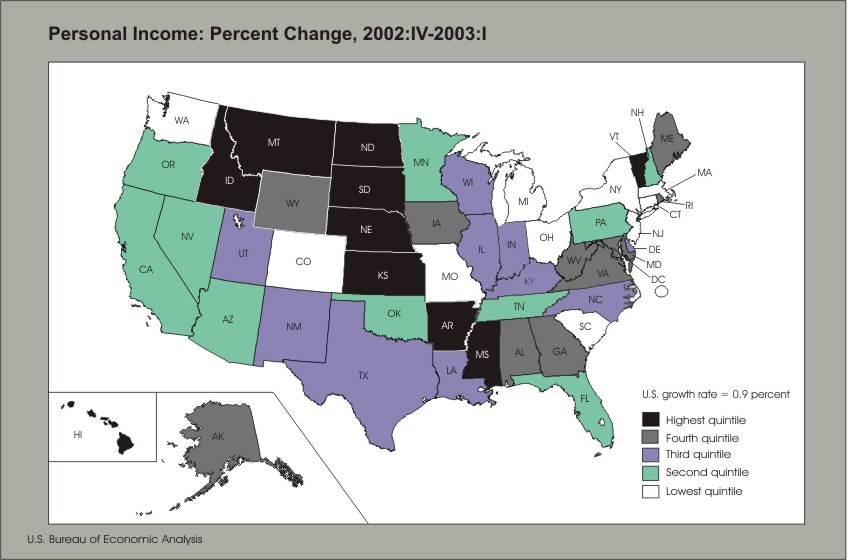
Personal income growth accelerated in 39 states in the first quarter of 2003, according to estimates released today by the U.S. Bureau of Economic Analysis. The number was up from the fourth quarter of 2002, when 32 states and the District of Columbia had faster growth, and was substantially higher than in the third quarter of 2002, when only 10 states had faster growth.
Personal income for the nation, which is only available in current dollars, grew 0.9 percent in the first quarter of 2003, up from increases of 0.6 percent and 0.5 percent in the last two quarters of 2002. The first quarter increase reflected an acceleration in net earnings, partly offset by a decline in dividends, interest, and rent (DIR). Transfer payments grew at the same rate as in the fourth quarter of 2002.
Personal Income Growth by Component
Net earnings grew 1.1 percent in the first quarter of 2003 nationally, compared to 0.7 percent in the fourth quarter of 2002 and 0.6 percent in the third quarter. All states showed an increase in net earnings in the first quarter, with 34 states and the District of Columbia recording faster growth in the first quarter compared to the fourth. In contrast, only 25 states experienced an acceleration in net earnings growth in the fourth quarter.
Transfer payments grew at the same rate in the first quarter of 2003 as in the previous quarter. Thirty-three states experienced faster growth in transfer payments in the first quarter of 2003 compared to 42 states in the fourth quarter of 2002. Unemployment benefit payments, the most volatile component of transfer payments, declined 3.5 percent nationally, though a few states, notably North Dakota, Montana, and Maine, exhibited substantial growth. Together, all other transfer payments grew 1.9 percent.
Property income (dividends, interest and rent) declined 0.1 percent in the first quarter nationally, compared to declines of 0.4 percent and 0.2 percent in the last two quarters of 2002. A 1.7 percent growth in dividends was more than offset by declines in interest and rental income.
Earnings Growth by Industry
Nationally, earnings grew in every industry except durable goods manufacturing and information. Government accounted for 0.32 of the 1.1 percent growth in earnings. Education and health services, financial activities, and professional and business services together accounted for 0.47 percentage point of the first quarter growth in earnings. Earnings growth in government contributed the most to personal income growth in 26 states and the District of Columbia, while earnings growth in natural resources and mining, primarily farming, was the largest contributor in 13 states. Fast growth in farming was particularly important in the Plains states, notably North Dakota, South Dakota, Nebraska, and Kansas, all of which were among the ten fastest growing states. Education and health services was the leading growth industry in six states, and financial activities, construction, and professional and business services were the leading growth industries in the remaining six states.
Year to Year Trends in Quarterly State Personal Income Growth
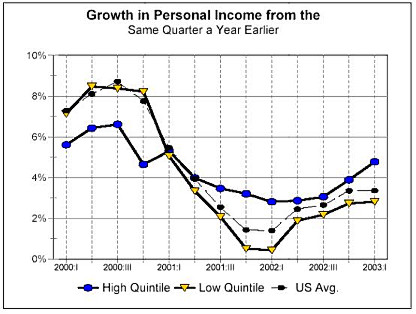
Because quarter-to-quarter changes in state personal income are subject to large swings, it is also useful to look at the change in state personal income in the current quarter relative to the same quarter a year ago. Table 5 and the below chart show the year-to-year growth rates of quarterly state personal income from the first quarter of 2000 through the first quarter of 2003.
U.S. personal income increased 3.4 percent from the first quarter of 2002 to the first quarter of 2003, up slightly from an increase of 3.3 percent in the previous four-quarter period. After peaking at an 8.7 percent annual increase in the third quarter of 2000, the annual change in U.S. personal income decelerated throughout 2001, bottoming out at 1.4 percent in the fourth quarter, when the trough of the 2001 recession occurred. The growth rates have increased in each quarter since the first quarter of 2002.
Similar patterns of growth are evident for the top- and bottom-growth quintile states, where the quintiles are based on ranks of first quarter 2003 income growth. Year-to-year growth in personal income has been higher in the top quintile states than in the bottom quintile states since the second quarter of 2001. In addition, the growth rate of the top quintile increased steadily in the past two quarters whereas the bottom quintile, and the nation, grew only slightly faster in the first quarter of 2003 than in the previous quarter.
For 21 states, year to year growth was higher in the first quarter of 2003 than in the fourth quarter of 2002. Year over year growth in the first quarter ranged from 7.4 percent in South Dakota to 1.5 percent in Connecticut.
Note on the State Estimates by Industry
Beginning with 2001, quarterly state estimates of wage and salary disbursements and of earnings by industry are based on the North American Industry Classification System (NAICS). Quarterly state estimates of earnings by industry for 1948-2001 are based on the Standard Industrial Classification System. A four-quarter overlap of the two industry classification systems has been provided. All of the estimates can be accessed at www.bea.gov.
Definitions
Personal income is the income received by all persons from participation in production, from government and business transfer payments, and from government interest. Personal income is the sum of net earnings by place of residence, rental income of persons, personal dividend income, personal interest income, and transfer payments. Net earnings is earnings by place of work (the sum of wage and salary disbursements (payrolls), other labor income, and proprietors' income) less personal contributions for social insurance, plus an adjustment to convert earnings by place of work to a place-of-residence basis. Personal income is measured before the deduction of personal income taxes and other personal taxes and is reported in current dollars (no adjustment is made for price changes).
The estimate of personal income in the United States is derived as the sum of the state estimates; it differs from the estimate of personal income in the national income and product accounts (NIPA's) because of differences in coverage, in the methodologies used to prepare the estimates, and in the timing of the availability of source data.
BEA groups all 50 states and the District of Columbia into eight distinct regions for purposes of data collecting and analyses: New England (Connecticut, Maine, Massachusetts, New Hampshire, Rhode Island, and Vermont); Mideast (Delaware, District of Columbia, Maryland, New Jersey, New York, and Pennsylvania); Great Lakes (Illinois, Indiana, Michigan, Ohio, and Wisconsin); Plains (Iowa, Kansas, Minnesota, Missouri, Nebraska, North Dakota, and South Dakota); Southeast (Alabama, Arkansas, Florida, Georgia, Kentucky, Louisiana, Mississippi, North Carolina, South Carolina, Tennessee, Virginia, and West Virginia; Southwest (Arizona, New Mexico, Oklahoma, and Texas); Rocky Mountain (Colorado, Idaho, Montana, Utah, and Wyoming); and Far West (Alaska, California, Hawaii, Nevada, Oregon, and Washington).
BEA's major national, regional, international, and industry estimates; the Survey of Current Business; and BEA news releases are available without charge on BEA's Web site:
Summary BEA estimates are available on recorded messages at the time of public release at the following telephone numbers:
        (202) 606-5306   Gross domestic product
              606-5303   Personal income and outlays
              606-5362   U.S. international transactions
Most of BEA's estimates and analyses are published in the Survey of Current Business, BEA's monthly journal. Subscriptions and single copies of the printed Survey are for sale by the Superintendent of Documents, U.S. Government Printing Office. Internet: <bookstore.gpo.gov>; phone: 202-512-1800; fax: 202-512-2250; mail: SSOP, Washington, DC 20402-0001.
Next state personal income release — October 23, 2003, at 9:00 AM EDT for
State Personal Income, Second Quarter 2003.
|
|
Table 1. Personal Income, by State and Region, 2002:I-2003:I
[Millions of dollars, seasonally adjusted at annual rates]
----------------------------------------------------------------------------------------------------------------------------------------
2002 2003 Percent change from preceding quarter /1 Rank
------------------------------------------ --------- ----------------------------------------- 2002:IV-
I/r II/r III/r IV/r I/p 2002:II 2002:III 2002:IV 2003:I 2003:I
----------------------------------------------------------------------------------- ----------------------------------------- --------
United States .............. 8,772,204 8,881,691 8,927,635 8,982,839 9,066,660 1.2 0.5 0.6 0.9 ---
New England
Connecticut ............ 147,269 148,249 148,840 148,486 149,514 .7 .4 -.2 .7 45
Maine .................. 35,481 35,858 36,141 36,483 36,908 1.1 .8 .9 1.2 18
Massachusetts .......... 247,765 252,257 251,714 252,127 253,786 1.8 -.2 .2 .7 46
New Hampshire .......... 43,055 43,865 43,847 44,047 44,447 1.9 0 .5 .9 33
Rhode Island ........... 32,779 33,202 33,467 33,659 34,129 1.3 .8 .6 1.4 12
Vermont ................ 17,900 18,093 18,238 18,439 18,733 1.1 .8 1.1 1.6 8
Mideast
Delaware ............... 25,929 26,090 26,175 26,143 26,418 .6 .3 -.1 1.1 24
District of Columbia ... 24,204 24,677 24,768 25,393 25,475 2.0 .4 2.5 .3 ---
Maryland ............... 194,304 196,862 198,005 199,454 202,136 1.3 .6 .7 1.3 13
New Jersey ............. 337,578 338,845 341,099 342,035 344,653 .4 .7 .3 .8 41
New York ............... 676,590 686,279 685,909 687,503 691,855 1.4 -.1 .2 .6 47
Pennsylvania ........... 386,067 389,692 392,285 394,198 397,745 .9 .7 .5 .9 34
Great Lakes
Illinois ............... 415,157 420,863 420,922 422,491 426,906 1.4 0 .4 1.0 25
Indiana ................ 171,072 173,169 174,777 176,538 178,427 1.2 .9 1.0 1.1 22
Michigan ............... 295,932 304,930 306,682 307,437 309,724 3.0 .6 .2 .7 42
Ohio ................... 330,130 334,343 336,601 338,255 340,769 1.3 .7 .5 .7 43
Wisconsin .............. 160,906 162,839 163,937 165,182 166,801 1.2 .7 .8 1.0 27
Plains
Iowa ................... 81,814 82,375 82,803 83,577 84,623 .7 .5 .9 1.3 17
Kansas ................. 77,875 77,967 78,418 79,028 80,467 .1 .6 .8 1.8 6
Minnesota .............. 167,189 169,755 171,656 171,969 173,557 1.5 1.1 .2 .9 31
Missouri ............... 161,919 162,979 164,041 165,471 166,322 .7 .7 .9 .5 50
Nebraska ............... 50,408 50,774 51,397 51,767 53,094 .7 1.2 .7 2.6 3
North Dakota ........... 16,787 16,608 16,931 17,059 17,875 -1.1 1.9 .8 4.8 1
South Dakota ........... 20,043 20,095 20,466 20,660 21,518 .3 1.8 .9 4.2 2
Southeast
Alabama ................ 111,057 112,093 113,036 114,183 115,455 .9 .8 1.0 1.1 20
Arkansas ............... 62,408 63,291 63,686 64,464 65,545 1.4 .6 1.2 1.7 7
Florida ................ 485,611 493,048 495,859 501,588 506,154 1.5 .6 1.2 .9 32
Georgia ................ 243,028 245,628 246,123 248,050 251,170 1.1 .2 .8 1.3 16
Kentucky ............... 103,365 104,583 105,556 106,548 107,703 1.2 .9 .9 1.1 21
Louisiana .............. 112,155 113,505 113,982 115,257 116,381 1.2 .4 1.1 1.0 28
Mississippi ............ 63,376 63,990 64,523 65,077 66,274 1.0 .8 .9 1.8 5
North Carolina ......... 227,740 228,855 229,994 230,836 233,200 .5 .5 .4 1.0 26
South Carolina ......... 102,912 104,156 104,718 105,420 106,015 1.2 .5 .7 .6 49
Tennessee .............. 156,391 158,810 159,256 160,411 161,695 1.5 .3 .7 .8 39
Virginia ............... 234,661 238,366 239,670 240,605 243,637 1.6 .5 .4 1.3 15
West Virginia .......... 42,198 42,467 42,689 42,944 43,492 .6 .5 .6 1.3 14
Southwest
Arizona ................ 140,528 142,215 143,274 144,881 146,119 1.2 .7 1.1 .9 36
New Mexico ............. 43,677 44,098 44,438 45,193 45,676 1.0 .8 1.7 1.1 23
Oklahoma ............... 86,961 87,622 88,168 88,522 89,302 .8 .6 .4 .9 35
Texas .................. 611,202 618,643 620,373 624,021 629,962 1.2 .3 .6 1.0 30
Rocky Mountain
Colorado ............... 147,880 149,421 149,961 150,665 151,774 1.0 .4 .5 .7 44
Idaho .................. 33,294 33,221 33,695 34,129 34,638 -.2 1.4 1.3 1.5 10
Montana ................ 22,270 22,490 22,862 22,979 23,333 1.0 1.7 .5 1.5 9
Utah ................... 55,522 55,771 55,952 56,568 57,108 .4 .3 1.1 1.0 29
Wyoming ................ 14,996 15,095 15,271 15,469 15,688 .7 1.2 1.3 1.4 11
Far West
Alaska ................. 20,091 20,273 20,607 20,898 21,136 .9 1.6 1.4 1.1 19
California ............. 1,138,401 1,152,672 1,160,385 1,169,530 1,178,715 1.3 .7 .8 .8 40
Hawaii ................. 36,757 37,244 37,570 38,016 38,773 1.3 .9 1.2 2.0 4
Nevada ................. 64,384 65,121 65,891 66,889 67,429 1.1 1.2 1.5 .8 38
Oregon ................. 98,842 100,211 100,896 101,974 102,835 1.4 .7 1.1 .8 37
Washington ............. 194,342 198,138 200,086 200,319 201,570 2.0 1.0 .1 .6 48
BEA regions
New England .............. 524,249 531,524 532,245 533,241 537,516 1.4 .1 .2 .8 ---
Mideast .................. 1,644,672 1,662,445 1,668,240 1,674,725 1,688,282 1.1 .3 .4 .8 ---
Great Lakes .............. 1,373,198 1,396,144 1,402,919 1,409,904 1,422,627 1.7 .5 .5 .9 ---
Plains ................... 576,036 580,552 585,711 589,532 597,455 .8 .9 .7 1.3 ---
Southeast ................ 1,944,902 1,968,792 1,979,094 1,995,385 2,016,722 1.2 .5 .8 1.1 ---
Southwest ................ 882,369 892,577 896,253 902,617 911,058 1.2 .4 .7 .9 ---
Rocky Mountain ........... 273,963 275,997 277,739 279,810 282,541 .7 .6 .7 1.0 ---
Far West ................. 1,552,816 1,573,659 1,585,435 1,597,627 1,610,458 1.3 .7 .8 .8 ---
----------------------------------------------------------------------------------------------------------------------------------------
r Revised.
p Preliminary.
1. Percent changes are expressed at quarterly rates.
Note: Estimates may not add to totals due to rounding.
Source: U.S. Bureau of Economic Analysis
Table 2. Personal Income by Component, by State and Region, 2002:IV-2003:I
---------------------------------------------------------------------------------------------------------------------------------------------------
Contribution to percent
Percent change change in personal income Dollar change (millions)
(percentage points)
------------------------------------- -------------------------- ------------------------------------
Divi- Percent Divi- Divi-
dends, Trans- change in dends, Trans- dends, Trans-
Personal Net inter- fer personal Net inter- fer Personal Net inter- fer
income earn- est, pay- income earn- est, pay- income earn- est, pay-
ings/1 and ments ings/1 and ments ings/1 and ments
rent rent rent
---------------------------------------------------------------------------------------------------------------------------------------------------
United States .............. 0.9 1.1 -0.1 1.6 0.9 0.71 -0.02 0.24 83,820 63,606 -1,487 21,701
New England
Connecticut ............ .7 .7 -.1 1.7 .7 .51 -.03 .21 1,028 760 -38 305
Maine .................. 1.2 .9 0 3.4 1.2 .56 .00 .60 425 204 1 220
Massachusetts .......... .7 .7 -.1 1.4 .7 .48 -.01 .19 1,659 1,221 -38 476
New Hampshire .......... .9 1.0 -.3 2.3 .9 .70 -.05 .26 401 306 -22 116
Rhode Island ........... 1.4 1.3 -.2 3.4 1.4 .79 -.04 .64 470 267 -13 217
Vermont ................ 1.6 1.4 .1 4.4 1.6 .88 .02 .70 294 161 3 129
Mideast
Delaware ............... 1.1 1.0 -.2 3.2 1.1 .65 -.04 .44 275 169 -10 116
District of Columbia ... .3 .4 -.2 .7 .3 .28 -.04 .08 82 72 -11 21
Maryland ............... 1.3 1.6 -.1 2.1 1.3 1.13 -.02 .23 2,682 2,263 -32 451
New Jersey ............. .8 .8 0 1.6 .8 .58 -.01 .20 2,618 1,971 -27 673
New York ............... .6 .7 0 1.1 .6 .45 .00 .18 4,353 3,115 -31 1,269
Pennsylvania ........... .9 .8 -.2 2.5 .9 .49 -.03 .44 3,547 1,947 -116 1,716
Great Lakes
Illinois ............... 1.0 1.2 0 1.7 1.0 .83 .01 .21 4,416 3,520 28 867
Indiana ................ 1.1 .8 .1 3.5 1.1 .52 .02 .53 1,888 919 40 929
Michigan ............... .7 .4 0 3.2 .7 .24 .00 .51 2,286 729 1 1,556
Ohio ................... .7 .7 -.2 2.1 .7 .45 -.03 .33 2,515 1,508 -115 1,122
Wisconsin .............. 1.0 .7 0 3.7 1.0 .46 .00 .52 1,619 766 -7 859
Plains
Iowa ................... 1.3 1.1 0 3.5 1.3 .73 .01 .51 1,046 613 7 427
Kansas ................. 1.8 2.2 .1 2.4 1.8 1.46 .01 .35 1,439 1,153 9 277
Minnesota .............. .9 .7 .2 3.3 .9 .48 .04 .41 1,588 823 62 702
Missouri ............... .5 .3 -.2 2.0 .5 .22 -.03 .32 851 368 -55 537
Nebraska ............... 2.6 3.4 .2 2.5 2.6 2.17 .04 .35 1,326 1,123 23 180
North Dakota ........... 4.8 6.6 0 4.0 4.8 4.10 .01 .67 815 700 1 114
South Dakota ........... 4.2 6.0 .2 2.6 4.2 3.72 .04 .39 858 768 9 81
Southeast
Alabama ................ 1.1 1.3 -.2 1.7 1.1 .83 -.03 .31 1,272 952 -37 356
Arkansas ............... 1.7 2.1 -.1 1.9 1.7 1.30 -.01 .39 1,081 841 -9 249
Florida ................ .9 1.1 0 1.4 .9 .67 .01 .23 4,566 3,373 45 1,149
Georgia ................ 1.3 1.6 0 1.1 1.3 1.12 -.01 .14 3,119 2,779 -18 359
Kentucky ............... 1.1 1.0 0 2.5 1.1 .62 .00 .47 1,155 662 -4 496
Louisiana .............. 1.0 1.0 -.1 1.8 1.0 .62 -.01 .36 1,124 714 -10 420
Mississippi ............ 1.8 2.2 0 2.1 1.8 1.39 .00 .45 1,197 903 1 293
North Carolina ......... 1.0 1.5 -.2 .7 1.0 .96 -.04 .11 2,364 2,212 -95 247
South Carolina ......... .6 .3 -.1 2.3 .6 .19 -.02 .40 595 201 -23 417
Tennessee .............. .8 .7 -.5 2.2 .8 .49 -.08 .39 1,284 782 -121 623
Virginia ............... 1.3 1.5 -.3 2.0 1.3 1.08 -.05 .22 3,033 2,611 -113 535
West Virginia .......... 1.3 1.3 -.3 2.4 1.3 .74 -.05 .58 548 318 -20 250
Southwest
Arizona ................ .9 .9 -.1 2.0 .9 .58 -.03 .30 1,238 842 -40 436
New Mexico ............. 1.1 1.0 -.1 2.4 1.1 .67 -.02 .41 483 305 -9 187
Oklahoma ............... .9 .9 -.1 1.8 .9 .57 -.01 .32 780 507 -8 281
Texas .................. 1.0 1.2 -.2 1.1 1.0 .84 -.03 .14 5,941 5,268 -173 846
Rocky Mountain
Colorado ............... .7 .9 0 1.1 .7 .63 .00 .10 1,109 950 1 158
Idaho .................. 1.5 1.3 0 4.1 1.5 .87 .01 .61 509 298 3 208
Montana ................ 1.5 1.6 0 3.3 1.5 1.00 -.01 .54 353 230 -2 125
Utah ................... 1.0 1.0 -.2 2.1 1.0 .74 -.03 .25 540 418 -19 141
Wyoming ................ 1.4 1.6 .4 2.7 1.4 .99 .09 .34 219 153 14 52
Far West
Alaska ................. 1.1 1.0 -.1 3.0 1.1 .65 -.01 .50 238 136 -2 105
California ............. .8 1.2 -.2 -.1 .8 .83 -.03 -.01 9,185 9,743 -388 -169
Hawaii ................. 2.0 2.6 -.1 1.5 2.0 1.82 -.01 .18 757 693 -5 69
Nevada ................. .8 1.0 -.2 1.6 .8 .68 -.05 .18 540 455 -33 118
Oregon ................. .8 1.1 -.1 1.0 .8 .72 -.03 .16 860 730 -31 162
Washington ............. .6 .8 -.2 .8 .6 .54 -.03 .11 1,251 1,084 -60 227
BEA regions
New England .............. .8 .8 -.1 2.0 .8 .55 -.02 .27 4,276 2,919 -106 1,464
Mideast .................. .8 .9 -.1 1.7 .8 .57 -.01 .25 13,557 9,537 -228 4,247
Great Lakes .............. .9 .8 0 2.6 .9 .53 .00 .38 12,724 7,442 -53 5,334
Plains ................... 1.3 1.4 0 2.7 1.3 .94 .01 .39 7,923 5,548 57 2,318
Southeast ................ 1.1 1.3 -.1 1.7 1.1 .82 -.02 .27 21,337 16,348 -405 5,394
Southwest ................ .9 1.1 -.2 1.4 .9 .77 -.03 .19 8,441 6,922 -230 1,749
Rocky Mountain ........... 1.0 1.0 0 2.1 1.0 .73 .00 .24 2,731 2,050 -2 684
Far West ................. .8 1.2 -.2 .2 .8 .80 -.03 .03 12,831 12,840 -520 511
---------------------------------------------------------------------------------------------------------------------------------------------------
1. Net earnings is earnings by place of work-the sum of wage and salary disbursements (payrolls), other labor income, and proprietors'
income-less personal contributions for social insurance plus an adjustment to convert earnings by place of work to a place-of-residence basis.
Note: Estimates may not add to totals because of rounding.
Source: U.S. Bureau of Economic Analysis
Table 3. Earnings by Major Industry, by State and Region, 2002:IV-2003:I
-----------------------------------------------------------------------------------------------------------------------------------------------------------------------------------
Percent change
------------------------------------------------------------------------------------------------------------------------------------------------------
Earnings by industry
-----------------------------------------------------------------------------------------------------------------------------------------
Nondur- Pro-
Earnings Natural Durable able Transpor- fessional
by place resources Con- goods goods Trade tation Infor- Financial and Education Leisure
of work /1 and mining struction manu- manu- and mation activities business and health and hos- Other Govern-
facturing facturing utilities services services pitality services ment
-----------------------------------------------------------------------------------------------------------------------------------------------------------------------------------
United States .............. 1.1 5.3 1.4 -0.2 0.6 0.3 0.8 -0.3 1.6 0.9 1.7 0.3 0.8 1.9
New England
Connecticut ............ .8 4.1 -.3 -.6 .4 .5 1.4 .6 1.2 .9 1.4 0 1.0 1.1
Maine .................. .9 2.5 1.0 -.5 -2.9 .1 -.2 .1 .8 .9 2.0 .4 1.1 2.6
Massachusetts .......... .7 -.6 -.3 -.3 1.3 .7 .8 -.4 1.8 0 1.8 1.1 1.3 .8
New Hampshire .......... 1.1 -.7 2.5 -2.6 0 -.3 .9 -.8 1.6 1.9 2.3 .9 1.9 3.8
Rhode Island ........... 1.4 1.8 2.6 -.1 .6 .9 3.1 1.4 1.8 .5 2.2 .3 2.0 1.6
Vermont ................ 1.5 -9.8 4.9 -.6 1.5 1.1 3.4 1.2 1.1 .1 1.9 -.2 2.6 3.3
Mideast
Delaware ............... .9 109.2 .1 -8.6 -1.0 1.2 2.3 .5 1.8 1.0 1.6 -1.0 .9 .4
District of Columbia ... 2.1 -15.1 -4.0 -2.1 -2.2 -.2 -.9 ---/2 .4 2.5 .3 ---/2 -.9 4.8
Maryland ............... 1.5 6.9 0 .2 2.6 1.0 .6 .9 1.8 1.6 2.1 0 3.0 1.8
New Jersey ............. .9 6.4 1.9 .7 .9 0 .8 .2 1.3 .9 1.5 -1.9 1.7 1.5
New York ............... .7 -2.0 1.6 -1.3 .2 .7 1.5 -2.0 1.5 .2 1.6 .3 1.2 1.2
Pennsylvania ........... .8 -3.2 1.4 -.7 -.1 -.1 0 .3 1.7 0 2.1 .5 1.2 2.1
Great Lakes
Illinois ............... 1.3 15.5 3.4 .9 .3 .6 .2 .6 1.7 2.1 1.8 -1.3 -1.1 .6
Indiana ................ .8 27.2 .9 .3 1.0 -.1 1.8 .3 2.0 -1.9 1.6 -1.4 .6 1.4
Michigan ............... .4 -19.1 2.4 -1.1 1.4 0 .8 1.5 1.0 .5 1.9 .7 .1 .6
Ohio ................... .7 6.1 -.1 -.7 1.5 -.2 1.0 .1 1.6 1.1 1.8 .1 0 1.1
Wisconsin .............. .8 -30.3 -3.1 .4 2.3 1.6 2.4 .9 1.7 1.6 2.1 .9 2.9 -.1
Plains
Iowa ................... 1.1 5.4 1.4 .6 .3 .8 .3 .5 1.3 .2 1.7 .3 1.3 1.4
Kansas ................. 2.3 49.1 2.6 -.4 1.1 .9 1.7 .4 2.0 .7 2.0 0 .1 2.9
Minnesota .............. .8 -15.4 1.3 .7 1.6 -.5 .5 .6 .7 1.0 3.8 1.1 .3 .6
Missouri ............... .3 -7.1 1.5 -.4 .6 .1 -.1 .1 2.0 -1.0 -.3 1.5 1.6 1.1
Nebraska ............... 3.2 56.8 2.9 -.6 .8 .5 -.1 -.3 3.8 .8 1.7 -1.7 -.1 2.1
North Dakota ........... 6.0 111.6 -.2 1.8 0 .3 0 3.3 3.2 .9 2.4 .4 .9 2.2
South Dakota ........... 5.6 137.0 .2 .1 2.2 -.1 1.8 1.2 2.1 .8 1.5 .3 2.3 1.1
Southeast
Alabama ................ 1.3 ---/2 1.9 -.1 .9 .7 -.4 .9 1.5 .5 2.2 ---/2 1.4 2.0
Arkansas ............... 2.0 26.5 .5 .4 1.5 .1 1.9 .8 1.1 .5 2.2 .8 .5 1.8
Florida ................ 1.2 3.1 .8 .3 -.6 .3 .1 -.5 1.8 1.4 1.3 .1 1.4 2.8
Georgia ................ 1.6 13.5 4.0 .6 -1.3 .7 1.4 .2 1.3 2.0 2.0 1.0 .8 2.5
Kentucky ............... 1.1 -8.2 3.4 1.4 .2 .1 1.7 .3 2.4 .2 1.8 2.9 -.8 2.0
Louisiana .............. 1.0 -.3 .3 -.2 .2 1.8 1.0 1.8 .7 .3 2.2 .2 .7 1.6
Mississippi ............ 2.2 44.8 1.3 -.2 1.0 1.0 2.2 .8 1.6 -1.1 1.2 -1.0 1.3 2.3
North Carolina ......... 1.5 18.7 -1.0 -.6 -.2 .9 ---/2 ---/2 2.0 2.8 1.2 .2 .2 2.7
South Carolina ......... .3 -1.7 .2 -2.7 -.1 -.5 3.5 .9 0 -1.2 .4 -1.0 .5 2.7
Tennessee .............. .8 -35.1 -.8 .1 .5 0 -1.1 -.3 2.0 1.3 2.7 .9 .7 2.6
Virginia ............... 1.4 -6.5 -1.2 1.5 -.1 .4 1.3 .7 1.6 1.2 1.4 -.7 1.4 3.6
West Virginia .......... 1.3 -1.5 8.0 -1.6 -.5 1.3 1.6 -1.3 1.5 2.6 1.8 1.5 1.6 1.0
Southwest
Arizona ................ .9 -5.4 2.5 -.4 .9 .4 2.3 0 1.4 .5 2.4 .6 1.2 1.0
New Mexico ............. 1.1 -2.3 2.8 .4 -.2 1.3 -1.6 .9 2.3 -.9 2.6 .9 1.9 1.8
Oklahoma ............... .9 -2.6 2.7 -.5 1.1 -.2 3.0 -1.6 1.2 1.8 .6 -.3 2.0 2.1
Texas .................. 1.2 1.3 2.1 .2 1.4 .1 .3 .1 1.4 1.0 2.5 .2 .7 2.3
Rocky Mountain
Colorado ............... .9 8.3 .1 -1.9 .7 -.3 .4 .2 3.0 .3 1.0 1.7 -.8 2.0
Idaho .................. 1.3 9.2 2.0 -2.6 -1.5 -.4 .4 -.5 2.1 1.6 2.1 1.4 -1.0 1.8
Montana ................ 1.6 27.0 1.2 .7 .4 -.5 0 2.6 .6 .4 1.3 .2 0 -.5
Utah ................... 1.1 3.2 -2.0 -1.2 1.6 0 1.0 4.6 2.5 1.4 1.3 0 1.7 2.1
Wyoming ................ 1.6 4.9 2.7 1.0 -2.4 .9 ---/2 ---/2 1.5 -1.3 .9 .6 ---/2 1.9
Far West
Alaska ................. 1.0 ---/2 -.3 ---/2 ---/2 1.1 .9 -2.9 1.4 -.5 1.2 -.8 ---/2 2.5
California ............. 1.3 7.5 2.8 -.1 1.2 .4 .6 -.4 1.6 1.2 1.2 .9 .7 2.1
Hawaii ................. 2.7 .5 4.0 ---/2 ---/2 .6 1.3 .4 1.1 1.3 3.1 .7 .8 5.2
Nevada ................. 1.0 -5.0 1.8 1.8 -.5 .6 1.3 -1.8 1.5 -.7 2.4 1.2 1.4 2.0
Oregon ................. 1.2 11.6 -1.5 .2 -.9 .6 .6 0 2.4 1.0 2.3 .5 2.2 1.2
Washington ............. .8 8.5 1.2 -.9 .6 .2 1.1 -3.7 1.5 1.4 2.0 0 1.6 1.7
BEA regions
New England .............. .8 .1 .4 -.6 .5 .5 1.2 0 1.6 .4 1.8 .6 1.4 1.4
Mideast .................. .9 -2.7 1.3 -.7 .4 .4 .8 ---/2 1.5 .6 1.7 ---/2 1.3 1.9
Great Lakes .............. .8 2.9 1.3 -.2 1.2 .3 1.0 .7 1.6 1.1 1.8 -.3 .1 .8
Plains ................... 1.4 26.0 1.6 .2 1.0 .2 .4 .3 1.6 .2 1.8 .7 .8 1.4
Southeast ................ 1.3 ---/2 .9 .1 -.1 .5 ---/2 ---/2 1.6 1.3 1.6 ---/2 .9 2.6
Southwest ................ 1.1 .3 2.3 0 1.3 .2 .7 0 1.4 .9 2.3 .3 .9 2.1
Rocky Mountain ........... 1.1 9.2 .2 -1.7 .4 -.2 ---/2 ---/2 2.6 .6 1.2 1.1 ---/2 1.8
Far West ................. 1.2 ---/2 2.3 -.2 1.0 .4 .7 -1.0 1.6 1.1 1.5 .8 ---/2 2.1
-----------------------------------------------------------------------------------------------------------------------------------------------------------------------------------
1. Earnings by place of work is the sum of wage and salary disbursements (payrolls), other labor income, and proprietors' income.
2. Data are suppressed to avoid disclosure of confidential information.
Source: U.S. Bureau of Economic Analysis
Underlying detail is available in an aggregated table.
Table 4. Contributions to Percent Change in Earnings, by State and Region, 2002:IV-2003:I
-----------------------------------------------------------------------------------------------------------------------------------------------------------------------------
Percent change
------------------------------------------------------------------------------------------------------------------------------------------------
Earnings by industry
--------------------------------------------------------------------------------------------------------------------------------------
Nondur- Pro-
Earnings Natural Durable able Transpor- fessional Education Leisure
by place resources Con- goods goods tation Infor- Financial and and and hos- Other Govern-
of work/1 and mining struction manu- manu- Trade and mation activities business health pitality services ment
facturing facturing utilities services services
-----------------------------------------------------------------------------------------------------------------------------------------------------------------------------
United States .............. 1.1 0.09 0.09 -0.02 0.03 0.04 0.04 -0.01 0.14 0.14 0.19 0.02 0.02 0.32
New England
Connecticut ............ .8 .01 -.02 -.06 .02 .06 .04 .02 .21 .15 .17 .00 .02 .15
Maine .................. .9 .04 .06 -.04 -.18 .02 -.01 .00 .06 .10 .31 .02 .03 .49
Massachusetts .......... .7 .00 -.02 -.03 .04 .07 .02 -.02 .23 .00 .27 .04 .03 .10
New Hampshire .......... 1.1 .00 .18 -.30 .00 -.05 .02 -.02 .13 .23 .31 .05 .06 .48
Rhode Island ........... 1.4 .01 .15 -.01 .03 .10 .10 .05 .18 .06 .37 .01 .05 .30
Vermont ................ 1.5 -.15 .32 -.08 .05 .14 .13 .03 .07 .01 .29 -.01 .07 .57
Mideast
Delaware ............... .9 .47 .01 -.41 -.06 .13 .07 .01 .22 .21 .17 -.04 .02 .07
District of Columbia ... 2.1 -.49 -.06 .00 .00 .00 -.01 ---/2 .02 .63 .03 ---/2 -.06 1.92
Maryland ............... 1.5 .03 .00 .01 .07 .11 .02 .03 .15 .26 .24 .00 .09 .44
New Jersey ............. .9 .02 .10 .03 .05 -.01 .03 .01 .14 .17 .16 -.07 .04 .21
New York ............... .9 -.01 .07 -.06 .00 .07 .05 -.13 .29 .03 .20 .01 .03 .18
Pennsylvania ........... .8 -.03 .09 -.06 -.01 -.01 .00 .01 .14 .00 .32 .02 .04 .29
Great Lakes
Illinois ............... 1.3 .14 .22 .08 .02 .07 .01 .02 .18 .36 .19 -.05 -.03 .09
Indiana ................ .8 .22 .06 .05 .07 -.01 .09 .01 .12 -.17 .19 -.06 .02 .20
Michigan ............... .4 -.12 .14 -.20 .05 .00 .03 .04 .06 .08 .20 .02 .00 .09
Ohio ................... .7 .04 -.01 -.09 .08 -.02 .04 .00 .11 .14 .21 .01 .00 .18
Wisconsin .............. .8 -.26 -.20 .06 .19 .20 .10 .02 .12 .17 .26 .03 .08 -.02
Plains
Iowa ................... 1.1 .24 .09 .07 .02 .10 .02 .01 .12 .02 .19 .01 .04 .22
Kansas ................. 2.3 .97 .16 -.04 .06 .12 .08 .02 .14 .08 .21 .00 .00 .54
Minnesota .............. .8 -.23 .08 .07 .08 -.07 .02 .02 .07 .15 .44 .04 .01 .08
Missouri ............... .3 -.05 .10 -.03 .03 .01 .00 .00 .15 -.14 -.04 .07 .05 .17
Nebraska ............... 3.2 2.03 .20 -.03 .05 .07 -.01 -.01 .30 .09 .19 -.06 .00 .38
North Dakota ........... 6.0 4.65 -.01 .09 .00 .05 .00 .09 .20 .07 .34 .01 .03 .52
South Dakota ........... 5.6 4.67 .02 .01 .07 -.01 .07 .02 .17 .06 .22 .02 .07 .22
Southeast
Alabama ................ 1.3 ---/2 .13 -.01 .06 .09 -.02 .02 .09 .05 .23 ---/2 .05 .42
Arkansas ............... 2.0 .99 .03 .04 .12 .01 .13 .02 .06 .05 .25 .03 .01 .32
Florida ................ 1.2 .04 .05 .01 -.01 .05 .00 -.02 .17 .23 .15 .01 .05 .47
Georgia ................ 1.6 .16 .23 .03 -.08 .10 .08 .02 .10 .30 .18 .04 .02 .43
Kentucky ............... 1.1 -.26 .20 .17 .01 .01 .10 .01 .14 .01 .21 .12 -.02 .39
Louisiana .............. 1.0 -.02 .02 -.01 .01 .20 .06 .04 .04 .03 .24 .01 .02 .34
Mississippi ............ 2.2 1.25 .08 -.02 .05 .12 .11 .01 .08 -.09 .12 -.06 .04 .53
North Carolina ......... 1.5 .31 -.06 -.05 -.02 .11 ---/2 ---/2 .14 .35 .12 .01 .01 .52
South Carolina ......... .3 -.02 .01 -.24 -.01 -.06 .14 .02 .00 -.13 .04 -.05 .01 .56
Tennessee .............. .8 -.24 -.04 .01 .03 -.01 -.06 -.01 .14 .17 .36 .05 .02 .37
Virginia ............... 1.4 -.06 -.08 .07 .00 .04 .05 .03 .10 .24 .12 -.02 .04 .89
West Virginia .......... 1.3 -.08 .46 -.11 -.03 .15 .08 -.03 .07 .22 .26 .07 .05 .24
Southwest
Arizona ................ .9 -.10 .21 -.04 .01 .05 .09 .00 .14 .08 .24 .04 .03 .18
New Mexico ............. 1.1 -.12 .18 .02 .00 .14 -.06 .02 .11 -.12 .26 .04 .05 .54
Oklahoma ............... .9 -.16 .14 -.04 .07 -.02 .17 -.05 .07 .19 .06 -.01 .06 .46
Texas .................. 1.2 .07 .14 .01 .06 .02 .02 .01 .12 .13 .23 .01 .02 .37
Rocky Mountain
Colorado ............... .9 .18 .01 -.11 .01 -.03 .02 .01 .28 .05 .08 .09 -.02 .34
Idaho .................. 1.3 .58 .18 -.24 -.06 -.05 .01 -.01 .11 .21 .20 .06 -.03 .33
Montana ................ 1.6 1.33 .09 .02 .01 -.07 .00 .06 .03 .04 .17 .01 .00 -.11
Utah ................... 1.1 .05 -.14 -.09 .05 .00 .05 .16 .19 .19 .12 .00 .06 .42
Wyoming ................ 1.6 .69 .24 .02 -.06 .10 ---/2 ---/2 .07 -.11 .07 .04 ---/2 .47
Far West
Alaska ................. 1.0 ---/2 -.03 ---/2 ---/2 .09 .07 -.08 .06 -.04 .10 -.04 ---/2 .81
California ............. 1.3 .12 .18 -.01 .04 .05 .02 -.02 .14 .21 .11 .05 .02 .35
Hawaii ................. 2.7 .01 .26 ---/2 ---/2 .06 .06 .01 .07 .16 .32 .07 .02 1.60
Nevada ................. 1.0 -.08 .21 .05 -.01 .07 .05 -.04 .11 -.09 .18 .25 .03 .30
Oregon ................. 1.2 .31 -.10 .02 -.03 .08 .03 .00 .16 .13 .26 .02 .06 .20
Washington ............. .8 .18 .08 -.08 .02 .02 .04 -.30 .10 .18 .19 .00 .04 .34
BEA regions
New England .............. .8 .00 .02 -.06 .02 .06 .03 .00 .20 .07 .26 .03 .03 .20
Mideast .................. .9 -.02 .07 -.04 .02 .04 .03 ---/2 .20 .10 .22 ---/2 .04 .31
Great Lakes .............. .8 .02 .08 -.03 .07 .04 .04 .02 .12 .16 .20 -.01 .00 .11
Plains ................... 1.4 .54 .10 .02 .05 .02 .02 .01 .14 .03 .21 .03 .02 .23
Southeast ................ 1.3 ---/2 .06 .00 .00 .06 ---/2 ---/2 .11 .18 .18 ---/2 .03 .50
Southwest ................ 1.1 .01 .15 .00 .05 .02 .04 .00 .12 .11 .22 .01 .02 .36
Rocky Mountain ........... 1.1 .31 .01 -.10 .01 -.02 ---/2 ---/2 .21 .09 .11 .06 ---/2 .33
Far West ................. 1.2 ---/2 .15 -.01 .03 .05 .03 -.06 .13 .18 .14 .05 ---/2 .38
-----------------------------------------------------------------------------------------------------------------------------------------------------------------------------
1. Earnings by place of work is the sum of wage and salary disbursements (payrolls), other labor income, and proprietors' income.
2. Data are suppressed to avoid disclosure of confidential information.
Source: U.S. Bureau of Economic Analysis
Underlying detail is available in an aggregated table.
Table 5. Year over year growth, by State, 2000:I-2003:I
---------------------------------------------------------------------------------------------------------------------------------------------
Percent change from same quarter a year earlier
-------------------------------------------------------------------------------------------------------------------
2000:I 2000:II 2000:III 2000:IV 2001:I 2001:II 2001:III 2001:IV 2002:I 2002:II 2002:II 2002:IV 2003:I
---------------------------------------------------------------------------------------------------------------------------------------------
United States........... 7.3 8.1 8.7 7.7 5.5 3.9 2.5 1.4 1.4 2.5 2.7 3.3 3.4
Highest Quintile
North Dakota........... 8.2 8.8 9.5 5.3 3.7 1.9 2.4 2.1 3.0 1.3 2.4 3.7 6.5
South Dakota........... 7.4 6.4 5.6 3.9 3.2 3.0 3.6 3.2 0.9 0.0 0.9 1.5 7.4
Nebraska............... 5.4 6.1 5.7 3.2 5.3 4.3 3.7 3.8 2.6 2.6 3.0 3.4 5.3
Hawaii................. 4.8 6.0 4.8 6.0 5.4 3.4 3.8 1.9 3.6 5.0 4.9 6.3 5.5
Mississippi............ 4.9 5.7 5.1 3.9 4.9 3.7 3.4 3.7 3.2 3.6 3.9 4.2 4.6
Kansas................. 4.4 6.5 7.7 3.6 6.3 4.0 2.7 3.1 2.1 1.8 1.4 2.4 3.3
Arkansas............... 5.2 5.3 6.5 4.6 4.9 4.3 3.2 3.8 2.9 3.6 3.5 4.1 5.0
Vermont................ 7.3 8.3 7.0 7.7 6.9 5.3 5.3 3.5 2.6 2.7 3.1 3.9 4.7
Montana................ 6.0 6.4 9.0 6.2 6.3 5.6 5.0 3.0 3.5 3.5 3.8 5.4 4.8
Idaho.................. 8.1 8.7 8.1 6.6 5.0 4.1 3.8 2.4 3.8 2.6 3.6 5.0 4.0
Fourth Quintile
Wyoming................ 6.0 6.8 6.5 7.7 5.9 6.0 6.6 4.8 5.1 4.0 3.6 3.8 4.6
Rhode Island........... 6.4 7.1 7.1 7.0 5.7 4.7 4.1 2.8 3.0 4.0 3.8 4.3 4.1
Maryland............... 7.2 7.9 8.4 8.8 6.7 5.9 4.6 2.9 3.2 3.7 3.8 4.3 4.0
West Virginia.......... 4.5 5.7 5.4 5.4 5.2 4.3 4.3 3.7 3.8 3.4 3.2 3.2 3.1
Virginia............... 6.3 9.0 9.3 8.6 7.1 6.3 3.9 2.6 1.6 1.9 3.0 3.1 3.8
Georgia................ 7.9 8.6 9.1 7.9 5.2 4.1 3.1 2.1 2.1 2.7 2.2 2.9 3.4
Iowa................... 6.4 8.0 6.9 5.2 4.3 2.5 2.2 1.8 3.1 3.4 3.3 4.4 3.4
Maine.................. 7.7 7.7 5.8 7.4 6.8 5.0 4.4 3.7 3.6 4.3 4.5 5.0 4.0
Alaska................. 6.4 6.7 8.0 6.3 4.6 5.2 4.5 3.9 3.9 3.1 4.1 5.3 5.2
Alabama................ 5.0 5.3 5.1 4.7 4.7 3.9 3.7 2.6 2.3 2.5 2.9 4.0 4.0
Third Quintile
Kentucky............... 7.8 7.9 8.2 6.9 4.1 3.4 3.0 1.9 2.9 3.6 3.7 4.8 4.2
Indiana................ 6.5 7.3 7.6 4.9 3.6 2.4 1.7 2.2 1.7 2.9 3.4 4.5 4.3
New Mexico............. 4.6 5.3 5.6 5.4 6.9 6.0 6.7 6.2 5.4 5.0 4.2 5.1 4.6
Delaware............... 5.8 8.0 8.2 8.5 6.5 5.7 4.8 2.3 2.7 1.9 1.3 1.4 1.9
Illinois............... 6.6 7.2 8.4 7.7 5.3 3.3 2.2 0.5 0.4 2.2 1.6 2.4 2.8
North Carolina......... 6.5 7.2 9.4 7.1 5.2 3.5 2.0 1.1 1.7 2.1 2.6 3.0 2.4
Wisconsin.............. 6.2 6.6 6.6 5.7 4.9 3.6 3.2 2.1 2.7 3.5 3.4 4.1 3.7
Louisiana.............. 4.1 4.6 5.3 4.5 5.4 5.1 5.8 5.6 4.5 4.5 3.4 3.8 3.8
Utah................... 7.4 7.7 7.3 7.0 5.2 4.7 4.1 3.1 2.6 1.8 1.7 2.6 2.9
Texas.................. 8.3 8.9 9.8 8.0 6.5 4.1 2.6 1.8 0.4 2.1 1.8 2.3 3.1
Second Quintile
Minnesota.............. 7.0 8.1 9.0 8.2 6.3 4.1 2.8 1.4 1.9 3.1 4.0 4.0 3.8
Florida................ 6.1 6.8 7.6 7.9 5.9 5.1 4.2 2.8 3.3 3.8 3.7 4.7 4.2
New Hampshire.......... 12.1 11.2 11.0 10.4 6.0 4.9 2.9 1.0 0.3 2.6 2.6 3.1 3.2
Pennsylvania........... 6.0 6.7 7.4 7.1 5.4 4.0 3.2 1.4 2.6 3.2 3.2 3.9 3.0
Oklahoma............... 5.6 6.8 8.2 7.4 6.5 4.8 3.6 2.6 1.5 1.5 1.4 1.5 2.7
Arizona................ 10.4 8.1 8.9 8.5 5.0 5.9 5.2 3.2 3.7 3.8 3.3 4.9 4.0
Oregon................. 7.2 7.6 8.1 5.9 4.7 3.0 1.6 1.4 0.9 2.3 2.8 4.1 4.0
Nevada................. 7.3 9.1 9.4 8.1 7.1 5.7 5.3 2.3 3.0 2.7 3.2 6.1 4.7
Tennessee.............. 6.7 6.3 6.6 5.6 3.8 3.2 2.5 1.7 2.3 3.2 2.8 3.7 3.4
California............. 9.9 10.3 12.5 9.6 5.9 4.1 0.5 0.3 0.5 2.0 2.9 3.7 3.5
Lowest Quintile
New Jersey............. 7.3 10.8 11.5 11.1 6.5 3.5 2.7 0.8 3.4 3.3 3.4 3.5 2.1
Michigan............... 6.8 6.4 6.1 4.8 1.6 1.4 1.2 0.9 0.0 3.0 3.2 3.6 4.7
Ohio................... 5.5 5.2 5.4 4.0 2.4 2.5 2.3 1.8 1.7 2.4 2.5 3.1 3.2
Colorado............... 9.5 11.7 13.7 10.7 9.0 4.6 1.4 -0.1 -0.7 0.7 1.2 2.2 2.6
Connecticut............ 7.7 8.6 8.5 8.4 6.3 3.9 1.8 -0.1 0.6 1.6 2.4 2.7 1.5
Massachusetts.......... 11.4 11.3 12.3 10.8 6.3 4.4 1.1 -0.3 -1.2 1.4 1.4 1.9 2.4
New York............... 5.5 8.3 7.7 10.6 6.8 3.4 2.0 -0.6 -2.1 0.4 0.5 0.9 2.3
Washington............. 9.3 9.2 6.3 4.5 1.2 4.6 3.4 1.1 2.8 2.0 4.0 5.0 3.7
South Carolina......... 6.6 7.5 7.3 6.4 5.8 3.3 3.2 2.1 2.3 3.6 3.3 4.2 3.0
Missouri............... 6.2 7.6 8.1 6.7 5.0 3.2 2.7 2.1 2.5 2.7 2.6 3.5 2.7
District of Columbia... 8.9 10.0 10.1 10.6 3.6 2.8 1.5 -0.6 4.6 5.8 6.4 9.0 5.2
---------------------------------------------------------------------------------------------------------------------------------------------
Note: States ranked according to 2002:IV to 2003:I growth
|