|
The tables in this release are available in an XLS spreadsheet and the entire release is available in PDF format.
Many of the tables in our news releases are very wide. Printing tips are available.
| Sharon Panek: |
(202) |
606–9228 |
| Clifford Woodruff: |
(202) |
606–9234 |
BEA 04—56 |
COMPREHENSIVE REVISION OF GROSS STATE PRODUCT (GSP), 1977-2002
AND ACCELERATED GSP ESTIMATES FOR 2003
The Bureau of Economic Analysis (BEA) is today releasing new and revised estimates of gross state product (GSP), the most comprehensive measure of the overall economic activity of each state. Today's release provides prototype accelerated GSP estimates for 2003 and the first GSP estimates on a North American Industry Classification System (NAICS) basis for 1998-2002.1
Highlights for 2003
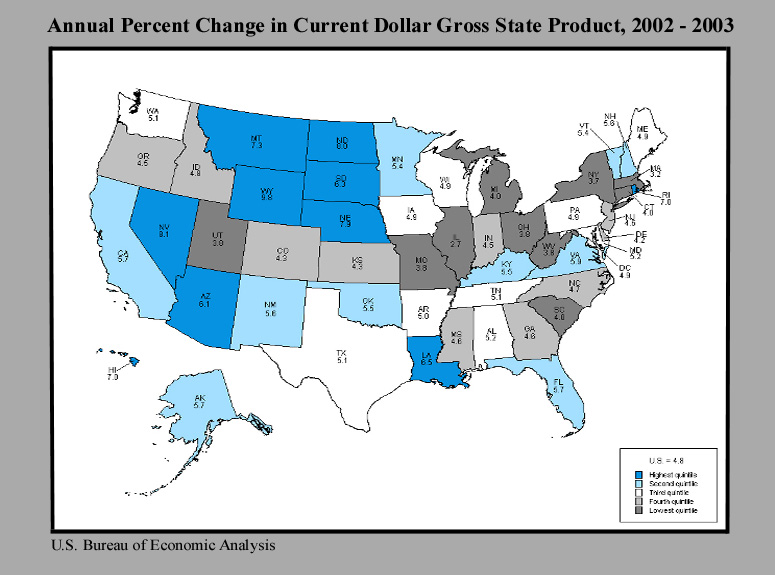
- In 2003, GSP growth accelerated in 38 states and was positive in all states.
- Most of the fastest growing states in 2003 are states that have large concentrations of farming and/or mining activity, including
- Louisiana, Wyoming, Nevada, North Dakota, and Montana, which have large concentrations of mining activity; and
- North and South Dakota, Montana, and Nebraska, which have large concentrations of farming activity.
- For 1999–2003, the fastest growing states—those in the top growth quintile in 2003—were also generally the faster growing states throughout the period, and the slowest growing states—those in the lowest growth quintile in 2003—were generally the slow growing states throughout the period.
Industry Detail for 2002
- In 2002, all states except Louisiana and New York had positive real GSP growth. States in the highest growth quintile had strong growth in services-providing industries.
- High-tech manufacturing, in particular, computer and electronic product manufacturing, was one of the largest contributors to growth in Idaho, Arizona, Minnesota, and New Mexico for 2001–2002.
Revisions to the Estimates
- For 1998–2000, patterns of state economic growth from the revised estimates are similar to those previously published. Based on average annual growth, three states moved out of the top growth quintile into a lower quintile, while only one state moved from the bottom growth quintile.
- The industries with the largest revisions are insurance and banking, where BEA improved the measurement of output for this comprehensive revision. Revisions to these industries are relatively large in certain states.
- The revisions to total GSP for 1977–97 are small in all states, with the largest percentage revision in an economic census year in Louisiana (-2.6 percent in 1992), due mainly to improvements in methodology of the banking and insurance sectors.
Tables 1-4 show these results in more detail. All of these data are available without charge on BEA's Web site:
BEA is interested in your comments
This release marks the first step toward regularly providing more timely estimates of GSP by industry. More details on the 2003 prototype estimates and methodology and on this comprehensive revision of BEA's GSP estimates will appear in an article in the January 2005 issue of the Survey of Current Business, BEA's monthly journal. Given the experimental nature of the accelerated estimates, BEA is interested in your views on the proposed methodology for the estimates, the appropriate level of industry detail, and the tradeoff between accuracy and timeliness. We encourage your feedback on the value of this initiative in BEA's Strategic Plan. Please e-mail your comments to BEA's Associate Director for Regional Economics, John W. Ruser, at gspread@bea.gov
Additional Information
Estimates for 1977–2002 are provided on both a nominal and chained dollar basis, while the prototype 2003 estimates are provided on a nominal basis only. The comprehensive revisions to these estimates, which are carried out every 4 to 5 years, are an important part of BEA's regular process for improving and modernizing its accounts to keep pace with the changing U.S. economy.
The prototype 2003 GSP estimates are being released 12 months after the reference year, an acceleration of six months from the previous schedule. The 2003 estimates are based on BEA wage and salary and proprietors' income estimates released September 28, 2004 and on accelerated GDP by industry estimates released June 17, 2004. Next year, as part of its Strategic Plan goal of significantly accelerating the release of its estimates, BEA plans to release both nominal dollar and real total GSP estimates for 2004 six months after the reference year, and it plans to release NAICS sector-level accelerated GSP estimates 11 months after the reference year.
1 For users interested in a longer historical time series, we also are providing revised GSP estimates for 1977–97 on a Standard Industrial Classification (SIC) basis.
Table 1. Gross State Product in Current Dollars, 2000-2003
[Ranked by 2003 percent change]
Millions of dollars Percent change Percent of U.S. total
------------------------------------------- ------------------------- --------------------------
2000 2001 2002 2003* 2000 2001 2002 2003* 2000 2001 2002 2003*
United States 9,749,105 10,031,393 10,407,141 10,911,103 6.0 2.9 3.7 4.8 100.0 100.0 100.0 100.0
Wyoming 17,798 19,303 20,285 22,265 8.9 8.5 5.1 9.8 0.2 0.2 0.2 0.2
Nevada 73,528 77,077 81,182 87,727 6.6 4.8 5.3 8.1 0.8 0.8 0.8 0.8
North Dakota 17,936 18,500 19,780 21,365 5.2 3.1 6.9 8.0 0.2 0.2 0.2 0.2
Nebraska 55,869 58,117 60,962 65,793 3.8 4.0 4.9 7.9 0.6 0.6 0.6 0.6
Montana 21,535 22,495 23,773 25,510 4.6 4.5 5.7 7.3 0.2 0.2 0.2 0.2
Rhode Island 33,504 34,888 36,988 39,569 7.4 4.1 6.0 7.0 0.3 0.3 0.4 0.4
Hawaii 39,989 41,630 43,998 47,066 3.4 4.1 5.7 7.0 0.4 0.4 0.4 0.4
Louisiana 131,531 132,899 131,584 140,166 6.8 1.0 -1.0 6.5 1.3 1.3 1.3 1.3
South Dakota 23,140 23,901 25,003 26,578 6.5 3.3 4.6 6.3 0.2 0.2 0.2 0.2
Arizona 157,424 163,218 171,781 182,208 6.4 3.7 5.2 6.1 1.6 1.6 1.7 1.7
Virginia 258,280 275,725 287,589 304,432 7.6 6.8 4.3 5.9 2.6 2.7 2.8 2.8
California 1,296,637 1,322,584 1,367,785 1,446,430 9.1 2.0 3.4 5.7 13.3 13.2 13.1 13.3
Alaska 27,498 26,947 29,708 31,410 12.2 -2.0 10.2 5.7 0.3 0.3 0.3 0.3
Florida 469,532 493,218 520,500 550,005 6.2 5.0 5.5 5.7 4.8 4.9 5.0 5.0
New Mexico 50,515 50,745 53,515 56,523 2.4 0.5 5.5 5.6 0.5 0.5 0.5 0.5
New Hampshire 42,655 43,834 46,448 49,047 6.2 2.8 6.0 5.6 0.4 0.4 0.4 0.4
Oklahoma 90,266 92,406 95,126 100,383 7.0 2.4 2.9 5.5 0.9 0.9 0.9 0.9
Kentucky 113,311 117,151 122,282 128,982 -1.8 3.4 4.4 5.5 1.2 1.2 1.2 1.2
Vermont 17,799 18,725 19,604 20,670 5.4 5.2 4.7 5.4 0.2 0.2 0.2 0.2
Minnesota 185,199 189,701 200,061 210,781 6.9 2.4 5.5 5.4 1.9 1.9 1.9 1.9
Alabama 116,265 120,291 125,567 132,145 2.3 3.5 4.4 5.2 1.2 1.2 1.2 1.2
Maryland 179,929 191,293 201,879 212,444 5.3 6.3 5.5 5.2 1.8 1.9 1.9 1.9
Washington 220,459 224,207 232,940 244,915 3.1 1.7 3.9 5.1 2.3 2.2 2.2 2.2
Texas 723,842 744,842 773,455 813,112 8.5 2.9 3.8 5.1 7.4 7.4 7.4 7.5
Tennessee 175,350 180,792 190,122 199,786 2.8 3.1 5.2 5.1 1.8 1.8 1.8 1.8
Arkansas 66,700 69,063 71,929 75,528 1.5 3.5 4.2 5.0 0.7 0.7 0.7 0.7
Maine 35,485 36,989 39,039 40,960 6.2 4.2 5.5 4.9 0.4 0.4 0.4 0.4
Wisconsin 177,561 183,055 190,650 200,014 4.1 3.1 4.1 4.9 1.8 1.8 1.8 1.8
Iowa 91,488 93,219 98,232 103,053 4.8 1.9 5.4 4.9 0.9 0.9 0.9 0.9
Pennsylvania 394,649 409,934 428,950 449,947 3.9 3.9 4.6 4.9 4.0 4.1 4.1 4.1
Idaho 35,251 36,634 38,558 40,403 7.1 3.9 5.3 4.8 0.4 0.4 0.4 0.4
North Carolina 273,278 284,769 300,216 314,377 6.5 4.2 5.4 4.7 2.8 2.8 2.9 2.9
Georgia 289,145 296,786 305,829 320,007 4.8 2.6 3.0 4.6 3.0 3.0 2.9 2.9
Mississippi 64,930 66,233 69,136 72,293 1.8 2.0 4.4 4.6 0.7 0.7 0.7 0.7
New Jersey 345,519 362,866 380,169 397,469 5.6 5.0 4.8 4.6 3.5 3.6 3.7 3.6
Oregon 112,587 111,168 115,138 120,289 7.8 -1.3 3.6 4.5 1.2 1.1 1.1 1.1
Indiana 195,881 196,542 204,946 214,080 4.8 0.3 4.3 4.5 2.0 2.0 2.0 2.0
Colorado 170,350 176,016 179,410 187,120 9.6 3.3 1.9 4.3 1.7 1.8 1.7 1.7
Kansas 83,617 86,887 89,508 93,352 5.4 3.9 3.0 4.3 0.9 0.9 0.9 0.9
Delaware 42,129 44,768 47,150 49,146 6.0 6.3 5.3 4.2 0.4 0.4 0.5 0.5
South Carolina 112,977 117,757 122,354 127,251 3.3 4.2 3.9 4.0 1.2 1.2 1.2 1.2
Connecticut 157,988 162,411 165,744 172,378 6.6 2.8 2.1 4.0 1.6 1.6 1.6 1.6
Michigan 337,976 338,698 351,287 365,277 2.9 0.2 3.7 4.0 3.5 3.4 3.4 3.3
Utah 68,038 70,204 72,974 75,781 6.8 3.2 3.9 3.8 0.7 0.7 0.7 0.7
West Virginia 42,393 43,878 45,518 47,256 0.8 3.5 3.7 3.8 0.4 0.4 0.4 0.4
Ohio 371,952 374,504 388,224 403,015 3.1 0.7 3.7 3.8 3.8 3.7 3.7 3.7
Missouri 175,948 180,977 187,543 194,611 4.4 2.9 3.6 3.8 1.8 1.8 1.8 1.8
New York 762,096 782,552 792,058 821,667 6.2 2.7 1.2 3.7 7.8 7.8 7.6 7.5
Massachusetts 277,103 283,012 288,088 297,343 9.4 2.1 1.8 3.2 2.8 2.8 2.8 2.7
Illinois 466,338 475,265 486,139 499,466 4.9 1.9 2.3 2.7 4.8 4.7 4.7 4.6
District of Columbia 57,936 62,718 66,440 69,707 4.2 8.3 5.9 4.9 0.6 0.6 0.6 0.6
BEA Regions
New England 564,534 579,858 595,910 619,967 7.9 2.7 2.8 4.0 5.8 5.8 5.7 5.7
Mideast 1,782,257 1,854,131 1,916,646 2,000,380 5.4 4.0 3.4 4.4 18.3 18.5 18.4 18.3
Great Lakes 1,549,707 1,568,064 1,621,245 1,681,853 3.9 1.2 3.4 3.7 15.9 15.6 15.6 15.4
Plains 633,198 651,302 681,089 715,532 5.4 2.9 4.6 5.1 6.5 6.5 6.5 6.6
Southeast 2,113,693 2,198,562 2,292,624 2,412,228 4.7 4.0 4.3 5.2 21.7 21.9 22.0 22.1
Southwest 1,022,047 1,051,211 1,093,877 1,152,226 7.7 2.9 4.1 5.3 10.5 10.5 10.5 10.6
Rocky Mountain 312,973 324,653 334,999 351,079 8.3 3.7 3.2 4.8 3.2 3.2 3.2 3.2
Far West 1,770,697 1,803,615 1,870,751 1,977,837 8.1 1.9 3.7 5.7 18.2 18.0 18.0 18.1
* Prototype estimates
Source: U.S. Bureau of Economic Analysis
Table 2. Real Gross State Product, 1998-2002
Millions of chained (2000) dollars Percent change
------------------------------------------------------ -------------------------
1998 1999 2000 2001 2002 1999 2000 2001 2002
United States 9,004,664 9,404,246 9,749,105 9,809,501 10,014,936 4.4 3.7 0.6 2.1
New England 508,805 530,553 564,534 569,384 574,116 4.3 6.4 0.9 0.8
Connecticut 148,276 151,013 157,988 158,810 158,902 1.8 4.6 0.5 0.1
Maine 33,333 34,321 35,485 36,059 37,172 3.0 3.4 1.6 3.1
Massachusetts 240,727 255,668 277,103 279,049 279,265 6.2 8.4 0.7 0.1
New Hampshire 39,237 40,531 42,655 43,138 44,813 3.3 5.2 1.1 3.9
Rhode Island 31,016 31,993 33,504 33,908 35,001 3.1 4.7 1.2 3.2
Vermont 16,307 17,058 17,799 18,419 18,940 4.6 4.3 3.5 2.8
Mideast 1,660,122 1,720,392 1,782,257 1,812,050 1,837,404 3.6 3.6 1.7 1.4
Delaware 39,141 41,178 42,129 43,569 44,825 5.2 2.3 3.4 2.9
District of Columbia 54,692 57,498 57,936 60,532 61,938 5.1 0.8 4.5 2.3
Maryland 168,398 174,809 179,929 186,033 191,655 3.8 2.9 3.4 3.0
New Jersey 326,048 333,959 345,519 354,820 365,546 2.4 3.5 2.7 3.0
New York 692,667 725,033 762,096 768,164 764,139 4.7 5.1 0.8 -0.5
Pennsylvania 379,343 388,010 394,649 398,903 409,143 2.3 1.7 1.1 2.6
Great Lakes 1,482,062 1,521,906 1,549,707 1,529,275 1,554,502 2.7 1.8 -1.3 1.6
Illinois 441,504 453,781 466,338 463,374 465,914 2.8 2.8 -0.6 0.5
Indiana 185,982 190,563 195,881 191,457 196,588 2.5 2.8 -2.3 2.7
Michigan 323,876 335,292 337,976 330,622 337,708 3.5 0.8 -2.2 2.1
Ohio 363,492 368,411 371,952 365,389 372,077 1.4 1.0 -1.8 1.8
Wisconsin 167,212 173,865 177,561 178,430 182,215 4.0 2.1 0.5 2.1
Plains 601,322 613,513 633,198 634,918 651,884 2.0 3.2 0.3 2.7
Iowa 87,287 88,777 91,488 90,590 93,613 1.7 3.1 -1.0 3.3
Kansas 79,614 81,432 83,617 84,400 85,535 2.3 2.7 0.9 1.3
Minnesota 171,833 176,701 185,199 185,720 192,612 2.8 4.8 0.3 3.7
Missouri 169,908 172,388 175,948 176,446 179,326 1.5 2.1 0.3 1.6
Nebraska 53,791 54,780 55,869 56,473 57,987 1.8 2.0 1.1 2.7
North Dakota 17,901 17,460 17,936 17,932 18,876 -2.5 2.7 0.0 5.3
South Dakota 21,010 21,983 23,140 23,357 23,944 4.6 5.3 0.9 2.5
Southeast 1,989,427 2,072,914 2,113,693 2,141,936 2,193,457 4.2 2.0 1.3 2.4
Alabama 111,855 116,180 116,265 117,156 119,965 3.9 0.1 0.8 2.4
Arkansas 64,232 67,219 66,700 67,148 68,790 4.7 -0.8 0.7 2.4
Florida 435,006 452,873 469,532 481,004 497,016 4.1 3.7 2.4 3.3
Georgia 264,798 281,559 289,145 290,138 293,752 6.3 2.7 0.3 1.2
Kentucky 115,170 117,656 113,311 113,971 116,992 2.2 -3.7 0.6 2.7
Louisiana 133,027 136,292 131,531 128,864 128,775 2.5 -3.5 -2.0 -0.1
Mississippi 63,950 65,513 64,930 64,320 65,923 2.4 -0.9 -0.9 2.5
North Carolina 249,090 260,755 273,278 277,408 286,307 4.7 4.8 1.5 3.2
South Carolina 107,595 111,623 112,977 114,572 116,695 3.7 1.2 1.4 1.9
Tennessee 168,932 174,533 175,350 176,555 182,219 3.3 0.5 0.7 3.2
Virginia 234,333 245,913 258,280 268,536 274,034 4.9 5.0 4.0 2.0
West Virginia 41,859 43,032 42,393 42,277 42,968 2.8 -1.5 -0.3 1.6
Southwest 934,387 983,533 1,022,047 1,030,819 1,067,429 5.3 3.9 0.9 3.6
Arizona 138,423 149,029 157,424 161,278 166,972 7.7 5.6 2.4 3.5
New Mexico 46,070 50,099 50,515 50,289 52,743 8.7 0.8 -0.4 4.9
Oklahoma 84,856 87,613 90,266 90,164 91,869 3.2 3.0 -0.1 1.9
Texas 665,263 696,809 723,842 729,097 755,872 4.7 3.9 0.7 3.7
Rocky Mountain 277,064 295,252 312,973 317,639 322,653 6.6 6.0 1.5 1.6
Colorado 147,108 158,264 170,350 172,781 173,304 7.6 7.6 1.4 0.3
Idaho 30,113 33,018 35,251 36,251 37,753 9.6 6.8 2.8 4.1
Montana 20,758 21,093 21,535 21,701 22,517 1.6 2.1 0.8 3.8
Utah 62,685 65,428 68,038 68,386 69,526 4.4 4.0 0.5 1.7
Wyoming 16,471 17,480 17,798 18,519 19,542 6.1 1.8 4.0 5.5
Far West 1,552,013 1,666,471 1,770,697 1,773,473 1,813,604 7.4 6.3 0.2 2.3
Alaska 26,520 27,285 27,498 26,132 28,915 2.9 0.8 -5.0 10.7
California 1,115,008 1,205,254 1,296,637 1,302,467 1,329,628 8.1 7.6 0.4 2.1
Hawaii 39,583 39,787 39,989 40,490 41,804 0.5 0.5 1.3 3.2
Nevada 67,242 70,905 73,528 74,896 77,248 5.4 3.7 1.9 3.1
Oregon 100,990 104,510 112,587 110,764 113,165 3.5 7.7 -1.6 2.2
Washington 202,958 218,905 220,459 218,726 222,813 7.9 0.7 -0.8 1.9
Source: U.S. Bureau of Economic Analysis
Table 3. Contributions to Average Annual Growth in Real Gross State Product, 1998-2002
Percentage points
Average ------------------------------------------------------------------------------------------------------------------------------------------------------
annual growth Natural Con- Durable Nondurable Trans- Infor- Financial Professional Education Leisure and Other
in real gross resources struction goods manu- goods manu- Trade portation mation activities and business and health hospitality services Government
state and facturing facturing and utilities services services
product mining
United States 2.7 0.03 -0.03 0.29 -0.04 0.63 0.07 0.30 0.71 0.33 0.19 0.08 -0.02 0.16
New England 3.1 0.04 0.09 0.43 -0.09 0.61 0.00 0.25 1.05 0.31 0.19 0.09 -0.01 0.10
Connecticut 1.7 0.01 -0.05 -0.11 0.00 0.44 -0.01 0.14 1.04 0.05 0.11 0.06 -0.06 0.11
Maine 2.8 0.14 0.02 0.27 -0.37 0.84 0.04 0.18 0.58 0.26 0.41 0.12 -0.07 0.35
Massachusetts 3.8 0.03 0.19 0.85 -0.09 0.54 -0.01 0.33 1.10 0.53 0.17 0.09 0.02 0.01
New Hampshire 3.4 0.03 0.12 -0.32 -0.19 1.13 0.08 0.30 1.28 0.22 0.37 0.13 -0.03 0.25
Rhode Island 3.1 0.05 0.09 0.15 -0.14 0.85 0.01 0.23 1.20 0.19 0.08 0.20 -0.01 0.18
Vermont 3.8 0.07 -0.06 1.38 -0.16 0.93 -0.03 0.20 0.53 0.04 0.47 0.10 -0.01 0.35
Mideast 2.6 0.01 0.02 0.06 0.08 0.55 0.03 0.30 0.87 0.41 0.13 0.05 -0.02 0.06
Delaware 3.4 -0.01 -0.07 0.37 0.11 0.56 0.10 0.14 1.72 0.13 0.14 0.07 -0.02 0.20
District of Columbia 3.2 0.00 0.02 0.00 -0.04 0.07 0.08 0.61 0.45 1.12 0.08 0.17 0.05 0.56
Maryland 3.3 0.01 0.04 0.08 0.04 0.65 0.04 0.23 0.99 0.63 0.25 0.07 0.00 0.25
New Jersey 2.9 0.01 0.06 0.16 0.15 0.74 -0.01 0.19 1.02 0.30 0.16 0.05 -0.01 0.08
New York 2.5 0.02 0.02 0.05 0.00 0.47 0.04 0.38 0.97 0.40 0.10 0.06 -0.02 0.02
Pennsylvania 1.9 0.02 -0.02 -0.03 0.21 0.59 0.04 0.25 0.45 0.35 0.12 0.03 -0.04 -0.07
Great Lakes 1.2 -0.01 -0.10 0.06 -0.06 0.49 0.04 0.14 0.26 0.11 0.15 0.05 -0.05 0.09
Illinois 1.4 0.00 -0.01 -0.06 0.00 0.56 0.05 0.18 0.32 0.10 0.14 0.02 -0.05 0.10
Indiana 1.4 -0.01 -0.19 0.46 0.01 0.49 0.03 0.09 0.20 0.09 0.16 0.07 -0.04 0.04
Michigan 1.1 0.01 -0.11 0.35 -0.18 0.39 0.08 0.13 0.10 0.07 0.12 0.08 -0.05 0.07
Ohio 0.6 -0.04 -0.16 -0.31 -0.12 0.44 0.00 0.12 0.28 0.13 0.13 0.03 -0.04 0.12
Wisconsin 2.2 0.02 -0.07 0.17 0.08 0.63 0.06 0.20 0.46 0.21 0.28 0.08 -0.07 0.10
Plains 2.0 0.01 -0.03 0.14 -0.10 0.60 0.09 0.31 0.51 0.19 0.20 0.06 -0.04 0.10
Iowa 1.8 0.11 -0.14 0.10 0.12 0.48 0.09 0.14 0.68 0.03 0.15 0.02 -0.05 0.03
Kansas 1.8 -0.05 -0.10 -0.03 -0.03 0.52 0.10 1.03 0.24 0.06 0.14 -0.01 -0.09 0.03
Minnesota 2.9 -0.04 0.06 0.20 0.00 0.72 0.09 0.23 0.74 0.27 0.34 0.12 -0.03 0.19
Missouri 1.4 0.02 0.00 0.09 -0.43 0.53 0.10 0.21 0.29 0.30 0.09 0.05 -0.04 0.15
Nebraska 1.9 0.04 -0.07 0.28 0.11 0.61 0.15 0.22 0.22 0.15 0.25 0.05 -0.02 -0.09
North Dakota 1.3 0.24 -0.22 0.04 0.00 0.60 -0.10 0.20 0.40 0.13 0.12 0.01 -0.05 -0.04
South Dakota 3.3 -0.24 0.00 0.77 -0.08 0.82 0.06 0.21 1.48 -0.04 0.29 0.10 0.01 -0.05
Southeast 2.5 -0.05 -0.09 0.15 -0.10 0.65 0.04 0.28 0.72 0.44 0.21 0.08 -0.03 0.16
Alabama 1.8 -0.02 -0.14 0.40 -0.20 0.57 0.04 0.20 0.56 0.24 0.11 0.04 -0.06 0.01
Arkansas 1.7 -0.04 0.00 -0.10 -0.21 0.81 0.04 0.29 0.32 0.29 0.19 0.02 -0.05 0.17
Florida 3.4 0.05 0.05 0.18 -0.08 0.85 0.00 0.35 0.88 0.67 0.20 0.09 -0.02 0.17
Georgia 2.6 -0.02 -0.07 0.16 -0.25 0.66 0.12 0.55 0.56 0.33 0.26 0.09 -0.03 0.28
Kentucky 0.4 0.00 -0.12 -0.47 -0.62 0.52 0.03 0.18 0.48 0.21 0.18 0.04 -0.03 -0.01
Louisiana -0.8 -1.65 -0.67 -0.26 -1.26 0.86 0.17 0.45 0.73 0.21 0.15 0.37 -0.13 0.21
Mississippi 0.8 0.04 -0.21 -0.31 -0.13 0.43 0.00 0.17 0.38 0.09 0.13 0.06 -0.08 0.21
North Carolina 3.5 0.01 -0.16 0.26 0.45 0.64 0.01 0.22 1.23 0.35 0.28 0.09 -0.02 0.18
South Carolina 2.1 0.01 -0.18 0.53 -0.59 0.59 0.07 0.17 0.57 0.39 0.22 0.04 -0.03 0.27
Tennessee 1.9 0.03 -0.20 0.19 -0.08 0.65 0.05 0.24 0.54 0.26 0.21 0.05 -0.04 0.02
Virginia 4.0 0.02 0.03 0.32 0.31 0.60 0.04 0.20 0.90 0.94 0.25 0.09 0.03 0.25
West Virginia 0.7 -0.11 -0.17 0.00 -0.46 0.54 -0.16 0.16 0.36 0.11 0.08 0.14 -0.06 0.25
Southwest 3.4 0.00 -0.01 0.51 -0.13 0.80 0.19 0.31 0.77 0.33 0.24 0.10 -0.02 0.29
Arizona 4.8 0.07 0.03 1.33 -0.06 0.93 0.14 0.29 0.92 0.41 0.32 0.13 -0.01 0.30
New Mexico 3.4 0.15 -0.09 0.73 0.04 0.47 -0.06 0.26 0.77 0.43 0.27 0.07 -0.03 0.43
Oklahoma 2.0 0.11 0.03 -0.31 -0.02 0.69 0.07 0.37 0.50 0.14 0.15 0.07 -0.05 0.25
Texas 3.2 -0.04 -0.02 0.42 -0.17 0.81 0.23 0.31 0.78 0.33 0.23 0.10 -0.02 0.29
Rocky Mountain 3.9 0.20 0.00 0.44 0.01 0.73 0.09 0.47 0.90 0.40 0.24 0.14 0.00 0.24
Colorado 4.2 0.07 0.10 0.34 -0.05 0.80 0.14 0.69 1.02 0.46 0.26 0.14 0.01 0.19
Idaho 5.8 0.50 -0.05 2.37 0.25 0.78 0.11 0.16 0.55 0.48 0.30 0.11 -0.07 0.31
Montana 2.1 0.15 -0.11 -0.10 -0.06 0.69 -0.04 0.27 0.51 0.29 0.26 0.10 -0.03 0.15
Utah 2.6 0.00 -0.22 0.00 -0.01 0.56 0.03 0.24 1.04 0.29 0.16 0.18 0.03 0.34
Wyoming 4.4 1.58 0.10 0.12 0.33 0.68 0.04 0.11 0.42 0.26 0.25 0.11 0.00 0.35
Far West 4.0 0.14 0.02 0.70 0.01 0.74 0.08 0.44 0.82 0.35 0.25 0.14 0.00 0.27
Alaska 2.2 0.55 -0.01 -0.02 -0.19 0.29 0.51 0.23 0.33 0.06 0.34 0.08 0.01 -0.01
California 4.5 0.14 0.09 0.86 0.03 0.81 0.09 0.52 0.91 0.34 0.25 0.13 0.01 0.32
Hawaii 1.4 0.05 -0.05 0.01 -0.07 0.47 0.03 0.12 0.22 0.45 0.04 0.04 -0.09 0.15
Nevada 3.5 -0.07 -0.40 0.04 0.06 0.88 0.14 0.26 1.11 0.36 0.31 0.57 -0.03 0.28
Oregon 2.9 0.22 -0.30 1.12 -0.08 0.47 0.04 0.25 0.48 0.18 0.29 0.09 -0.05 0.18
Washington 2.4 0.14 -0.10 0.03 -0.06 0.56 0.00 0.29 0.57 0.50 0.21 0.08 0.01 0.14
Source: U.S. Bureau of Economic Analysis
Table 4. Revisions to Gross State Product in Current Dollars, 1987, 1992, 1997
1987 1992 1997
----------------------------------- ----------------------------------- -----------------------------------
Millions of dollars Percent Millions of dollars Percent Millions of dollars Percent
Revised Revision revision/1/ Revised Revision revision/1/ Revised Revision revision/1/
United States 4,663,282 -19,963 -0.4 6,174,369 -34,727 -0.6 8,170,994 -53,966 -0.7
New England 287,705 -1,355 -0.5 356,751 -394 -0.1 471,968 632 0.1
Connecticut 81,251 -181 -0.2 104,171 377 0.4 137,452 2,484 1.8
Maine 19,316 -51 -0.3 24,239 -158 -0.6 29,945 -464 -1.5
Massachusetts 138,536 -1,022 -0.7 166,585 -749 -0.4 223,025 -546 -0.2
New Hampshire 21,463 -67 -0.3 26,555 159 0.6 37,136 -334 -0.9
Rhode Island 17,854 -12 -0.1 22,611 -45 -0.2 28,950 -459 -1.6
Vermont 9,286 -21 -0.2 12,590 20 0.2 15,459 -51 -0.3
Mideast 945,813 -3,397 -0.4 1,225,523 -8,883 -0.7 1,539,170 -7,954 -0.5
Delaware 15,553 -214 -1.4 23,031 -38 -0.2 31,269 6 0
District of Columbia 32,240 -158 -0.5 43,757 -701 -1.6 49,427 -1,119 -2.2
Maryland 92,102 -417 -0.5 119,454 -1,280 -1.1 152,259 -2,387 -1.5
New Jersey 175,651 -524 -0.3 233,153 -2,303 -1.0 296,141 -3,845 -1.3
New York 423,760 -1,882 -0.4 532,616 -2,725 -0.5 668,092 4,715 0.7
Pennsylvania 206,507 -203 -0.1 273,513 -1,836 -0.7 341,982 -5,324 -1.5
Great Lakes 763,792 -3,752 -0.5 997,898 1,680 0.2 1,318,280 852 0.1
Illinois 230,594 -1,204 -0.5 303,989 751 0.2 401,068 741 0.2
Indiana 91,170 -805 -0.9 123,570 -34 0.0 164,207 1,254 0.8
Michigan 166,855 -781 -0.5 207,379 713 0.3 278,815 -688 -0.2
Ohio 192,809 -937 -0.5 250,164 -199 -0.1 325,359 -1,092 -0.3
Wisconsin 82,365 -24 0 112,795 448 0.4 148,831 637 0.4
Plains 310,561 -862 -0.3 410,163 -651 -0.2 546,468 -1,322 -0.2
Iowa 45,055 -160 -0.4 61,313 209 0.3 81,881 186 0.2
Kansas 43,883 -158 -0.4 56,091 -247 -0.4 72,509 -489 -0.7
Minnesota 83,947 -32 0 111,919 11 0.0 152,235 -99 -0.1
Missouri 89,836 -530 -0.6 115,209 -784 -0.7 154,459 -1,352 -0.9
Nebraska 26,801 -2 0 37,950 357 0.9 49,820 545 1.1
North Dakota 10,308 115 1.1 12,788 48 0.4 16,067 157 1
South Dakota 10,731 -95 -0.9 14,894 -243 -1.6 19,498 -269 -1.4
Southeast 976,595 -4,478 -0.5 1,309,668 -11,026 -0.8 1,768,862 -22,724 -1.3
Alabama 60,586 -176 -0.3 80,450 -665 -0.8 102,533 -1,680 -1.6
Arkansas 32,190 -159 -0.5 44,312 -298 -0.7 58,746 -395 -0.7
Florida 206,894 -370 -0.2 283,800 -1,718 -0.6 383,980 -5,493 -1.4
Georgia 116,822 -1,061 -0.9 158,265 -2,549 -1.6 230,370 -5,363 -2.3
Kentucky 56,565 -265 -0.5 76,572 -154 -0.2 101,845 310 0.3
Louisiana 76,501 -515 -0.7 88,912 -2,331 -2.6 121,743 -1,806 -1.5
Mississippi 33,626 -218 -0.6 43,676 -546 -1.2 58,278 -465 -0.8
North Carolina 114,126 -606 -0.5 159,245 -732 -0.5 218,357 -3,272 -1.5
South Carolina 53,238 -59 -0.1 71,584 -350 -0.5 94,898 -549 -0.6
Tennessee 81,235 -227 -0.3 111,341 -503 -0.4 150,999 -739 -0.5
Virginia 120,101 -988 -0.8 160,534 -1,256 -0.8 208,597 -3,508 -1.7
West Virginia 24,713 167 0.7 30,977 76 0.2 38,517 236 0.6
Southwest 433,414 -2,322 -0.5 596,325 -2,259 -0.4 855,206 -2,941 -0.3
Arizona 59,171 116 0.2 79,695 695 0.9 122,889 616 0.5
New Mexico 22,981 -183 -0.8 32,581 -277 -0.8 47,559 -270 -0.6
Oklahoma 48,904 38 0.1 61,953 -60 -0.1 79,456 33 0
Texas 302,359 -2,292 -0.8 422,097 -2,616 -0.6 605,302 -3,320 -0.5
Rocky Mountain 124,604 -458 -0.4 169,494 -1,014 -0.6 246,728 -2,455 -1
Colorado 62,873 -485 -0.8 85,110 -734 -0.9 127,946 -1,629 -1.3
Idaho 13,826 13 0.1 20,332 -22 -0.1 29,388 0 0
Montana 11,653 55 0.5 15,043 -41 -0.3 18,769 -138 -0.7
Utah 25,289 87 0.3 35,671 0 0.0 54,584 -486 -0.9
Wyoming 10,963 -128 -1.2 13,337 -218 -1.6 16,041 -203 -1.2
Far West 820,798 -3,339 -0.4 1,108,546 -12,180 -1.1 1,424,312 -18,053 -1.3
Alaska 22,258 233 1.1 22,591 219 1.0 26,884 309 1.2
California 620,177 -4,466 -0.7 819,389 -12,187 -1.5 1,028,645 -16,609 -1.6
Hawaii 23,321 -100 -0.4 35,204 -345 -1.0 37,923 -614 -1.6
Nevada 22,367 201 0.9 36,503 23 0.1 58,949 -299 -0.5
Oregon 44,963 -59 -0.1 63,712 -417 -0.7 97,499 -11 0
Washington 87,712 852 1.0 131,148 528 0.4 174,412 -830 -0.5
1. Revisions to economic census years as a percentage of the previously published estimate.
Source: U.S. Bureau of Economic Analysis
|
|