 |
Available for this release:  Full Release: PDF (143 kb), Full Release: PDF (143 kb),  Tables: XLS (57 kb), Highlights (27 kb) Tables: XLS (57 kb), Highlights (27 kb)
EMBARGOED FOR RELEASE: 8:30 A.M. ET, Wednesday, April 27, 2005
| David Lenze |
(202) |
606–9292 |
BEA–05–17 |
| Kathy Albetski |
(202) |
606–9240 |
| E-mail inquiries: |
RegRelease@bea.gov |
METROPOLITAN AREA PERSONAL AND PER CAPITA INCOME IN 2003
New Light on the Recovery
Personal income increased in all but two of the nation's metropolitan statistical areas (MSAs) from 2002 to 2003, according to newly available estimates released today by the U.S. Bureau of Economic Analysis. This is an improvement over the previous two years when more than twenty metropolitan areas saw their personal income decline. Per capita personal income increased in all but five MSAs from 2002 to 2003, in contrast to the previous two years when that income declined in as many as sixty MSAs.
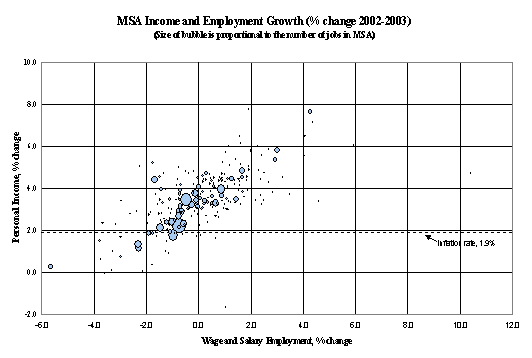
The estimates shed new light on the nature of the recovery in its second year, showing that personal income growth generally strengthened in US cities in 2003, despite often weak or negative employment growth. The chart above illustrates this, plotting for MSAs the percent change in personal income against the percent change in wage and salary employment. Each MSA in the chart is represented by a bubble whose size is proportional to the number of jobs in the MSA. Despite job loss in 178, or nearly one-half, of the MSAs, personal income declined in only two-Yuma, Arizona and Santa Cruz-Watsonville, California. Even when account is taken of the 1.9 percent inflation rate as measured by the national price index for personal consumption expenditure (indicated by the dashed line in the chart), real personal income declined in only 39, or roughly one-tenth, of the MSAs.
While wages and salaries grew at 2.5 percent, several items contributed to strong income growth: personal current transfer receipts (which grew 4.1%), proprietors' income (8.5%), employer contributions for employee pension and insurance funds (10.7%), and military earnings (14.5%).
The bulk of transfer receipts-largely social security, Medicare, and Medicaid-grow with population and the cost of medical care. Most of the growth in military wages represents additional payments to activated reservists and active duty military forces as a consequence of the wars in Iraq and Afghanistan. Military employment rose only slightly. The double-digit increase in employer contributions was mostly due to an unusually large payment to reduce unfunded pension liabilities.
The relative performance of individual MSAs largely reflects their industrial specialization. The fastest growing MSAs tended to depend heavily on the military, motor vehicle manufacturing (the industry making the biggest contribution to pension funds), tourism, or real estate. The slowest growing MSAs tended to have a disproportionately large air transportation, securities, or computer manufacturing sector.
Per capita income rankings. The table below lists the MSAs with highest and lowest per capita incomes. Bridgeport-Stamford-Norwalk, Connecticut had the highest per capita income of all MSAs in 2003. The average income of $60,803 was nearly double the national average. All of the top ten MSAs in 2003 were in the top ten last year. McAllen-Edinburg-Mission, Texas had the lowest per capita income of all MSAs. Its average income of $15,184 was slightly less than half of the national average. Nine of the ten MSAs with the lowest per capita incomes in 2003 also had the lowest incomes in 2002. Provo-Orem, Utah is new to the bottom ten this year, displacing Las Cruces, New Mexico.
Per Capita Personal Income for Metropolitan Statistical Areas
| |
Dollars |
|
Percent of U.S. |
| |
2002 |
2003 |
|
2002 |
2003 |
| United States |
30,804 |
31,472 |
|
100.0 |
100.0 |
| |
|
|
|
|
|
| Highest per capita levels |
|
|
|
|
|
| |
|
|
|
|
|
| Bridgeport-Stamford-Norwalk, CT |
60,098 |
60,803 |
|
195.1 |
193.2 |
| San Francisco-Oakland-Fremont, CA |
46,359 |
46,958 |
|
150.5 |
149.2 |
| San Jose-Sunnyvale-Santa Clara, CA |
46,003 |
46,072 |
|
149.3 |
146.4 |
| Washington-Arlington-Alexandria, DC-VA-MD-WV |
42,987 |
44,056 |
|
139.6 |
140.0 |
| Boston-Cambridge-Quincy, MA-NH |
42,546 |
43,135 |
|
138.1 |
137.1 |
| Naples-Marco Island, FL |
41,730 |
41,513 |
|
135.5 |
131.9 |
| Trenton-Ewing, NJ |
40,698 |
41,499 |
|
132.1 |
131.9 |
| Boulder, CO |
40,590 |
41,110 |
|
131.8 |
130.6 |
| New York-Northern New Jersey-Long Island, NY-NJ-PA |
40,186 |
40,899 |
|
130.5 |
130.0 |
| Vero Beach, FL |
38,925 |
39,953 |
|
126.4 |
126.9 |
| |
|
|
|
|
|
| Lowest per capita levels |
|
|
|
|
|
| |
|
|
|
|
|
| Provo-Orem, UT |
20,101 |
20,462 |
|
65.3 |
65.0 |
| Madera, CA |
19,880 |
20,382 |
|
64.5 |
64.8 |
| Logan, UT-ID |
19,440 |
20,265 |
|
63.1 |
64.4 |
| St. George, UT |
19,856 |
20,084 |
|
64.5 |
63.8 |
| Hanford-Corcoran, CA |
18,918 |
19,390 |
|
61.4 |
61.6 |
| Yuma, AZ |
19,940 |
19,158 |
|
64.7 |
60.9 |
| Hinesville-Fort Stewart, GA |
17,612 |
18,723 |
|
57.2 |
59.5 |
| Laredo, TX |
16,640 |
17,060 |
|
54.0 |
54.2 |
| Brownsville-Harlingen, TX |
16,005 |
16,308 |
|
52.0 |
51.8 |
| McAllen-Edinburg-Mission, TX |
14,790 |
15,184 |
|
48.0 |
48.2 |
Note about data on BEA Web site
The complete set of income and employment estimates for 1969-2003 for counties, metropolitan areas, micropolitan areas, and BEA Economic Areas is now available interactively on BEA's Web site. Detailed annual estimates of earnings and employment by industry, components of personal income, personal current transfer receipts, and farm gross income and expenses by major category for each of the geographic regions are available. These estimates are the only detailed, broadly inclusive, annual measure of economic activity available for local areas. Go to www.bea.gov/bea/regional/reis/ to access these estimates.
BEA Regional Facts (BEARFACTS), a narrative summary of personal income, per capita personal income, and components of income for metropolitan areas and counties, is available on BEA's Web site. Go to www.bea.gov/bea/regional/bearfacts/ to access these summaries.
Data on personal income and per capita personal income for BEA regions, states, and metropolitan areas, as well as data for counties, will be presented in the June issue of the Survey of Current Business, the monthly journal of the Bureau of Economic Analysis. See the end of this release for information on obtaining issues of the Survey of Current Business in printed form and on BEA's Web site. For further information, call (202) 606-5360.
Definitions
Personal income is the income received by all persons from all sources. Personal income is the sum of net earnings by place of residence, rental income of persons, personal dividend income, personal interest income, and personal current transfer receipts. Net earnings is earnings by place of work (the sum of wage and salary disbursements (payrolls), supplements to wages and salaries, and proprietors' income) less contributions for government social insurance, plus an adjustment to convert earnings by place of work to a place-of-residence basis. Personal income is measured before the deduction of personal income taxes and other personal taxes and is reported in current dollars (no adjustment is made for price changes).
The estimate of personal income in the United States is derived as the sum of the county estimates; it differs from the estimate of personal income in the national income and product accounts (NIPAs) because of differences in coverage, in the methodologies used to prepare the estimates, and in the timing of the availability of source data.
Per capita personal income is calculated as the personal income of residents of a given area divided by the resident population of the area. In computing per capita personal income, BEA uses the Census Bureau's annual midyear population estimates.
The metropolitan area definitions used by BEA for its entire series of personal income estimates are the county-based definitions developed by the Office of Management and Budget (OMB) for federal statistical purposes and last updated in February 2005. OMB's general concept of a metropolitan area is that of a geographic area consisting of a large population nucleus together with adjacent communities having a high degree of economic and social integration with the nucleus. The personal income and per capita personal income estimates for the 361 MSAs are shown in Table 1. Detailed personal income estimates for metropolitan statistical areas, micropolitan statistical areas, metropolitan divisions, and combined statistical areas are available on the BEA Web site at www.bea.gov.
BEA's major national, regional, international, and industry estimates; the Survey of Current Business; and BEA news releases are available without charge on BEA's Web site:www.bea.gov. By visiting the site, you can also subscribe to receive free e-mail summaries of BEA releases and announcements.
|
Table 1. Personal Income and Per Capita Personal Income by Metropolitan Area, 2001-2003
Personal income Per capita personal income/1
Millions of dollars Percent Dollars Rank in
Area name change/2 U.S.
2001 2002 2003 2002-2003 2001 2002 2003 2003
United States/3 8,716,992 8,869,809 9,151,694 3.2 30,575 30,804 31,472 ...
Metropolitan portion 7,601,665 7,736,050 7,973,539 3.1 32,198 32,404 33,038 ...
Nonmetropolitan portion 1,115,327 1,133,759 1,178,155 3.9 22,758 23,041 23,827 ...
Metropolitan Statistical Areas/4
Abilene, TX 3,674 3,787 3,920 3.5 23,211 23,956 24,781 296
Akron, OH 20,572 20,945 21,645 3.3 29,466 29,942 30,878 95
Albany, GA 3,552 3,688 3,763 2.0 22,235 23,029 23,258 335
Albany-Schenectady-Troy, NY 26,252 26,224 27,075 3.2 31,655 31,439 32,208 68
Albuquerque, NM 20,693 21,006 21,863 4.1 27,979 27,874 28,519 156
Alexandria, LA 3,605 3,751 3,811 1.6 24,843 25,780 26,062 236
Allentown-Bethlehem-Easton, PA-NJ 22,695 23,599 24,393 3.4 30,280 31,124 31,707 78
Altoona, PA 3,048 3,150 3,248 3.1 23,711 24,674 25,478 266
Amarillo, TX 5,597 5,730 5,934 3.6 24,470 24,825 25,409 269
Ames, IA 2,121 2,178 2,257 3.6 26,653 26,981 28,119 167
Anchorage, AK 11,283 11,840 12,242 3.4 34,619 35,567 36,083 26
Anderson, IN 3,378 3,489 3,568 2.3 25,504 26,439 27,207 194
Anderson, SC 4,218 4,316 4,458 3.3 24,983 25,345 25,946 246
Ann Arbor, MI 11,774 12,232 12,869 5.2 35,867 36,794 38,323 16
Anniston-Oxford, AL 2,477 2,619 2,745 4.8 22,274 23,497 24,492 300
Appleton, WI 6,101 6,313 6,571 4.1 29,676 30,265 31,143 87
Asheville, NC 9,880 10,051 10,339 2.9 26,428 26,594 27,024 200
Athens-Clarke County, GA 3,958 4,034 4,195 4.0 23,555 23,820 24,420 303
Atlanta-Sandy Springs-Marietta, GA 148,043 149,854 153,379 2.4 33,626 33,270 33,308 51
Atlantic City, NJ 7,871 8,030 8,377 4.3 30,796 30,967 31,749 76
Auburn-Opelika, AL 2,416 2,526 2,648 4.8 20,745 21,484 22,227 341
Augusta-Richmond County, GA-SC 12,472 12,933 13,357 3.3 24,787 25,509 26,168 232
Austin-Round Rock, TX 42,489 41,648 42,864 2.9 32,208 30,927 31,135 88
Bakersfield, CA 14,705 15,684 16,371 4.4 21,757 22,630 22,947 338
Baltimore-Towson, MD 89,963 93,311 96,501 3.4 34,887 35,940 36,733 23
Bangor, ME 3,647 3,843 3,965 3.2 24,994 26,163 26,780 208
Barnstable Town, MA 8,542 8,649 8,851 2.3 37,898 37,997 38,638 13
Baton Rouge, LA 17,944 18,816 19,423 3.2 25,262 26,313 26,921 203
Battle Creek, MI 3,500 3,637 3,719 2.3 25,292 26,213 26,778 209
Bay City, MI 2,860 2,842 2,927 3.0 26,061 25,895 26,726 210
Beaumont-Port Arthur, TX 9,337 9,651 10,115 4.8 24,396 25,224 26,417 220
Bellingham, WA 4,336 4,440 4,699 5.8 25,412 25,504 26,617 211
Bend, OR 3,358 3,456 3,612 4.5 27,799 27,513 27,880 170
Billings, MT 3,974 3,992 4,172 4.5 28,331 28,173 29,154 141
Binghamton, NY 6,377 6,451 6,452 0.0 25,352 25,634 25,747 256
Birmingham-Hoover, AL 31,367 32,746 33,873 3.4 29,572 30,723 31,540 80
Bismarck, ND 2,604 2,683 2,874 7.1 27,336 27,890 29,635 130
Blacksburg-Christiansburg-Radford, VA 3,148 3,221 3,345 3.9 20,736 21,328 22,179 342
Bloomington, IN 4,036 4,119 4,301 4.4 23,003 23,462 24,320 308
Bloomington-Normal, IL 4,531 4,621 4,786 3.6 29,727 29,761 30,511 107
Boise City-Nampa, ID 14,078 14,677 15,124 3.0 29,007 29,415 29,562 132
Boston-Cambridge-Quincy, MA-NH 188,442 188,595 191,107 1.3 42,552 42,546 43,135 5
Boulder, CO 12,086 11,295 11,407 1.0 40,435 40,590 41,110 8
Bowling Green, KY 2,443 2,565 2,721 6.1 23,240 24,189 25,316 275
Bremerton-Silverdale, WA 7,172 7,493 7,706 2.8 30,588 31,425 32,140 71
Bridgeport-Stamford-Norwalk, CT 54,989 53,777 54,703 1.7 61,780 60,098 60,803 1
Brownsville-Harlingen, TX 5,347 5,651 5,910 4.6 15,532 16,005 16,308 360
Brunswick, GA 2,489 2,543 2,633 3.5 26,332 26,600 27,202 196
Buffalo-Niagara Falls, NY 32,306 32,725 33,751 3.1 27,756 28,212 29,145 143
Burlington, NC 3,458 3,512 3,556 1.2 25,878 25,895 26,030 240
Burlington-South Burlington, VT 6,323 6,563 6,806 3.7 31,446 32,416 33,446 47
Canton-Massillon, OH 10,766 11,008 11,191 1.7 26,404 26,925 27,274 189
Cape Coral-Fort Myers, FL 14,304 14,626 15,507 6.0 31,155 30,757 31,487 81
Carson City, NV 1,725 1,733 1,819 4.9 32,267 31,767 32,872 61
Casper, WY 2,239 2,297 2,429 5.8 33,464 34,014 35,599 29
Cedar Rapids, IA 7,170 7,273 7,444 2.4 29,903 30,098 30,676 102
Champaign-Urbana, IL 5,651 5,693 5,792 1.7 26,736 26,762 27,006 201
Charleston, WV 8,508 8,716 8,958 2.8 27,671 28,410 29,146 142
Charleston-North Charleston, SC 14,534 15,239 15,911 4.4 26,170 27,035 27,797 171
Charlotte-Gastonia-Concord, NC-SC 44,820 46,485 47,850 2.9 32,604 33,045 33,251 52
Charlottesville, VA 5,539 5,590 5,789 3.6 31,386 31,369 32,179 69
Chattanooga, TN-GA 13,069 13,500 14,018 3.8 27,215 27,932 28,814 151
Cheyenne, WY 2,443 2,608 2,745 5.3 29,672 31,353 32,529 64
Chicago-Naperville-Joliet, IL-IN-WI 323,493 325,145 330,867 1.8 35,157 35,085 35,464 31
Chico, CA 4,798 4,879 5,025 3.0 23,300 23,379 23,799 321
Cincinnati-Middletown, OH-KY-IN 63,114 65,470 67,508 3.1 31,137 32,159 32,979 57
Clarksville, TN-KY 5,493 5,790 6,165 6.5 23,541 24,723 26,095 235
Cleveland, TN 2,521 2,565 2,678 4.4 23,979 24,277 25,205 284
Cleveland-Elyria-Mentor, OH 68,208 69,022 71,051 2.9 31,799 32,219 33,196 54
Coeur d'Alene, ID 2,651 2,784 2,917 4.8 23,705 24,349 24,805 295
College Station-Bryan, TX 3,832 3,937 4,111 4.4 20,741 21,139 21,863 344
Colorado Springs, CO 16,742 17,088 17,505 2.4 30,153 30,329 30,736 100
Columbia, MO 3,960 4,058 4,155 2.4 26,908 27,290 27,680 174
Columbia, SC 17,866 18,472 19,178 3.8 27,255 27,879 28,577 154
Columbus, GA-AL 7,178 7,385 7,552 2.3 25,357 25,808 27,205 195
Columbus, IN 2,094 2,140 2,238 4.6 29,078 29,779 30,936 92
Columbus, OH 51,524 53,554 55,227 3.1 31,415 32,312 32,930 59
Corpus Christi, TX 9,706 10,014 10,439 4.2 24,141 24,763 25,696 260
Corvallis, OR 2,331 2,374 2,411 1.5 29,952 30,037 30,436 110
Cumberland, MD-WV 2,189 2,264 2,337 3.2 21,585 22,388 23,148 337
Dallas-Fort Worth-Arlington, TX 183,488 184,821 188,747 2.1 34,298 33,770 33,790 38
Dalton, GA 2,987 3,097 3,192 3.1 24,191 24,689 25,054 289
Danville, IL 1,836 1,853 1,930 4.2 21,970 22,255 23,283 333
Danville, VA 2,409 2,494 2,536 1.7 21,969 22,864 23,310 332
Davenport-Moline-Rock Island, IA-IL 10,394 10,551 10,824 2.6 27,700 28,134 28,869 149
Dayton, OH 24,658 25,168 26,000 3.3 29,150 29,780 30,748 99
Decatur, AL 3,626 3,716 3,881 4.4 24,747 25,371 26,333 224
Decatur, IL 3,153 3,073 3,132 1.9 27,735 27,294 28,131 166
Deltona-Daytona Beach-Ormond Beach, FL 10,950 11,394 11,880 4.3 24,246 24,797 25,403 270
Denver-Aurora, CO 87,646 88,602 90,239 1.8 39,432 38,923 39,203 11
Des Moines, IA 15,801 16,364 16,941 3.5 32,277 32,967 33,639 39
Detroit-Warren-Livonia, MI 154,130 154,629 161,421 4.4 34,454 34,526 35,972 27
Dothan, AL 3,232 3,370 3,515 4.3 24,592 25,534 26,306 226
Dover, DE 3,161 3,377 3,558 5.4 24,490 25,655 26,438 219
Dubuque, IA 2,346 2,394 2,465 3.0 26,309 26,760 27,241 192
Duluth, MN-WI 7,149 7,369 7,499 1.8 25,849 26,679 27,138 197
Durham, NC 13,506 13,737 14,017 2.0 31,093 31,160 31,466 82
Eau Claire, WI 3,877 3,966 4,072 2.7 25,935 26,375 26,914 204
El Centro, CA 2,742 2,979 3,079 3.4 19,079 20,443 20,674 351
Elizabethtown, KY 2,721 2,833 2,994 5.7 25,112 26,045 27,456 183
Elkhart-Goshen, IN 4,883 5,142 5,540 7.7 26,324 27,659 29,315 136
Elmira, NY 2,202 2,167 2,198 1.4 24,236 23,862 24,349 306
El Paso, TX 13,511 14,056 14,667 4.3 19,650 20,266 20,875 349
Erie, PA 6,902 7,079 7,219 2.0 24,504 25,068 25,505 263
Eugene-Springfield, OR 8,421 8,491 8,698 2.4 25,948 25,966 26,344 223
Evansville, IN-KY 9,611 9,978 10,423 4.5 27,983 28,961 30,073 117
Fairbanks, AK 2,408 2,526 2,606 3.2 28,737 29,795 30,583 104
Fargo, ND-MN 4,926 5,244 5,511 5.1 28,008 29,623 30,804 97
Farmington, NM 2,413 2,468 2,587 4.8 20,767 20,572 21,124 348
Fayetteville, NC 8,076 8,526 9,036 6.0 23,943 25,027 26,209 228
Fayetteville-Springdale-Rogers, AR-MO 8,623 9,152 9,597 4.9 24,090 24,941 25,359 271
Flagstaff, AZ 2,788 2,919 3,071 5.2 23,710 24,331 25,345 272
Flint, MI 11,428 11,601 12,183 5.0 26,034 26,311 27,521 179
Florence, SC 4,679 4,839 4,968 2.7 24,115 24,799 25,296 277
Florence-Muscle Shoals, AL 3,203 3,277 3,398 3.7 22,493 23,102 23,966 317
Fond du Lac, WI 2,753 2,849 2,940 3.2 28,151 29,121 29,951 121
Fort Collins-Loveland, CO 8,165 8,387 8,541 1.8 31,449 31,793 32,037 74
Fort Smith, AR-OK 6,278 6,404 6,628 3.5 22,756 23,023 23,684 323
Fort Walton Beach-Crestview-Destin, FL 4,758 5,053 5,413 7.1 27,708 28,835 30,440 109
Fort Wayne, IN 11,265 11,665 11,982 2.7 28,592 29,390 29,943 122
Fresno, CA 18,593 19,828 20,651 4.2 22,822 23,830 24,277 310
Gadsden, AL 2,278 2,368 2,448 3.4 22,119 22,997 23,744 322
Gainesville, FL 5,729 5,803 6,101 5.1 24,487 24,600 25,706 258
Gainesville, GA 3,668 3,775 3,930 4.1 24,973 24,866 25,132 286
Glens Falls, NY 3,049 3,089 3,206 3.8 24,409 24,586 25,275 278
Goldsboro, NC 2,555 2,619 2,674 2.1 22,564 23,139 23,584 325
Grand Forks, ND-MN 2,358 2,468 2,634 6.7 24,489 25,766 27,513 180
Grand Junction, CO 3,028 3,142 3,248 3.4 25,392 25,718 26,035 239
Grand Rapids-Wyoming, MI 21,581 21,518 22,262 3.5 28,761 28,429 29,188 139
Great Falls, MT 2,081 2,102 2,196 4.5 26,054 26,347 27,523 178
Greeley, CO 4,950 5,021 5,144 2.4 25,575 24,571 24,279 309
Green Bay, WI 8,369 8,666 8,960 3.4 29,275 29,972 30,697 101
Greensboro-High Point, NC 18,463 18,737 19,160 2.3 28,320 28,536 28,940 147
Greenville, NC 3,713 3,822 3,988 4.3 24,046 24,417 25,153 285
Greenville, SC 15,257 15,568 16,039 3.0 26,860 27,177 27,743 172
Gulfport-Biloxi, MS 5,927 6,202 6,472 4.4 23,920 24,897 25,922 248
Hagerstown-Martinsburg, MD-WV 5,840 6,104 6,388 4.7 25,732 26,359 26,848 207
Hanford-Corcoran, CA 2,358 2,545 2,690 5.7 17,873 18,918 19,390 356
Harrisburg-Carlisle, PA 15,662 16,299 16,831 3.3 30,669 31,698 32,541 63
Harrisonburg, VA 2,539 2,530 2,679 5.9 23,282 23,005 24,240 313
Hartford-West Hartford-East Hartford, CT 43,992 44,169 44,992 1.9 37,976 37,782 38,131 18
Hattiesburg, MS 2,758 2,933 3,028 3.3 21,973 23,123 23,598 324
Hickory-Lenoir-Morganton, NC 8,794 8,790 8,843 0.6 25,344 25,192 25,220 282
Hinesville-Fort Stewart, GA 1,232 1,260 1,321 4.8 17,525 17,612 18,723 358
Holland-Grand Haven, MI 6,763 6,859 7,130 4.0 27,769 27,830 28,570 155
Honolulu, HI 26,976 27,936 29,002 3.8 30,675 31,522 32,463 66
Hot Springs, AR 2,208 2,259 2,325 2.9 24,748 25,094 25,497 264
Houma-Bayou Cane-Thibodaux, LA 4,626 4,840 4,986 3.0 23,704 24,655 25,238 281
Houston-Sugar Land-Baytown, TX 171,952 170,887 175,431 2.7 35,489 34,401 34,578 36
Huntington-Ashland, WV-KY-OH 6,430 6,658 6,893 3.5 22,379 23,239 24,021 314
Huntsville, AL 9,797 10,306 10,939 6.1 28,157 29,203 30,591 103
Idaho Falls, ID 2,510 2,633 2,735 3.9 24,318 25,058 25,447 268
Indianapolis, IN 50,515 52,040 53,816 3.4 32,484 32,983 33,618 42
Iowa City, IA 3,935 4,057 4,192 3.3 29,388 30,065 30,796 98
Ithaca, NY 2,420 2,453 2,589 5.5 24,834 24,946 26,042 237
Jackson, MI 3,974 4,061 4,179 2.9 24,850 25,192 25,712 257
Jackson, MS 13,271 13,642 14,355 5.2 26,457 27,008 28,132 165
Jackson, TN 2,679 2,775 2,911 4.9 24,644 25,371 26,599 213
Jacksonville, FL 33,804 34,974 36,548 4.5 29,433 29,793 30,525 106
Jacksonville, NC 3,608 3,829 4,014 4.8 24,355 25,556 26,487 215
Janesville, WI 4,006 4,138 4,378 5.8 26,099 26,858 28,256 161
Jefferson City, MO 3,627 3,733 3,909 4.7 25,734 26,251 27,306 187
Johnson City, TN 4,055 4,203 4,332 3.1 22,270 22,872 23,260 334
Johnstown, PA 3,490 3,545 3,645 2.8 23,070 23,573 24,368 305
Jonesboro, AR 2,335 2,386 2,596 8.8 21,494 21,858 23,569 326
Joplin, MO 3,640 3,735 3,886 4.1 22,951 23,325 23,947 318
Kalamazoo-Portage, MI 8,552 8,819 9,257 5.0 27,070 27,741 28,947 146
Kankakee-Bradley, IL 2,634 2,683 2,709 1.0 25,165 25,480 25,497 264
Kansas City, MO-KS 60,067 62,020 63,540 2.5 32,224 32,863 33,335 50
Kennewick-Richland-Pasco, WA 5,172 5,463 5,738 5.0 26,290 26,859 27,295 188
Killeen-Temple-Fort Hood, TX 7,782 8,089 8,573 6.0 23,334 23,921 24,924 293
Kingsport-Bristol-Bristol, TN-VA 7,112 7,358 7,591 3.2 23,829 24,606 25,299 276
Kingston, NY 4,726 4,713 4,875 3.4 26,448 26,124 26,871 205
Knoxville, TN 17,139 17,883 18,658 4.3 27,425 28,284 29,124 144
Kokomo, IN 2,803 2,906 3,151 8.4 27,606 28,686 31,096 89
La Crosse, WI-MN 3,445 3,510 3,629 3.4 27,020 27,432 28,245 162
Lafayette, IN 4,458 4,551 4,705 3.4 24,862 25,348 25,990 243
Lafayette, LA 6,452 6,605 6,762 2.4 26,866 27,252 27,703 173
Lake Charles, LA 4,642 4,898 5,047 3.0 24,055 25,374 26,026 241
Lakeland, FL 12,212 12,398 12,936 4.3 24,815 24,786 25,323 274
Lancaster, PA 13,528 13,711 14,326 4.5 28,500 28,650 29,654 129
Lansing-East Lansing, MI 12,427 12,552 13,022 3.8 27,601 27,746 28,671 152
Laredo, TX 3,232 3,440 3,629 5.5 16,092 16,640 17,060 359
Las Cruces, NM 3,460 3,590 3,789 5.6 19,588 20,101 20,756 350
Las Vegas-Paradise, NV 43,180 45,325 48,776 7.6 29,651 29,901 30,961 91
Lawrence, KS 2,613 2,712 2,752 1.5 25,948 26,713 26,976 202
Lawton, OK 2,584 2,676 2,818 5.3 23,038 23,940 25,545 262
Lebanon, PA 3,258 3,355 3,484 3.9 26,924 27,581 28,315 159
Lewiston, ID-WA 1,475 1,498 1,542 2.9 25,652 25,945 26,463 217
Lewiston-Auburn, ME 2,688 2,858 2,989 4.6 25,770 27,164 28,166 164
Lexington-Fayette, KY 12,562 12,961 13,517 4.3 30,428 31,195 32,118 72
Lima, OH 2,704 2,819 2,936 4.2 24,992 26,071 27,411 184
Lincoln, NE 7,947 8,218 8,533 3.8 29,447 30,093 30,855 96
Little Rock-North Little Rock, AR 17,349 18,075 18,833 4.2 28,119 29,036 29,927 123
Logan, UT-ID 2,041 2,093 2,196 4.9 19,414 19,440 20,265 354
Longview, TX 4,974 5,022 5,210 3.7 25,511 25,472 26,204 230
Longview, WA 2,341 2,341 2,382 1.8 24,943 24,733 25,039 290
Los Angeles-Long Beach-Santa Ana, CA 403,519 413,328 427,523 3.4 32,147 32,567 33,347 49
Louisville, KY-IN 35,574 37,276 38,664 3.7 30,343 31,579 32,485 65
Lubbock, TX 6,076 6,265 6,441 2.8 24,050 24,651 25,085 288
Lynchburg, VA 5,839 5,907 6,059 2.6 25,462 25,671 26,193 231
Macon, GA 5,882 6,141 6,245 1.7 26,351 27,289 27,554 177
Madera, CA 2,409 2,561 2,725 6.4 19,135 19,880 20,382 353
Madison, WI 17,224 17,930 18,625 3.9 33,727 34,598 35,471 30
Manchester-Nashua, NH 13,873 14,188 14,564 2.6 35,695 36,168 36,858 22
Mansfield, OH 3,095 3,213 3,364 4.7 24,172 25,027 26,232 227
McAllen-Edinburg-Mission, TX 8,504 9,063 9,648 6.5 14,383 14,790 15,184 361
Medford, OR 4,781 4,888 5,067 3.7 25,983 26,146 26,617 211
Memphis, TN-MS-AR 36,241 37,767 39,244 3.9 29,790 30,787 31,677 79
Merced, CA 4,433 4,649 4,944 6.3 20,319 20,670 21,365 347
Miami-Fort Lauderdale-Miami Beach, FL 163,860 169,151 174,652 3.3 32,025 32,493 33,094 55
Michigan City-La Porte, IN 2,670 2,705 2,770 2.4 24,203 24,541 25,241 280
Midland, TX 4,038 3,858 3,991 3.4 34,788 32,853 33,578 43
Milwaukee-Waukesha-West Allis, WI 50,920 51,910 53,182 2.5 33,819 34,384 35,133 35
Minneapolis-St. Paul-Bloomington, MN-WI 113,012 115,401 119,080 3.2 37,370 37,773 38,601 14
Missoula, MT 2,561 2,643 2,758 4.4 26,489 27,015 27,997 169
Mobile, AL 8,811 9,070 9,264 2.1 21,999 22,695 23,164 336
Modesto, CA 10,917 11,419 11,920 4.4 23,462 23,778 24,276 311
Monroe, LA 4,042 4,326 4,389 1.5 23,871 25,452 25,705 259
Monroe, MI 4,240 4,281 4,514 5.4 28,651 28,674 29,914 124
Montgomery, AL 9,252 9,762 10,192 4.4 26,535 27,795 28,881 148
Morgantown, WV 2,704 2,816 2,943 4.5 24,224 25,062 25,927 247
Morristown, TN 2,760 2,863 2,979 4.0 22,104 22,815 23,378 330
Mount Vernon-Anacortes, WA 3,087 3,175 3,293 3.7 29,360 29,755 30,144 115
Muncie, IN 2,934 2,988 3,068 2.7 24,532 25,125 25,905 250
Muskegon-Norton Shores, MI 4,074 4,104 4,240 3.3 23,760 23,826 24,468 301
Myrtle Beach-Conway-North Myrtle Beach, SC 4,871 5,038 5,331 5.8 24,150 24,450 25,266 279
Napa, CA 4,806 4,908 5,054 3.0 37,623 37,759 38,364 15
Naples-Marco Island, FL 11,062 11,505 11,878 3.2 41,836 41,730 41,513 6
Nashville-Davidson-Murfreesboro, TN 42,024 43,734 45,785 4.7 31,433 32,326 33,368 48
New Haven-Milford, CT 29,243 29,757 30,399 2.2 35,250 35,643 36,127 25
New Orleans-Metairie-Kenner, LA 36,923 38,211 39,595 3.6 28,142 29,091 30,092 116
New York-Northern New Jersey-Long Island, NY-NJ-PA 751,761 747,054 763,575 2.2 40,649 40,186 40,899 9
Niles-Benton Harbor, MI 4,320 4,370 4,490 2.8 26,649 26,891 27,572 176
Norwich-New London, CT 8,922 9,160 9,320 1.7 34,211 34,868 35,147 34
Ocala, FL 6,158 6,264 6,611 5.5 23,229 22,986 23,512 327
Ocean City, NJ 3,389 3,453 3,501 1.4 33,200 33,924 34,386 37
Odessa, TX 2,651 2,689 2,789 3.7 21,930 21,962 22,665 339
Ogden-Clearfield, UT 11,256 11,660 12,038 3.2 24,915 25,347 25,681 261
Oklahoma City, OK 31,209 31,573 32,817 3.9 28,186 28,195 28,958 145
Olympia, WA 6,488 6,672 6,926 3.8 30,515 30,733 31,343 84
Omaha-Council Bluffs, NE-IA 25,180 25,678 26,578 3.5 32,455 32,793 33,537 44
Orlando-Kissimmee, FL 46,350 48,096 50,670 5.4 27,151 27,407 28,114 168
Oshkosh-Neenah, WI 4,571 4,703 4,813 2.4 28,957 29,676 30,359 111
Owensboro, KY 2,710 2,788 2,880 3.3 24,623 25,271 25,985 244
Oxnard-Thousand Oaks-Ventura, CA 25,964 26,677 27,860 4.4 33,761 34,163 35,241 32
Palm Bay-Melbourne-Titusville, FL 13,328 13,766 14,500 5.3 27,395 27,766 28,669 153
Panama City-Lynn Haven, FL 3,676 3,823 4,046 5.8 24,522 25,113 26,120 234
Parkersburg-Marietta-Vienna, WV-OH 3,904 4,078 4,118 1.0 23,810 24,917 25,220 282
Pascagoula, MS 3,453 3,546 3,754 5.9 22,646 23,169 24,336 307
Pensacola-Ferry Pass-Brent, FL 10,165 10,448 10,786 3.2 24,299 24,633 25,124 287
Peoria, IL 10,449 10,452 10,704 2.4 28,584 28,533 29,236 138
Philadelphia-Camden-Wilmington, PA-NJ-DE-MD 199,840 206,186 213,917 3.7 34,976 35,909 37,059 21
Phoenix-Mesa-Scottsdale, AZ 97,139 101,447 106,327 4.8 28,712 29,080 29,590 131
Pine Bluff, AR 2,122 2,181 2,308 5.9 19,872 20,488 21,728 345
Pittsburgh, PA 76,354 77,723 79,552 2.4 31,537 32,190 33,015 56
Pittsfield, MA 4,242 4,325 4,364 0.9 31,676 32,445 32,796 62
Pocatello, ID 1,822 1,895 1,937 2.2 21,845 22,771 23,385 329
Portland-South Portland-Biddeford, ME 15,455 15,975 16,719 4.7 31,185 31,850 32,952 58
Portland-Vancouver-Beaverton, OR-WA 63,933 64,395 65,629 1.9 32,345 31,988 32,152 70
Port St. Lucie-Fort Pierce, FL 10,192 10,258 10,637 3.7 31,124 30,424 30,476 108
Poughkeepsie-Newburgh-Middletown, NY 19,306 19,362 20,037 3.5 30,447 30,051 30,560 105
Prescott, AZ 3,702 3,884 4,075 4.9 21,306 21,681 22,075 343
Providence-New Bedford-Fall River, RI-MA 48,705 49,888 51,522 3.3 30,487 30,933 31,743 77
Provo-Orem, UT 7,838 8,045 8,306 3.3 20,048 20,101 20,462 352
Pueblo, CO 3,428 3,604 3,700 2.7 23,730 24,452 24,830 294
Punta Gorda, FL 3,795 3,865 4,046 4.7 25,952 25,781 26,479 216
Racine, WI 5,676 5,843 6,022 3.1 29,922 30,598 31,271 85
Raleigh-Cary, NC 28,448 28,887 29,844 3.3 34,107 33,546 33,627 40
Rapid City, SD 3,089 3,246 3,397 4.7 27,038 28,127 29,281 137
Reading, PA 10,903 11,259 11,519 2.3 28,858 29,484 29,790 127
Redding, CA 4,296 4,418 4,595 4.0 25,681 25,700 26,161 233
Reno-Sparks, NV 13,240 13,519 14,298 5.8 37,287 37,023 38,155 17
Richmond, VA 35,437 36,421 37,432 2.8 31,881 32,384 32,879 60
Riverside-San Bernardino-Ontario, CA 80,406 84,500 89,399 5.8 23,744 24,119 24,526 299
Roanoke, VA 8,226 8,501 8,647 1.7 28,480 29,392 29,795 126
Rochester, MN 5,505 5,805 6,065 4.5 33,010 34,210 35,191 33
Rochester, NY 31,287 31,374 32,329 3.0 30,132 30,184 31,057 90
Rockford, IL 8,624 8,754 8,970 2.5 26,640 26,782 27,075 199
Rocky Mount, NC 3,537 3,545 3,613 1.9 24,644 24,628 24,980 291
Rome, GA 2,244 2,325 2,367 1.8 24,561 25,102 25,337 273
Sacramento-Arden-Arcade-Roseville, CA 57,532 59,439 62,079 4.4 30,807 30,864 31,425 83
Saginaw-Saginaw Township North, MI 5,356 5,320 5,540 4.1 25,543 25,352 26,454 218
St. Cloud, MN 4,381 4,625 4,776 3.3 25,743 26,805 27,404 185
St. George, UT 1,903 1,978 2,099 6.1 20,120 19,856 20,084 355
St. Joseph, MO-KS 2,847 2,942 3,007 2.2 23,038 23,875 24,430 302
St. Louis, MO-IL 85,767 89,751 92,348 2.9 31,532 32,807 33,535 45
Salem, OR 8,737 8,878 9,110 2.6 24,732 24,682 24,978 292
Salinas, CA 12,541 12,609 13,179 4.5 30,718 30,635 31,801 75
Salisbury, MD 2,635 2,721 2,879 5.8 23,817 24,380 25,448 267
Salt Lake City, UT 28,619 29,316 29,935 2.1 29,055 29,456 29,768 128
San Angelo, TX 2,618 2,644 2,726 3.1 24,894 25,118 25,808 252
San Antonio, TX 47,218 47,797 49,733 4.1 27,044 26,832 27,381 186
San Diego-Carlsbad-San Marcos, CA 97,009 101,118 104,614 3.5 33,933 34,915 35,841 28
Sandusky, OH 2,343 2,418 2,528 4.5 29,501 30,637 32,050 73
San Francisco-Oakland-Fremont, CA 199,369 192,993 195,174 1.1 47,722 46,359 46,958 2
San Jose-Sunnyvale-Santa Clara, CA 85,418 79,599 79,801 0.3 48,948 46,003 46,072 3
San Luis Obispo-Paso Robles, CA 7,210 7,395 7,650 3.4 28,741 29,340 30,228 114
Santa Barbara-Santa Maria, CA 13,107 13,017 13,544 4.0 32,702 32,421 33,624 41
Santa Cruz-Watsonville, CA 9,714 9,602 9,597 0.0 38,044 37,899 38,126 19
Santa Fe, NM 4,219 4,280 4,426 3.4 32,141 31,892 32,378 67
Santa Rosa-Petaluma, CA 16,969 16,918 17,041 0.7 36,435 36,312 36,466 24
Sarasota-Bradenton-Venice, FL 22,408 23,014 23,547 2.3 36,992 37,102 37,113 20
Savannah, GA 8,180 8,436 8,800 4.3 27,550 27,994 28,844 150
Scranton-Wilkes-Barre, PA 14,903 15,242 15,581 2.2 26,785 27,521 28,189 163
Seattle-Tacoma-Bellevue, WA 117,001 119,799 122,568 2.3 37,805 38,374 39,008 12
Sheboygan, WI 3,361 3,451 3,549 2.8 29,733 30,460 31,251 86
Sherman-Denison, TX 2,602 2,622 2,694 2.7 23,114 23,064 23,424 328
Shreveport-Bossier City, LA 9,598 9,968 10,415 4.5 25,489 26,433 27,507 181
Sioux City, IA-NE-SD 3,765 3,823 3,931 2.8 26,360 26,758 27,471 182
Sioux Falls, SD 5,978 6,245 6,600 5.7 31,159 32,045 33,217 53
South Bend-Mishawaka, IN-MI 8,685 8,944 9,319 4.2 27,368 28,175 29,360 134
Spartanburg, SC 6,310 6,548 6,747 3.1 24,562 25,247 25,773 254
Spokane, WA 11,082 11,361 11,737 3.3 26,203 26,593 27,218 193
Springfield, IL 6,217 6,321 6,326 0.1 30,643 30,964 30,920 93
Springfield, MA 19,387 19,842 20,229 1.9 28,507 29,000 29,432 133
Springfield, MO 9,324 9,677 10,075 4.1 24,937 25,551 26,209 228
Springfield, OH 3,745 3,778 3,891 3.0 25,989 26,271 27,246 190
State College, PA 3,379 3,514 3,604 2.6 24,805 25,353 25,776 253
Stockton, CA 14,281 14,747 15,416 4.5 24,080 24,074 24,397 304
Sumter, SC 2,175 2,266 2,368 4.5 20,818 21,537 22,390 340
Syracuse, NY 17,723 18,033 18,572 3.0 27,240 27,688 28,429 158
Tallahassee, FL 8,255 8,370 8,624 3.0 25,599 25,812 26,333 224
Tampa-St. Petersburg-Clearwater, FL 71,713 73,620 75,634 2.7 29,342 29,596 29,881 125
Terre Haute, IN 3,805 3,897 4,060 4.2 22,393 22,979 23,946 319
Texarkana, TX-Texarkana, AR 3,006 3,095 3,193 3.2 23,086 23,640 24,246 312
Toledo, OH 18,388 18,904 19,759 4.5 27,870 28,673 29,963 120
Topeka, KS 6,254 6,399 6,421 0.3 27,755 28,347 28,306 160
Trenton-Ewing, NJ 14,341 14,554 14,989 3.0 40,428 40,698 41,499 7
Tucson, AZ 21,387 22,071 23,082 4.6 24,828 25,151 25,906 249
Tulsa, OK 27,243 26,800 27,196 1.5 31,372 30,587 30,908 94
Tuscaloosa, AL 4,700 4,931 5,162 4.7 24,263 25,451 26,554 214
Tyler, TX 4,949 5,046 5,229 3.6 27,872 27,914 28,441 157
Utica-Rome, NY 7,172 7,141 7,332 2.7 24,029 23,976 24,595 297
Valdosta, GA 2,612 2,740 2,855 4.2 21,851 22,642 23,375 331
Vallejo-Fairfield, CA 11,623 11,992 12,456 3.9 28,730 29,283 30,259 112
Vero Beach, FL 4,552 4,592 4,804 4.6 39,462 38,925 39,953 10
Victoria, TX 2,868 2,884 2,920 1.2 25,494 25,609 25,838 251
Vineland-Millville-Bridgeton, NJ 3,606 3,777 3,889 3.0 24,543 25,514 26,012 242
Virginia Beach-Norfolk-Newport News, VA-NC 44,071 45,999 47,675 3.6 27,774 28,659 29,337 135
Visalia-Porterville, CA 7,723 8,010 8,365 4.4 20,647 21,009 21,388 346
Waco, TX 4,983 5,123 5,271 2.9 23,120 23,584 24,007 316
Warner Robins, GA 2,861 3,055 3,167 3.7 25,277 26,235 26,379 221
Washington-Arlington-Alexandria, DC-VA-MD-WV 208,807 214,919 223,394 3.9 42,451 42,987 44,056 4
Waterloo-Cedar Falls, IA 4,199 4,396 4,470 1.7 25,724 27,119 27,644 175
Wausau, WI 3,564 3,695 3,817 3.3 28,177 29,115 29,992 119
Weirton-Steubenville, WV-OH 3,001 3,086 3,160 2.4 23,002 23,863 24,577 298
Wenatchee, WA 2,495 2,556 2,640 3.3 25,013 25,441 25,947 245
Wheeling, WV-OH 3,685 3,772 3,868 2.5 24,330 24,979 25,771 255
Wichita, KS 17,197 17,321 17,500 1.0 29,910 29,874 30,060 118
Wichita Falls, TX 3,839 3,915 4,050 3.4 25,708 26,279 27,243 191
Williamsport, PA 2,902 2,996 3,089 3.1 24,335 25,211 26,039 238
Wilmington, NC 7,464 7,598 7,894 3.9 26,523 26,423 26,871 205
Winchester, VA-WV 2,803 2,881 2,990 3.8 26,445 26,606 27,084 198
Winston-Salem, NC 12,546 12,866 13,222 2.8 29,266 29,688 30,243 113
Worcester, MA 25,410 25,401 25,972 2.2 33,345 33,008 33,479 46
Yakima, WA 5,152 5,258 5,426 3.2 23,062 23,416 23,916 320
York-Hanover, PA 10,877 11,128 11,544 3.7 28,195 28,546 29,181 140
Youngstown-Warren-Boardman, OH-PA 14,762 15,114 15,635 3.4 24,621 25,371 26,361 222
Yuba City, CA 3,258 3,385 3,561 5.2 23,020 23,409 24,018 315
Yuma, AZ 2,976 3,324 3,268 -1.7 18,207 19,940 19,158 357
1. Per capita personal income was computed using Census Bureau midyear population estimates.
2. Percent change calculated from unrounded data.
3. The personal income level shown for the United States is derived as the sum of the county estimates. It differs from the estimate
income in the national income and product accounts because of differences in coverage, in the methodologies
used to prepare the estimates, and in the timing of the availability of source data.
4. The metropolitan area definitions used by BEA for its personal income estimates are the new county-based definitions issued by the
and Budget in June 2003 (with revisions released February 2004 and February 2005) for federal statistical purposes.
Last updated:
|


