|
Available for this release:  Full Release: PDF (360 kb), Full Release: PDF (360 kb),  Tables: XLS (87 kb), Highlights: PDF (115 kb) Tables: XLS (87 kb), Highlights: PDF (115 kb)
 Sign up for State Personal Income News Releases. Sign up for State Personal Income News Releases. |
EMBARGOED FOR RELEASE: 8:30 A.M. ET, Tuesday, December 20, 2005
| David G. Lenze |
(202) |
606–9292 |
| Matthew von Kerczek |
(202) |
606–9250 |
BEA 05—56 |
| E–mail inquiries: |
RegRelease@bea.gov |
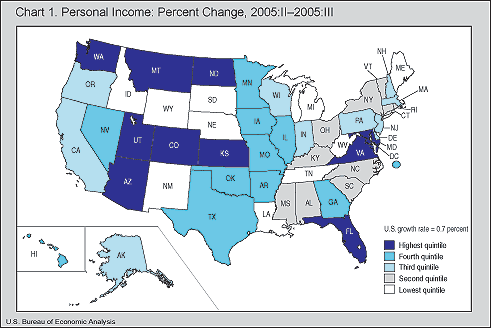
State Personal Income: Third Quarter 2005
Personal income fell 25 percent in disaster–stricken Louisiana, the state hardest hit by Hurricanes Katrina and Rita in the third quarter; Mississippi and Alabama, which did not suffer as extensive destruction, grew 0.8 percent; and the rest of the country grew 1.1 percent.
BEA's estimates provide the most comprehensive before–and–after look at state incomes since the hurricanes. However, BEA cannot fully separate the effects of the disasters from other underlying sources of growth and decline. For example, wages declined 2.8% in Louisiana in the third quarter, reflecting non–hurricane–related factors and the net effect of wages lost because of the disasters and wages earned from response, clean–up, restoration, and other activities after the disaster.
In Louisiana, personal income fell $32.7 billion in the third quarter following a $2.1 billion increase in the second. Personal income was reduced $70.2 billion to reflect uninsured losses of residential and business fixed assets owned by households and was raised $31.9 billion to reflect the impact of net insurance settlements associated with the hurricanes. To account for losses and insurance settlements that are not picked up by its source data, BEA adjusted proprietors' income, net rental income and transfer receipts. Third quarter state personal income fully accounts for the uninsured losses and the net insurance settlements associated with Hurricanes Katrina and Rita but accounts for only that disaster assistance received and for those wages lost (or gained) in August and September.
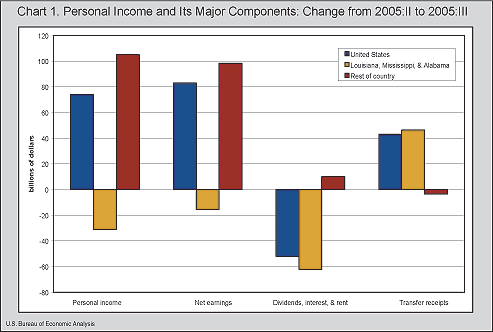 Aside from the hurricanes, the recent gains in personal income reflect three underlying and somewhat offsetting trends in labor markets, housing markets, and transfer receipts. Strengthening labor markets boosted net earnings growth to 1.2 percent in the third quarter, up from 1.0 percent growth in the second. Excluding the three Gulf states net earnings grew 1.4 percent. The robust housing market tends to lower personal income in the short run: personal income is measured net of the costs associated with financing and refinancing mortgages and household mortgage borrowing is at an historical high. Declines in Medicaid spending also tended to weaken total personal income growth.
Earnings
Real estate, health care, and construction were the major contributors to growth in most regions of the country in the third quarter, as they were in the second quarter. Growth in construction earnings was particularly strong in the Far West, Rocky Mountain, and Southwest regions.
Earnings grew in every nonfarm industry except the military where the deactivation of some reservists led to a small 0.4 percent decline spread broadly across most states. However, Army National Guard activations at Fort Richardson, Alaska contributed to a 2.9 percent growth in military earnings in Alaska and made the military the largest contributor to growth in that state. Also, military earnings increased 3.4 percent in Missouri reflecting an influx of troops reporting for combat and other training at Fort Leonard Wood.
Transfer receipts
Transfer receipts declined a small amount–generally less than half a percentage point–in all states except the three Gulf states and Texas and Georgia where evacuees from the hurricanes and floods received FEMA disaster assistance and disaster–related unemployment compensation. The decline in transfers in the other states was largely due to a downturn in state and local government Medicaid spending. Such spending is treated as a transfer receipt in personal income.
Note on disaster adjustments
The third quarter estimates of state personal income reflect the effects of Hurricanes Katrina and Rita and the New Orleans Flood. BEA does not attempt to quantify a disaster's total impact on personal income because the effects are usually not separately identifiable. Some of the direct and indirect effects of the storms are picked up by the source data used to estimate various components of personal income. For example wages and salaries–which declined $1.2 billion in Louisiana, Mississippi, and Alabama–and state unemployment insurance compensation–which rose $0.2 billion in the three states, reflect both the loss of jobs and hours worked by some persons and employment and hours gained by other persons in the recovery from the disaster. Other effects are not picked up by the source data. For this reason BEA adjusted proprietors' income, net rental income, and transfer receipts to account for uninsured losses of fixed assets and net insurance settlements. The national estimates of uninsured losses and net insurance settlements were distributed to states on the basis of reports from multiple sources including the Insurance Services Organization (ISO) and the Federal Emergency Management Agency.
More information on the adjustments will be presented in the January 2006 issue of the Survey of Current Business. A set of FAQs about Hurricane Katrina are available on BEA's Web site at www.bea.gov.
NOTE.–Quarterly estimates are expressed at seasonally adjusted annual rates, unless otherwise specified. Quarter–to–quarter dollar changes are differences between published estimates. Quarter–to–quarter percent changes are calculated from unrounded data and are not annualized.
Definitions
Personal income is the income received by all persons from all sources. Personal income is the sum of net earnings by place of residence, rental income of persons, personal dividend income, personal interest income, and personal current transfer receipts. Net earnings is earnings by place of work (the sum of wage and salary disbursements (payrolls), supplements to wages and salaries, and proprietors' income) less contributions for government social insurance, plus an adjustment to convert earnings by place of work to a place–of–residence basis. Personal income is measured before the deduction of personal income taxes and other personal taxes and is reported in current dollars (no adjustment is made for price changes).
The estimate of personal income in the United States is derived as the sum of the state estimates; it differs from the estimate of personal income in the national income and product accounts (NIPAs) because of differences in coverage, in the methodologies used to prepare the estimates, and in the timing of the availability of source data.
BEA groups all 50 states and the District of Columbia into eight distinct regions for purposes of data collecting and analyses: New England (Connecticut, Maine, Massachusetts, New Hampshire, Rhode Island, and Vermont); Mideast (Delaware, District of Columbia, Maryland, New Jersey, New York, and Pennsylvania); Great Lakes (Illinois, Indiana, Michigan, Ohio, and Wisconsin); Plains (Iowa, Kansas, Minnesota, Missouri, Nebraska, North Dakota, and South Dakota); Southeast (Alabama, Arkansas, Florida, Georgia, Kentucky, Louisiana, Mississippi, North Carolina, South Carolina, Tennessee, Virginia, and West Virginia); Southwest (Arizona, New Mexico, Oklahoma, and Texas); Rocky Mountain (Colorado, Idaho, Montana, Utah, and Wyoming); and Far West (Alaska, California, Hawaii, Nevada, Oregon, and Washington).
BEA's national, international, regional, and industry estimates; the Survey of Current Business; and BEA news releases are available without charge on BEA's Web site at www.bea.gov. By visiting the site, you can also subscribe to receive free e–mail summaries of BEA releases and announcements.
****
Next state personal income release – March 28, 2006, at 8:30 A.M. ET for state personal income, fourth quarter 2005, annual 2005, and revisions from first quarter 2002.
|
|
|
Table 1. Personal Income, by State and Region, 2004:II–2005:III
| |
[Millions of dollars, seasonally adjusted at annual rate] |
[Seasonally adjusted at quarterly rate] |
Rank |
| 2004 |
2005 |
Percent change from preceding quarter |
| II |
III |
IV |
I/r |
II/r |
III/p |
2004:III |
2004:IV |
2005:I |
2005:II |
2005:III |
2005:II – 2005:III |
| r Revised. |
p Preliminary. |
Note: Estimates may not add to totals because of rounding. |
Source: U.S. Bureau of Economic Analysis |
| United States |
9,604,015 |
9,719,654 |
10,015,057 |
10,075,908 |
10,186,624 |
10,260,723 |
1.2 |
3.0 |
0.6 |
1.1 |
0.7 |
— |
| New England |
| Connecticut |
157,012 |
160,047 |
164,587 |
165,815 |
166,524 |
168,095 |
1.9 |
2.8 |
0.7 |
0.4 |
0.9 |
32 |
|
| Maine |
39,141 |
39,620 |
40,612 |
40,788 |
41,217 |
41,520 |
1.2 |
2.5 |
0.4 |
1.0 |
0.7 |
41 |
|
| Massachusetts |
268,336 |
271,187 |
277,174 |
277,814 |
279,943 |
282,710 |
1.1 |
2.2 |
0.2 |
0.8 |
1.0 |
24 |
|
| New Hampshire |
47,115 |
47,994 |
49,193 |
49,391 |
50,070 |
50,551 |
1.9 |
2.5 |
0.4 |
1.4 |
1.0 |
28 |
|
| Rhode Island |
36,612 |
37,174 |
37,890 |
38,170 |
38,709 |
39,054 |
1.5 |
1.9 |
0.7 |
1.4 |
0.9 |
34 |
|
| Vermont |
19,582 |
19,879 |
20,275 |
20,407 |
20,538 |
20,717 |
1.5 |
2.0 |
0.7 |
0.6 |
0.9 |
36 |
|
| Mideast |
| Delaware |
29,284 |
29,444 |
30,552 |
30,697 |
30,902 |
31,209 |
0.5 |
3.8 |
0.5 |
0.7 |
1.0 |
23 |
|
| District of Columbia |
28,509 |
28,924 |
29,776 |
30,098 |
30,468 |
30,826 |
1.5 |
2.9 |
1.1 |
1.2 |
1.2 |
— |
|
| Maryland |
218,366 |
220,289 |
227,496 |
229,309 |
231,967 |
234,820 |
0.9 |
3.3 |
0.8 |
1.2 |
1.2 |
10 |
|
| New Jersey |
357,655 |
363,421 |
374,006 |
375,628 |
378,820 |
382,725 |
1.6 |
2.9 |
0.4 |
0.8 |
1.0 |
21 |
|
| New York |
724,831 |
739,790 |
762,504 |
765,592 |
768,591 |
775,428 |
2.1 |
3.1 |
0.4 |
0.4 |
0.9 |
35 |
|
| Pennsylvania |
408,039 |
414,039 |
425,721 |
426,840 |
431,242 |
435,397 |
1.5 |
2.8 |
0.3 |
1.0 |
1.0 |
27 |
|
| Great Lakes |
| Illinois |
437,961 |
439,964 |
451,184 |
453,533 |
456,183 |
461,684 |
0.5 |
2.6 |
0.5 |
0.6 |
1.2 |
12 |
|
| Indiana |
186,626 |
187,868 |
191,753 |
192,526 |
194,748 |
196,611 |
0.7 |
2.1 |
0.4 |
1.2 |
1.0 |
30 |
|
| Michigan |
322,266 |
324,560 |
329,533 |
329,871 |
334,368 |
336,370 |
0.7 |
1.5 |
0.1 |
1.4 |
0.6 |
47 |
|
| Ohio |
353,609 |
357,575 |
367,101 |
367,180 |
370,165 |
373,684 |
1.1 |
2.7 |
0.0 |
0.8 |
1.0 |
31 |
|
| Wisconsin |
174,568 |
177,982 |
181,808 |
182,401 |
183,641 |
185,484 |
2.0 |
2.1 |
0.3 |
0.7 |
1.0 |
22 |
|
| Plains |
| Iowa |
91,125 |
91,229 |
93,718 |
95,038 |
94,704 |
95,737 |
0.1 |
2.7 |
1.4 |
–0.4 |
1.1 |
17 |
|
| Kansas |
83,931 |
85,301 |
87,227 |
88,400 |
88,635 |
89,836 |
1.6 |
2.3 |
1.3 |
0.3 |
1.4 |
8 |
|
| Minnesota |
182,211 |
185,098 |
190,467 |
189,637 |
189,251 |
191,527 |
1.6 |
2.9 |
–0.4 |
–0.2 |
1.2 |
13 |
|
| Missouri |
174,073 |
175,865 |
180,455 |
181,754 |
183,832 |
185,822 |
1.0 |
2.6 |
0.7 |
1.1 |
1.1 |
18 |
|
| Nebraska |
56,128 |
56,411 |
57,653 |
58,263 |
58,133 |
58,560 |
0.5 |
2.2 |
1.1 |
–0.2 |
0.7 |
42 |
|
| North Dakota |
18,443 |
18,524 |
19,133 |
19,760 |
19,436 |
19,895 |
0.4 |
3.3 |
3.3 |
–1.6 |
2.4 |
1 |
|
| South Dakota |
23,733 |
23,505 |
23,850 |
24,034 |
23,944 |
24,107 |
–1.0 |
1.5 |
0.8 |
–0.4 |
0.7 |
45 |
|
| Southeast |
| Alabama |
124,438 |
125,240 |
128,801 |
130,790 |
132,871 |
133,986 |
0.6 |
2.8 |
1.5 |
1.6 |
0.8 |
37 |
|
| Arkansas |
70,608 |
70,935 |
72,231 |
73,426 |
74,551 |
75,462 |
0.5 |
1.8 |
1.7 |
1.5 |
1.2 |
11 |
|
| Florida |
542,393 |
545,889 |
569,850 |
577,110 |
585,669 |
594,712 |
0.6 |
4.4 |
1.3 |
1.5 |
1.5 |
4 |
|
| Georgia |
262,955 |
266,042 |
273,906 |
276,284 |
280,789 |
283,706 |
1.2 |
3.0 |
0.9 |
1.6 |
1.0 |
20 |
|
| Kentucky |
111,629 |
112,640 |
115,414 |
116,546 |
118,301 |
119,269 |
0.9 |
2.5 |
1.0 |
1.5 |
0.8 |
38 |
|
| Louisiana |
121,836 |
122,930 |
126,003 |
127,591 |
129,649 |
96,983 |
0.9 |
2.5 |
1.3 |
1.6 |
–25.2 |
50 |
|
| Mississippi |
70,364 |
71,032 |
72,396 |
73,352 |
74,849 |
75,416 |
1.0 |
1.9 |
1.3 |
2.0 |
0.8 |
40 |
|
| North Carolina |
247,387 |
251,537 |
258,284 |
261,919 |
263,756 |
266,230 |
1.7 |
2.7 |
1.4 |
0.7 |
0.9 |
33 |
|
| South Carolina |
113,059 |
114,464 |
117,375 |
118,681 |
120,297 |
121,254 |
1.2 |
2.5 |
1.1 |
1.4 |
0.8 |
39 |
|
| Tennessee |
174,251 |
176,919 |
180,948 |
182,159 |
185,136 |
186,293 |
1.5 |
2.3 |
0.7 |
1.6 |
0.6 |
46 |
|
| Virginia |
266,144 |
271,190 |
280,396 |
283,702 |
287,529 |
291,140 |
1.9 |
3.4 |
1.2 |
1.3 |
1.3 |
9 |
|
| West Virginia |
46,371 |
46,745 |
47,874 |
48,471 |
49,114 |
49,451 |
0.8 |
2.4 |
1.2 |
1.3 |
0.7 |
44 |
|
| Southwest |
| Arizona |
162,288 |
165,429 |
170,663 |
172,942 |
176,517 |
179,601 |
1.9 |
3.2 |
1.3 |
2.1 |
1.7 |
2 |
|
| New Mexico |
49,491 |
49,805 |
51,172 |
52,329 |
52,905 |
53,289 |
0.6 |
2.7 |
2.3 |
1.1 |
0.7 |
43 |
|
| Oklahoma |
97,283 |
98,282 |
100,729 |
102,072 |
103,278 |
104,378 |
1.0 |
2.5 |
1.3 |
1.2 |
1.1 |
19 |
|
| Texas |
684,385 |
691,720 |
712,101 |
725,023 |
735,994 |
744,665 |
1.1 |
2.9 |
1.8 |
1.5 |
1.2 |
14 |
|
| Rocky Mountain |
| Colorado |
164,730 |
166,195 |
171,680 |
173,736 |
174,988 |
177,371 |
0.9 |
3.3 |
1.2 |
0.7 |
1.4 |
7 |
|
| Idaho |
37,271 |
37,473 |
38,473 |
39,511 |
39,960 |
40,191 |
0.5 |
2.7 |
2.7 |
1.1 |
0.6 |
48 |
|
| Montana |
25,380 |
25,747 |
26,495 |
26,756 |
27,145 |
27,551 |
1.4 |
2.9 |
1.0 |
1.5 |
1.5 |
5 |
|
| Utah |
63,839 |
64,719 |
66,486 |
67,380 |
68,403 |
69,415 |
1.4 |
2.7 |
1.3 |
1.5 |
1.5 |
6 |
|
| Wyoming |
17,184 |
17,398 |
17,820 |
18,056 |
18,861 |
18,473 |
1.2 |
2.4 |
1.3 |
4.5 |
–2.1 |
49 |
|
| Far West |
| Alaska |
22,111 |
22,437 |
22,995 |
23,206 |
23,489 |
23,714 |
1.5 |
2.5 |
0.9 |
1.2 |
1.0 |
29 |
|
| California |
1,250,427 |
1,264,874 |
1,302,381 |
1,310,250 |
1,327,404 |
1,340,319 |
1.2 |
3.0 |
0.6 |
1.3 |
1.0 |
26 |
|
| Hawaii |
40,585 |
41,521 |
42,743 |
43,174 |
43,725 |
44,210 |
2.3 |
2.9 |
1.0 |
1.3 |
1.1 |
16 |
|
| Nevada |
77,758 |
79,441 |
82,486 |
84,334 |
86,872 |
87,888 |
2.2 |
3.8 |
2.2 |
3.0 |
1.2 |
15 |
|
| Oregon |
109,247 |
110,276 |
112,875 |
114,184 |
115,628 |
116,767 |
0.9 |
2.4 |
1.2 |
1.3 |
1.0 |
25 |
|
| Washington |
211,444 |
213,086 |
238,815 |
219,979 |
222,911 |
226,618 |
0.8 |
12.1 |
–7.9 |
1.3 |
1.7 |
3 |
|
| BEA regions |
| New England |
567,799 |
575,901 |
589,731 |
592,387 |
597,001 |
602,647 |
1.4 |
2.4 |
0.5 |
0.8 |
0.9 |
— |
|
| Mideast |
1,766,685 |
1,795,908 |
1,850,055 |
1,858,164 |
1,871,989 |
1,890,405 |
1.7 |
3.0 |
0.4 |
0.7 |
1.0 |
— |
|
| Great Lakes |
1,475,030 |
1,487,949 |
1,521,379 |
1,525,510 |
1,539,106 |
1,553,833 |
0.9 |
2.2 |
0.3 |
0.9 |
1.0 |
— |
|
| Plains |
629,644 |
635,932 |
652,503 |
656,886 |
657,934 |
665,485 |
1.0 |
2.6 |
0.7 |
0.2 |
1.1 |
— |
|
| Southeast |
2,151,435 |
2,175,563 |
2,243,479 |
2,270,030 |
2,302,512 |
2,293,903 |
1.1 |
3.1 |
1.2 |
1.4 |
–0.4 |
— |
|
| Southwest |
993,446 |
1,005,237 |
1,034,664 |
1,052,365 |
1,068,694 |
1,081,932 |
1.2 |
2.9 |
1.7 |
1.6 |
1.2 |
— |
|
| Rocky Mountain |
308,405 |
311,532 |
320,953 |
325,439 |
329,358 |
333,002 |
1.0 |
3.0 |
1.4 |
1.2 |
1.1 |
— |
|
| Far West |
1,711,572 |
1,731,634 |
1,802,295 |
1,795,127 |
1,820,029 |
1,839,516 |
1.2 |
4.1 |
–0.4 |
1.4 |
1.1 |
— |
|
Table 2. Personal Income by Component, by State and Region, 2005:II-2005:III
| |
[Seasonally adjusted at quarterly rate] |
[Seasonally adjusted at annual rate] |
| Percent change from preceding quarter |
Contribution to percent change in personal income
(percentage points) |
Dollar change (millions) |
| Personal income |
Net earnings/1 |
Dividends, interest, and rent |
Transfer receipts |
Net earnings/1 |
Dividends, interest, and rent |
Transfer receipts |
Personal income |
Net earnings/1 |
Dividends, interest, and rent |
Transfer receipts |
| 1. Net earnings is earnings by place of work—the sum of wage and salary disbursements, supplements to wages and salaries, and proprietors' income—less contributions for government social insurance plus an adjustment to convert earnings by place of work to a place-of-residence basis. |
| 2. Not meaningful. |
Note: Estimates may not add to totals because of rounding. |
Source: U.S. Bureau of Economic Analysis |
| United States |
0.7 |
1.2 |
-3.4 |
2.9 |
0.81 |
-0.51 |
0.42 |
74,099 |
82,969 |
-51,945 |
43,075 |
| New England |
| Connecticut |
0.9 |
1.2 |
0.9 |
-0.4 |
0.85 |
0.14 |
-0.05 |
1,571 |
1,418 |
231 |
-77 |
| Maine |
0.7 |
1.1 |
0.6 |
-0.4 |
0.71 |
0.10 |
-0.07 |
303 |
293 |
39 |
-29 |
| Massachusetts |
1.0 |
1.3 |
1.0 |
-0.4 |
0.88 |
0.16 |
-0.06 |
2,766 |
2,471 |
452 |
-157 |
| New Hampshire |
1.0 |
1.3 |
0.4 |
-0.6 |
0.99 |
0.05 |
-0.08 |
481 |
494 |
25 |
-38 |
| Rhode Island |
0.9 |
1.1 |
1.7 |
-0.5 |
0.69 |
0.29 |
-0.09 |
345 |
268 |
111 |
-34 |
| Vermont |
0.9 |
1.3 |
0.3 |
-0.5 |
0.90 |
0.05 |
-0.08 |
179 |
185 |
10 |
-16 |
| Mideast |
| Delaware |
1.0 |
1.3 |
1.1 |
-0.5 |
0.90 |
0.17 |
-0.07 |
307 |
277 |
52 |
-23 |
| District of Columbia |
1.2 |
1.4 |
1.0 |
-0.2 |
1.07 |
0.14 |
-0.03 |
358 |
325 |
41 |
-9 |
| Maryland |
1.2 |
1.5 |
1.0 |
-0.4 |
1.13 |
0.14 |
-0.04 |
2,853 |
2,618 |
335 |
-100 |
| New Jersey |
1.0 |
1.3 |
1.0 |
-0.3 |
0.92 |
0.15 |
-0.04 |
3,905 |
3,466 |
579 |
-140 |
| New York |
0.9 |
1.2 |
0.9 |
-0.4 |
0.84 |
0.13 |
-0.08 |
6,837 |
6,474 |
986 |
-623 |
| Pennsylvania |
1.0 |
1.4 |
0.6 |
-0.3 |
0.93 |
0.09 |
-0.06 |
4,155 |
4,009 |
409 |
-262 |
| Great Lakes |
| Illinois |
1.2 |
1.6 |
0.8 |
-0.4 |
1.12 |
0.13 |
-0.05 |
5,500 |
5,111 |
614 |
-225 |
| Indiana |
1.0 |
1.3 |
0.7 |
-0.4 |
0.92 |
0.10 |
-0.06 |
1,863 |
1,795 |
195 |
-127 |
| Michigan |
0.6 |
0.7 |
0.6 |
-0.1 |
0.52 |
0.09 |
-0.02 |
2,001 |
1,751 |
304 |
-54 |
| Ohio |
1.0 |
1.4 |
0.6 |
-0.4 |
0.94 |
0.08 |
-0.07 |
3,519 |
3,463 |
311 |
-256 |
| Wisconsin |
1.0 |
1.3 |
0.9 |
-0.3 |
0.91 |
0.14 |
-0.05 |
1,844 |
1,673 |
257 |
-86 |
| Plains |
| Iowa |
1.1 |
1.5 |
0.8 |
-0.2 |
1.00 |
0.13 |
-0.04 |
1,033 |
944 |
123 |
-34 |
| Kansas |
1.4 |
1.7 |
1.1 |
-0.3 |
1.21 |
0.18 |
-0.04 |
1,202 |
1,076 |
160 |
-35 |
| Minnesota |
1.2 |
1.7 |
0.7 |
-0.6 |
1.16 |
0.12 |
-0.08 |
2,276 |
2,187 |
235 |
-146 |
| Missouri |
1.1 |
1.4 |
1.3 |
-0.3 |
0.92 |
0.21 |
-0.05 |
1,990 |
1,688 |
395 |
-92 |
| Nebraska |
0.7 |
0.9 |
1.0 |
-0.4 |
0.61 |
0.18 |
-0.06 |
428 |
357 |
105 |
-34 |
| North Dakota |
2.4 |
3.4 |
1.0 |
-0.6 |
2.28 |
0.18 |
-0.10 |
459 |
443 |
35 |
-19 |
| South Dakota |
0.7 |
0.9 |
0.8 |
-0.5 |
0.60 |
0.16 |
-0.08 |
163 |
144 |
38 |
-19 |
| Southeast |
| Alabama |
0.8 |
0.9 |
-5.5 |
5.7 |
0.58 |
-0.78 |
1.04 |
1,115 |
765 |
-1,032 |
1,382 |
| Arkansas |
1.2 |
1.7 |
0.7 |
-0.1 |
1.15 |
0.10 |
-0.03 |
911 |
858 |
74 |
-20 |
| Florida |
1.5 |
2.2 |
0.7 |
-0.1 |
1.40 |
0.15 |
-0.01 |
9,043 |
8,218 |
892 |
-67 |
| Georgia |
1.0 |
1.3 |
0.7 |
0.1 |
0.94 |
0.09 |
0.01 |
2,917 |
2,646 |
249 |
23 |
| Kentucky |
0.8 |
1.2 |
0.9 |
-0.5 |
0.79 |
0.12 |
-0.10 |
968 |
938 |
145 |
-116 |
| Louisiana |
-25.2 |
-16.2 |
2/ |
139.9 |
-10.92 |
-41.82 |
27.54 |
-32,665 |
-14,159 |
-54,213 |
35,707 |
| Mississippi |
0.8 |
-4.2 |
-71.5 |
56.9 |
-2.76 |
-9.03 |
12.55 |
567 |
-2,068 |
-6,761 |
9,396 |
| North Carolina |
0.9 |
1.4 |
0.4 |
-0.6 |
0.97 |
0.06 |
-0.09 |
2,474 |
2,559 |
162 |
-247 |
| South Carolina |
0.8 |
1.2 |
0.4 |
-0.3 |
0.80 |
0.06 |
-0.06 |
956 |
963 |
70 |
-76 |
| Tennessee |
0.6 |
0.9 |
0.4 |
-0.3 |
0.63 |
0.05 |
-0.05 |
1,157 |
1,160 |
86 |
-89 |
| Virginia |
1.3 |
1.4 |
1.5 |
-0.4 |
1.07 |
0.23 |
-0.04 |
3,611 |
3,065 |
670 |
-124 |
| West Virginia |
0.7 |
1.2 |
0.5 |
-0.3 |
0.71 |
0.06 |
-0.08 |
337 |
349 |
29 |
-41 |
| Southwest |
| Arizona |
1.7 |
2.5 |
0.5 |
-0.4 |
1.73 |
0.08 |
-0.06 |
3,084 |
3,052 |
145 |
-113 |
| New Mexico |
0.7 |
1.1 |
0.5 |
-0.4 |
0.74 |
0.06 |
-0.08 |
384 |
394 |
33 |
-43 |
| Oklahoma |
1.1 |
1.4 |
1.1 |
-0.4 |
0.96 |
0.17 |
-0.06 |
1,100 |
993 |
171 |
-64 |
| Texas |
1.2 |
1.3 |
0.3 |
1.6 |
0.94 |
0.03 |
0.21 |
8,671 |
6,919 |
231 |
1,520 |
| Rocky Mountain |
| Colorado |
1.4 |
1.7 |
0.8 |
-0.4 |
1.28 |
0.13 |
-0.04 |
2,383 |
2,234 |
224 |
-74 |
| Idaho |
0.6 |
0.9 |
0.0 |
-0.6 |
0.66 |
0.01 |
-0.09 |
231 |
263 |
2 |
-34 |
| Montana |
1.5 |
2.2 |
0.8 |
-0.4 |
1.40 |
0.16 |
-0.06 |
406 |
381 |
43 |
-18 |
| Utah |
1.5 |
1.9 |
0.8 |
-0.5 |
1.42 |
0.11 |
-0.05 |
1,012 |
972 |
76 |
-37 |
| Wyoming |
-2.1 |
-3.3 |
0.8 |
-0.5 |
-2.17 |
0.18 |
-0.07 |
-388 |
-409 |
34 |
-13 |
| Far West |
| Alaska |
1.0 |
1.4 |
-0.1 |
-0.5 |
1.05 |
-0.01 |
-0.07 |
225 |
246 |
-3 |
-17 |
| California |
1.0 |
1.4 |
0.3 |
-0.5 |
1.00 |
0.04 |
-0.07 |
12,915 |
13,320 |
503 |
-908 |
| Hawaii |
1.1 |
1.5 |
0.7 |
-0.4 |
1.06 |
0.10 |
-0.05 |
485 |
463 |
44 |
-21 |
| Nevada |
1.2 |
1.4 |
1.1 |
-0.2 |
1.00 |
0.20 |
-0.03 |
1,015 |
865 |
172 |
-22 |
| Oregon |
1.0 |
1.6 |
-0.1 |
-0.5 |
1.07 |
-0.01 |
-0.07 |
1,138 |
1,234 |
-13 |
-82 |
| Washington |
1.7 |
2.4 |
-0.1 |
-0.3 |
1.71 |
-0.01 |
-0.04 |
3,707 |
3,819 |
-22 |
-90 |
| BEA regions |
| New England |
0.9 |
1.2 |
0.9 |
-0.4 |
0.86 |
0.15 |
-0.06 |
5,645 |
5,129 |
867 |
-351 |
| Mideast. |
1.0 |
1.3 |
0.9 |
-0.4 |
0.92 |
0.13 |
-0.06 |
18,416 |
17,170 |
2,403 |
-1,157 |
| Great Lakes |
1.0 |
1.3 |
0.7 |
-0.3 |
0.90 |
0.11 |
-0.05 |
14,728 |
13,794 |
1,681 |
-748 |
| Plains |
1.1 |
1.5 |
1.0 |
-0.4 |
1.04 |
0.17 |
-0.06 |
7,551 |
6,839 |
1,091 |
-380 |
| Southeast |
-0.4 |
0.3 |
-16.6 |
12.0 |
0.23 |
-2.59 |
1.99 |
-8,608 |
5,294 |
-59,628 |
45,726 |
| Southwest |
1.2 |
1.5 |
0.4 |
0.9 |
1.06 |
0.05 |
0.12 |
13,238 |
11,358 |
580 |
1,300 |
| Rocky Mountain |
1.1 |
1.4 |
0.7 |
-0.5 |
1.04 |
0.12 |
-0.05 |
3,644 |
3,441 |
380 |
-176 |
| Far West |
1.1 |
1.5 |
0.2 |
-0.5 |
1.10 |
0.04 |
-0.06 |
19,486 |
19,946 |
681 |
-1,140 |
Table 3. Contributions to Percent Change in Earnings by Place of Work, by State and Region, 2005:II - 2005:III
| [Percentage points, seasonally adjusted] |
| |
Total Earnings/1 |
Farm |
Forestry, fishing, related activities, and other/2 |
Mining |
Utilities |
Construction |
Manufacturing |
Wholesale trade |
Retail trade |
Transportation and warehousing |
Information |
Finance and insurance |
| Durable goods |
Nondurable goods |
| 1. Earnings by place of work is the sum of wage and salary disbursements (payrolls), supplements to wages and salaries, and proprietors' income. |
| 2. "Other" consists of the wage and salary disbursements to U.S. residents employed by international organizations and foreign embassies and consulates in the U.S. |
| 3. Data are suppressed to avoid disclosure of confidential information. |
| Source: U.S. Bureau of Economic Analysis |
| United States |
1.1 |
-0.01 |
0.01 |
0.01 |
0.02 |
0.11 |
0.07 |
0.02 |
0.07 |
0.06 |
0.02 |
0.03 |
0.06 |
| New England |
| Connecticut |
1.1 |
0.02 |
0.00 |
0.00 |
0.01 |
0.05 |
0.11 |
0.02 |
0.10 |
0.06 |
0.04 |
-0.01 |
0.02 |
| Maine |
1.0 |
-0.02 |
0.02 |
0.00 |
0.02 |
0.07 |
0.06 |
0.03 |
0.06 |
0.09 |
-0.01 |
0.02 |
0.03 |
| Massachusetts |
1.2 |
0.00 |
0.00 |
0.00 |
0.02 |
0.07 |
0.13 |
0.04 |
0.08 |
0.03 |
-0.01 |
0.04 |
0.08 |
| New Hampshire |
1.3 |
-0.01 |
0.00 |
0.00 |
0.02 |
0.20 |
0.31 |
0.04 |
0.03 |
0.13 |
0.07 |
0.02 |
-0.32 |
| Rhode Island |
1.0 |
0.01 |
0.00 |
0.00 |
0.02 |
0.06 |
3/ |
3/ |
0.06 |
0.03 |
0.03 |
-0.28 |
0.13 |
| Vermont |
1.3 |
-0.01 |
0.01 |
0.01 |
0.06 |
0.13 |
0.17 |
0.07 |
0.02 |
0.09 |
0.02 |
-0.02 |
0.03 |
| Mideast |
| Delaware |
1.2 |
0.09 |
0.00 |
0.00 |
0.02 |
-0.04 |
0.09 |
0.03 |
0.07 |
0.11 |
-0.04 |
0.02 |
0.44 |
| District of Columbia |
1.2 |
0.00 |
0.03 |
0.00 |
0.01 |
0.01 |
0.00 |
0.01 |
0.00 |
0.00 |
0.01 |
0.03 |
0.00 |
| Maryland |
1.6 |
0.00 |
0.00 |
0.00 |
0.03 |
0.15 |
0.02 |
0.01 |
0.03 |
0.07 |
0.09 |
-0.01 |
0.06 |
| New Jersey |
1.2 |
-0.01 |
0.00 |
0.00 |
0.02 |
0.07 |
0.01 |
0.03 |
0.12 |
0.06 |
0.04 |
-0.01 |
0.08 |
| New York |
1.2 |
-0.01 |
0.00 |
0.00 |
0.02 |
0.03 |
0.06 |
0.01 |
0.03 |
0.04 |
0.02 |
-0.04 |
0.26 |
| Pennsylvania |
1.3 |
-0.01 |
0.00 |
0.01 |
0.03 |
0.08 |
0.08 |
0.01 |
0.09 |
0.06 |
0.02 |
-0.01 |
0.06 |
| Great Lakes |
| Illinois |
1.5 |
0.17 |
0.00 |
0.01 |
0.02 |
0.02 |
0.10 |
0.04 |
0.09 |
0.05 |
0.05 |
0.01 |
0.05 |
| Indiana |
1.2 |
0.20 |
0.00 |
0.00 |
0.02 |
0.03 |
0.20 |
0.03 |
0.06 |
0.05 |
-0.01 |
0.01 |
0.03 |
| Michigan |
0.7 |
0.03 |
0.00 |
0.01 |
0.03 |
0.01 |
-0.20 |
0.02 |
0.00 |
-0.02 |
0.00 |
-0.01 |
0.04 |
| Ohio |
1.3 |
0.11 |
0.00 |
0.01 |
0.00 |
-0.01 |
0.18 |
0.04 |
0.09 |
0.05 |
0.02 |
0.02 |
0.06 |
| Wisconsin |
1.2 |
0.07 |
0.00 |
0.00 |
0.01 |
0.01 |
0.11 |
0.11 |
0.08 |
0.04 |
0.06 |
-0.02 |
0.05 |
| Plains |
| Iowa |
1.4 |
0.13 |
0.01 |
0.01 |
0.01 |
0.04 |
0.29 |
0.09 |
0.04 |
0.05 |
0.04 |
-0.01 |
0.10 |
| Kansas |
1.6 |
0.57 |
0.00 |
0.03 |
0.03 |
0.10 |
0.14 |
0.02 |
0.11 |
0.04 |
0.02 |
-0.06 |
0.06 |
| Minnesota |
1.6 |
0.20 |
0.00 |
0.01 |
0.02 |
0.11 |
0.06 |
0.07 |
0.09 |
0.08 |
0.06 |
0.02 |
0.03 |
| Missouri |
1.3 |
0.10 |
0.00 |
0.00 |
0.03 |
0.04 |
0.14 |
0.04 |
0.06 |
0.03 |
0.01 |
0.03 |
0.07 |
| Nebraska |
0.9 |
-0.26 |
0.01 |
0.01 |
0.02 |
0.13 |
0.16 |
0.10 |
0.00 |
0.02 |
0.03 |
0.03 |
0.05 |
| North Dakota |
3.0 |
1.88 |
0.01 |
0.07 |
0.06 |
-0.03 |
0.09 |
0.01 |
0.14 |
0.07 |
0.01 |
0.03 |
0.02 |
| South Dakota |
0.9 |
-0.34 |
0.01 |
0.01 |
0.05 |
-0.03 |
0.17 |
-0.01 |
0.10 |
0.08 |
0.00 |
0.03 |
0.19 |
| Southeast |
| Alabama |
0.8 |
-0.06 |
0.01 |
0.00 |
0.04 |
0.03 |
0.16 |
0.02 |
0.06 |
0.04 |
0.01 |
0.02 |
0.04 |
| Arkansas |
1.7 |
0.39 |
0.02 |
0.01 |
-0.01 |
0.05 |
0.05 |
0.09 |
0.07 |
0.08 |
0.06 |
-0.04 |
0.04 |
| Florida |
2.2 |
-0.04 |
0.01 |
0.00 |
0.02 |
0.28 |
0.06 |
0.03 |
0.10 |
0.10 |
0.06 |
0.01 |
0.05 |
| Georgia |
1.3 |
-0.14 |
0.01 |
0.00 |
0.03 |
0.08 |
0.13 |
0.07 |
0.09 |
0.08 |
0.03 |
-0.03 |
0.02 |
| Kentucky |
1.2 |
0.03 |
0.01 |
0.07 |
0.01 |
0.05 |
-0.02 |
0.03 |
0.06 |
0.07 |
0.03 |
0.02 |
0.00 |
| Louisiana |
-15.0 |
-0.35 |
0.01 |
-0.24 |
-0.14 |
-0.91 |
-0.11 |
-0.21 |
-0.14 |
-0.42 |
-0.30 |
-0.04 |
-0.11 |
| Mississippi |
-4.0 |
-0.89 |
0.02 |
-0.04 |
0.02 |
0.00 |
-0.09 |
0.03 |
0.01 |
-0.20 |
-0.06 |
-0.01 |
-0.02 |
| North Carolina |
1.4 |
-0.22 |
0.01 |
0.00 |
0.03 |
0.11 |
0.09 |
0.02 |
0.12 |
0.04 |
0.05 |
0.04 |
0.02 |
| South Carolina |
1.2 |
-0.19 |
0.01 |
0.00 |
0.05 |
0.18 |
0.11 |
0.06 |
0.06 |
0.12 |
0.06 |
0.04 |
0.04 |
| Tennessee |
0.8 |
-0.14 |
0.00 |
0.00 |
0.01 |
0.06 |
0.06 |
0.05 |
0.08 |
0.11 |
0.03 |
-0.01 |
0.04 |
| Virginia |
1.4 |
-0.01 |
0.00 |
0.01 |
0.02 |
0.19 |
0.05 |
0.02 |
0.07 |
0.08 |
-0.02 |
0.01 |
-0.06 |
| West Virginia |
1.1 |
-0.05 |
0.00 |
0.29 |
0.03 |
-0.05 |
0.03 |
-0.04 |
0.02 |
0.01 |
0.11 |
0.04 |
0.02 |
| Southwest |
| Arizona |
2.4 |
0.06 |
0.01 |
0.01 |
0.04 |
0.34 |
0.10 |
0.00 |
0.08 |
0.22 |
0.04 |
-0.02 |
0.10 |
| New Mexico |
1.1 |
-0.18 |
0.01 |
0.13 |
0.02 |
0.19 |
0.09 |
-0.01 |
0.06 |
0.07 |
0.01 |
0.05 |
0.01 |
| Oklahoma |
1.4 |
-0.03 |
0.00 |
0.13 |
0.04 |
0.07 |
0.15 |
0.02 |
0.09 |
0.08 |
0.01 |
0.00 |
0.04 |
| Texas |
1.2 |
-0.10 |
0.00 |
0.08 |
0.03 |
0.14 |
0.11 |
0.04 |
0.10 |
0.05 |
0.03 |
0.03 |
0.06 |
| Rocky Mountain |
| Colorado |
1.6 |
0.35 |
0.00 |
0.06 |
0.01 |
0.20 |
0.03 |
-0.01 |
0.04 |
0.04 |
0.00 |
-0.15 |
0.09 |
| Idaho |
1.0 |
-0.64 |
0.02 |
0.01 |
0.02 |
0.31 |
0.14 |
0.01 |
0.17 |
0.22 |
0.02 |
0.07 |
0.09 |
| Montana |
2.1 |
0.10 |
0.01 |
0.08 |
0.05 |
0.36 |
-0.01 |
-0.01 |
0.11 |
0.07 |
-0.03 |
0.01 |
0.03 |
| Utah |
1.9 |
-0.07 |
0.00 |
0.04 |
0.01 |
0.32 |
0.12 |
0.06 |
0.08 |
0.07 |
0.03 |
0.05 |
0.05 |
| Wyoming |
-2.8 |
-4.66 |
0.00 |
0.33 |
0.04 |
0.21 |
3/ |
3/ |
0.08 |
0.11 |
0.05 |
0.02 |
0.03 |
| Far West |
| Alaska |
1.4 |
0.00 |
0.01 |
0.14 |
0.03 |
0.12 |
0.01 |
0.04 |
0.02 |
0.09 |
0.05 |
0.01 |
-0.02 |
| California |
1.3 |
-0.07 |
0.01 |
0.01 |
0.02 |
0.23 |
0.14 |
-0.06 |
0.06 |
0.10 |
0.01 |
-0.04 |
0.05 |
| Hawaii |
1.4 |
0.03 |
0.00 |
0.00 |
0.04 |
0.12 |
0.01 |
0.00 |
0.05 |
0.08 |
0.11 |
0.01 |
-0.01 |
| Nevada |
1.3 |
0.00 |
0.00 |
0.06 |
0.01 |
0.34 |
0.07 |
0.02 |
0.10 |
0.15 |
0.03 |
-0.43 |
0.11 |
| Oregon |
1.5 |
0.00 |
0.02 |
0.00 |
0.02 |
0.20 |
0.13 |
0.11 |
0.08 |
0.09 |
-0.02 |
0.07 |
0.05 |
| Washington |
2.3 |
0.14 |
0.02 |
0.01 |
0.01 |
0.19 |
-0.70 |
0.01 |
0.10 |
0.09 |
0.03 |
1.57 |
0.04 |
| BEA regions |
| New England |
1.1 |
0.00 |
0.00 |
0.00 |
0.02 |
0.07 |
3/ |
3/ |
0.08 |
0.05 |
0.01 |
0.00 |
0.03 |
| Mideast |
1.3 |
-0.01 |
0.00 |
0.00 |
0.02 |
0.06 |
0.05 |
0.01 |
0.06 |
0.05 |
0.03 |
-0.02 |
0.15 |
| Great Lakes |
1.2 |
0.12 |
0.00 |
0.01 |
0.02 |
0.01 |
0.07 |
0.04 |
0.06 |
0.03 |
0.03 |
0.01 |
0.05 |
| Plains |
1.4 |
0.20 |
0.00 |
0.01 |
0.02 |
0.07 |
0.14 |
0.06 |
0.07 |
0.05 |
0.03 |
0.01 |
0.06 |
| Southeast |
0.4 |
-0.11 |
0.01 |
0.00 |
0.01 |
0.08 |
0.06 |
0.02 |
0.07 |
0.05 |
0.02 |
0.00 |
0.01 |
| Southwest |
1.4 |
-0.07 |
0.00 |
0.07 |
0.03 |
0.16 |
0.11 |
0.03 |
0.09 |
0.08 |
0.03 |
0.02 |
0.06 |
| Rocky Mountain |
1.4 |
-0.14 |
0.01 |
0.06 |
0.02 |
0.25 |
3/ |
3/ |
0.07 |
0.07 |
0.01 |
-0.06 |
0.07 |
| Far West |
1.5 |
-0.04 |
0.01 |
0.01 |
0.02 |
0.23 |
0.03 |
-0.03 |
0.07 |
0.10 |
0.01 |
0.15 |
0.05 |
Table 3. Contributions to Percent Change in Earnings by Place of Work, by State and Region, 2005:II - 2005:III (continued)
| [Percentage points, seasonally adjusted] |
| |
Real estate and rental and leasing |
Professional and technical services |
Management of companies and enterprises |
Administrative and waste services |
Educational services |
Health care and social assistance |
Arts, entertainment, and recreation |
Accommodation and food services |
Other services, except public administration |
Government |
| Federal, civilian |
Military |
State and local |
| Source: U.S. Bureau of Economic Analysis |
| United States |
0.04 |
0.13 |
0.05 |
0.07 |
0.02 |
0.15 |
0.02 |
0.02 |
0.03 |
0.02 |
-0.01 |
0.13 |
| New England |
| Connecticut |
0.17 |
0.10 |
0.03 |
0.06 |
0.01 |
0.15 |
0.00 |
0.01 |
0.01 |
0.02 |
-0.01 |
0.08 |
| Maine |
0.14 |
0.00 |
0.03 |
0.03 |
0.02 |
0.22 |
0.00 |
0.02 |
0.02 |
0.04 |
-0.04 |
0.17 |
| Massachusetts |
0.17 |
0.18 |
0.07 |
0.03 |
0.01 |
0.21 |
0.01 |
0.00 |
0.01 |
-0.03 |
-0.01 |
0.05 |
| New Hampshire |
0.17 |
0.11 |
0.09 |
0.05 |
0.04 |
0.16 |
0.02 |
0.02 |
0.03 |
0.03 |
-0.02 |
0.10 |
| Rhode Island |
0.11 |
0.06 |
0.07 |
0.03 |
0.08 |
0.32 |
0.02 |
0.03 |
0.05 |
0.09 |
-0.07 |
0.12 |
| Vermont |
0.12 |
0.12 |
0.00 |
0.00 |
-0.02 |
0.31 |
0.01 |
0.01 |
0.03 |
0.08 |
0.00 |
0.06 |
| Mideast |
| Delaware |
0.08 |
0.19 |
-0.03 |
-0.03 |
0.02 |
0.13 |
-0.01 |
0.05 |
0.04 |
0.03 |
-0.05 |
0.02 |
| District of Columbia |
0.10 |
0.34 |
0.01 |
0.06 |
0.05 |
0.07 |
0.02 |
0.03 |
0.06 |
0.21 |
-0.03 |
0.13 |
| Maryland |
0.14 |
0.17 |
0.04 |
0.04 |
0.02 |
0.16 |
0.01 |
0.01 |
0.05 |
0.14 |
-0.03 |
0.33 |
| New Jersey |
0.16 |
0.04 |
0.09 |
0.07 |
0.00 |
0.13 |
0.01 |
0.04 |
0.05 |
0.02 |
0.00 |
0.13 |
| New York |
0.15 |
0.19 |
0.06 |
0.06 |
0.06 |
0.16 |
0.02 |
0.02 |
0.03 |
0.01 |
0.01 |
0.05 |
| Pennsylvania |
0.15 |
0.08 |
0.06 |
0.07 |
0.01 |
0.24 |
0.02 |
0.02 |
0.05 |
0.02 |
-0.01 |
0.19 |
| Great Lakes |
| Illinois |
0.19 |
0.19 |
0.04 |
0.05 |
0.05 |
0.15 |
0.00 |
0.02 |
0.03 |
0.02 |
0.01 |
0.15 |
| Indiana |
0.13 |
0.09 |
0.05 |
0.03 |
0.01 |
0.21 |
0.01 |
0.02 |
0.00 |
0.02 |
0.00 |
0.02 |
| Michigan |
0.36 |
0.15 |
0.05 |
0.15 |
0.04 |
0.12 |
0.02 |
0.00 |
0.03 |
0.02 |
-0.01 |
-0.19 |
| Ohio |
0.13 |
0.10 |
0.08 |
0.02 |
0.01 |
0.18 |
0.02 |
0.01 |
0.02 |
0.00 |
-0.01 |
0.15 |
| Wisconsin |
0.10 |
0.07 |
0.08 |
0.04 |
-0.02 |
0.21 |
-0.01 |
0.02 |
0.03 |
0.02 |
-0.01 |
0.19 |
| Plains |
| Iowa |
0.08 |
0.01 |
0.02 |
0.06 |
0.00 |
0.18 |
0.01 |
0.03 |
0.02 |
0.02 |
0.00 |
0.18 |
| Kansas |
0.12 |
0.04 |
0.04 |
0.11 |
0.00 |
0.22 |
0.01 |
0.02 |
0.05 |
0.06 |
-0.07 |
-0.02 |
| Minnesota |
0.12 |
0.11 |
0.03 |
0.03 |
0.01 |
0.27 |
0.03 |
0.03 |
0.03 |
0.02 |
-0.01 |
0.14 |
| Missouri |
0.12 |
0.09 |
0.13 |
0.04 |
-0.01 |
0.17 |
0.04 |
0.02 |
0.03 |
-0.08 |
0.04 |
0.17 |
| Nebraska |
0.09 |
0.08 |
0.05 |
0.09 |
0.00 |
0.16 |
0.00 |
0.01 |
0.01 |
0.05 |
-0.04 |
0.12 |
| North Dakota |
0.09 |
0.08 |
0.04 |
0.06 |
0.00 |
0.19 |
0.00 |
0.01 |
0.02 |
0.19 |
-0.06 |
-0.01 |
| South Dakota |
0.19 |
0.09 |
0.03 |
0.03 |
0.03 |
0.21 |
0.01 |
0.02 |
0.07 |
0.06 |
-0.10 |
0.04 |
| Southeast |
| Alabama |
-0.10 |
0.14 |
0.03 |
0.06 |
0.00 |
0.12 |
0.01 |
0.01 |
0.03 |
0.06 |
-0.03 |
0.14 |
| Arkansas |
0.10 |
0.11 |
0.06 |
0.02 |
0.02 |
0.21 |
0.00 |
0.01 |
0.02 |
0.02 |
-0.03 |
0.30 |
| Florida |
0.22 |
0.30 |
0.05 |
0.32 |
0.02 |
0.20 |
0.06 |
0.08 |
0.06 |
0.02 |
-0.02 |
0.20 |
| Georgia |
0.18 |
0.11 |
0.07 |
0.08 |
0.01 |
0.20 |
0.02 |
0.06 |
0.03 |
-0.02 |
0.03 |
0.12 |
| Kentucky |
0.09 |
0.10 |
0.05 |
0.03 |
0.01 |
0.25 |
0.01 |
0.02 |
0.02 |
0.06 |
0.05 |
0.09 |
| Louisiana |
-10.11 |
-0.50 |
0.00 |
-0.36 |
0.00 |
-0.33 |
-0.02 |
-0.65 |
-0.15 |
0.00 |
-0.06 |
0.10 |
| Mississippi |
-2.44 |
0.03 |
0.03 |
-0.06 |
-0.05 |
0.07 |
-0.07 |
-0.22 |
-0.08 |
0.06 |
-0.10 |
0.05 |
| North Carolina |
0.14 |
0.16 |
0.08 |
0.13 |
-0.01 |
0.19 |
0.03 |
0.02 |
0.09 |
0.06 |
0.04 |
0.15 |
| South Carolina |
0.16 |
0.08 |
-0.01 |
0.15 |
0.00 |
0.16 |
-0.02 |
0.01 |
0.04 |
0.04 |
0.01 |
0.00 |
| Tennessee |
0.22 |
0.09 |
0.03 |
0.05 |
0.01 |
-0.05 |
0.01 |
0.03 |
0.02 |
-0.03 |
-0.01 |
0.15 |
| Virginia |
0.17 |
0.23 |
0.10 |
0.04 |
0.01 |
0.12 |
0.01 |
0.03 |
0.03 |
0.09 |
0.08 |
0.14 |
| West Virginia |
0.05 |
0.12 |
0.01 |
0.03 |
0.01 |
0.23 |
0.01 |
0.00 |
0.02 |
0.08 |
-0.03 |
0.15 |
| Southwest |
| Arizona |
0.37 |
0.16 |
0.06 |
0.18 |
0.03 |
0.24 |
0.03 |
0.06 |
0.08 |
0.05 |
0.00 |
0.21 |
| New Mexico |
0.12 |
0.08 |
0.03 |
0.06 |
0.01 |
0.10 |
0.00 |
0.04 |
0.04 |
0.04 |
-0.06 |
0.16 |
| Oklahoma |
0.10 |
0.12 |
0.03 |
0.04 |
0.00 |
0.17 |
0.01 |
0.01 |
0.02 |
0.09 |
-0.03 |
0.24 |
| Texas |
0.20 |
0.08 |
0.02 |
0.07 |
0.01 |
0.13 |
0.01 |
0.02 |
0.02 |
0.00 |
-0.02 |
0.13 |
| Rocky Mountain |
| Colorado |
0.29 |
0.22 |
0.06 |
0.07 |
0.01 |
0.13 |
0.01 |
0.02 |
0.03 |
0.04 |
-0.01 |
0.12 |
| Idaho |
0.15 |
0.11 |
0.07 |
0.13 |
0.03 |
0.19 |
0.01 |
0.03 |
0.01 |
-0.04 |
-0.02 |
-0.14 |
| Montana |
0.43 |
0.12 |
0.01 |
0.10 |
0.01 |
0.27 |
0.01 |
0.07 |
0.02 |
0.06 |
-0.02 |
0.21 |
| Utah |
0.23 |
0.25 |
0.08 |
0.02 |
0.03 |
0.19 |
0.03 |
0.03 |
0.04 |
0.05 |
-0.02 |
0.16 |
| Wyoming |
0.35 |
0.10 |
0.01 |
0.00 |
0.00 |
0.16 |
0.00 |
0.01 |
0.01 |
-0.05 |
-0.06 |
0.33 |
| Far West |
| Alaska |
0.18 |
0.09 |
0.01 |
0.05 |
0.00 |
0.08 |
0.01 |
0.05 |
0.02 |
-0.03 |
0.24 |
0.17 |
| California |
0.25 |
0.12 |
0.04 |
0.07 |
0.01 |
0.12 |
0.02 |
0.02 |
0.02 |
0.01 |
0.00 |
0.20 |
| Hawaii |
0.26 |
0.07 |
0.11 |
0.09 |
0.05 |
0.14 |
0.04 |
0.14 |
0.05 |
0.06 |
-0.14 |
0.10 |
| Nevada |
0.22 |
0.15 |
-0.30 |
0.14 |
0.01 |
0.17 |
0.04 |
0.23 |
0.04 |
0.04 |
-0.02 |
0.16 |
| Oregon |
0.13 |
0.10 |
0.08 |
0.04 |
0.01 |
0.26 |
0.02 |
0.02 |
0.01 |
-0.02 |
0.00 |
0.10 |
| Washington |
0.13 |
0.13 |
0.05 |
0.06 |
0.02 |
0.16 |
0.03 |
0.03 |
0.04 |
0.07 |
-0.08 |
0.21 |
| BEA regions |
| New England |
0.17 |
0.13 |
0.06 |
0.04 |
0.01 |
0.20 |
0.01 |
0.01 |
0.01 |
0.01 |
-0.01 |
0.08 |
| Mideast |
0.14 |
0.14 |
0.06 |
0.06 |
0.03 |
0.17 |
0.02 |
0.02 |
0.04 |
0.04 |
0.00 |
0.13 |
| Great Lakes |
0.19 |
0.13 |
0.06 |
0.06 |
0.02 |
0.17 |
0.01 |
0.01 |
0.02 |
0.02 |
0.00 |
0.06 |
| Plains |
0.11 |
0.08 |
0.06 |
0.06 |
0.00 |
0.21 |
0.02 |
0.02 |
0.03 |
0.00 |
-0.01 |
0.12 |
| Southeast |
-0.49 |
0.14 |
0.05 |
0.10 |
0.01 |
0.13 |
0.02 |
0.00 |
0.03 |
0.03 |
0.01 |
0.15 |
| Southwest |
0.22 |
0.10 |
0.03 |
0.08 |
0.01 |
0.15 |
0.01 |
0.03 |
0.03 |
0.02 |
-0.02 |
0.16 |
| Rocky Mountain |
0.28 |
0.20 |
0.06 |
0.06 |
0.01 |
0.16 |
0.01 |
0.02 |
0.03 |
0.03 |
-0.02 |
0.12 |
| Far West |
0.23 |
0.12 |
0.03 |
0.07 |
0.01 |
0.14 |
0.02 |
0.04 |
0.03 |
0.01 |
-0.01 |
0.19 |
|
|
|