
News Release
Gross Domestic Product by Metropolitan Area, 2015
Professional and Business Services Led Growth Across Metropolitan Areas in 2015
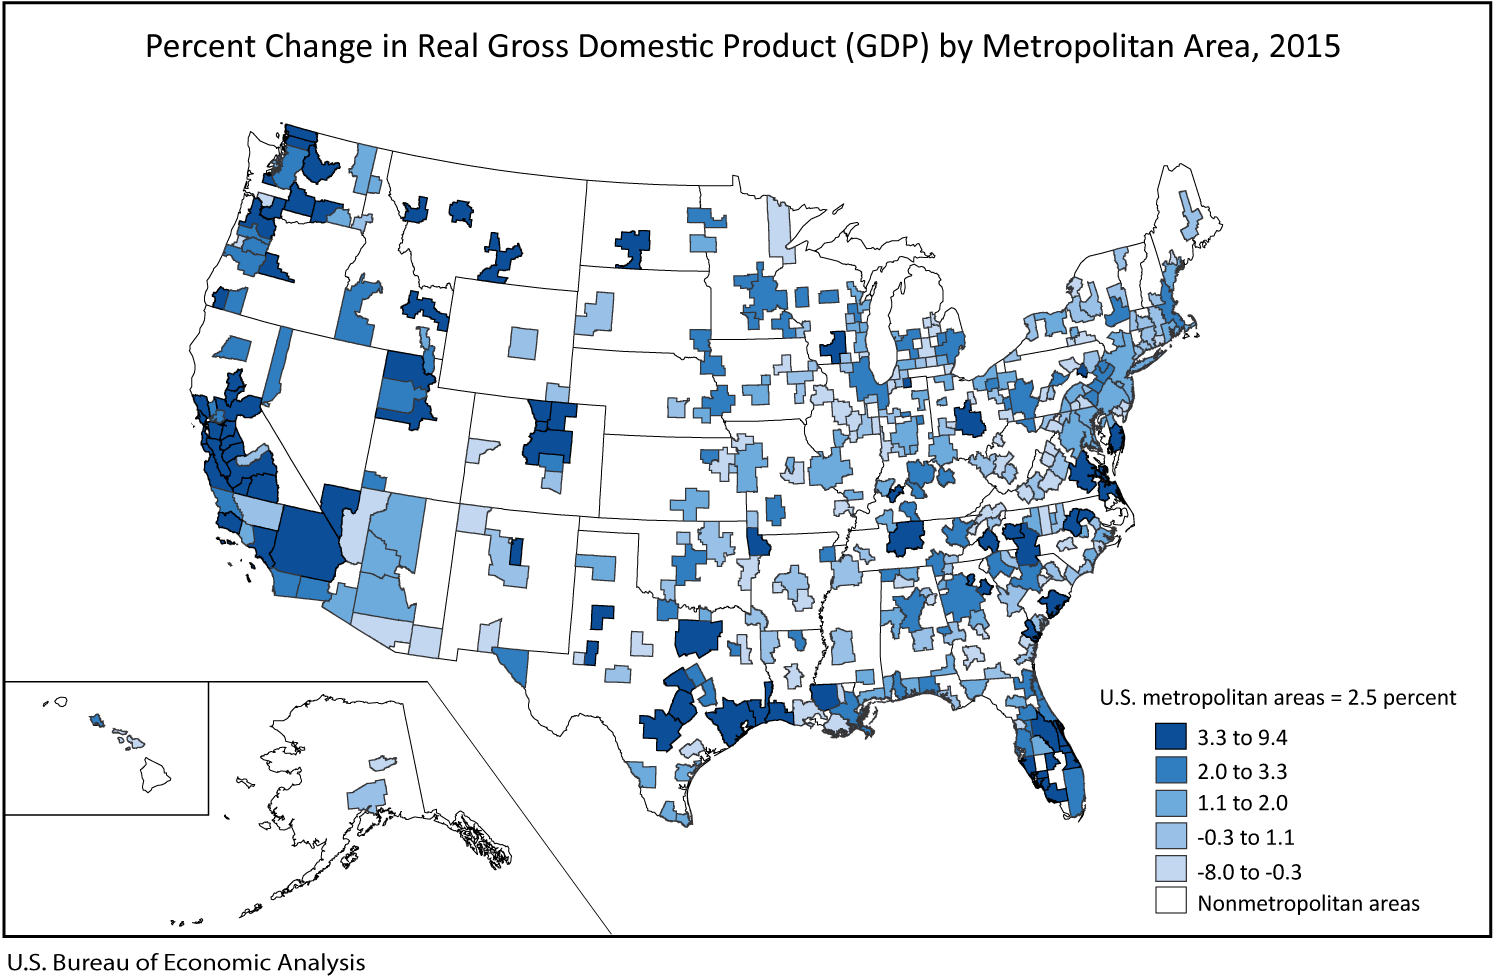
Real gross domestic product (GDP) increased in 292 metropolitan areas in 2015, led by growth in professional and business services; wholesale and retail trade; and finance, insurance, real estate, rental and leasing, according to statistics on the geographic breakout of GDP released today by the Bureau of Economic Analysis. Collectively, real GDP for U. S. metropolitan areas increased 2.5 percent in 2015 after increasing 2.3 percent in 2014.
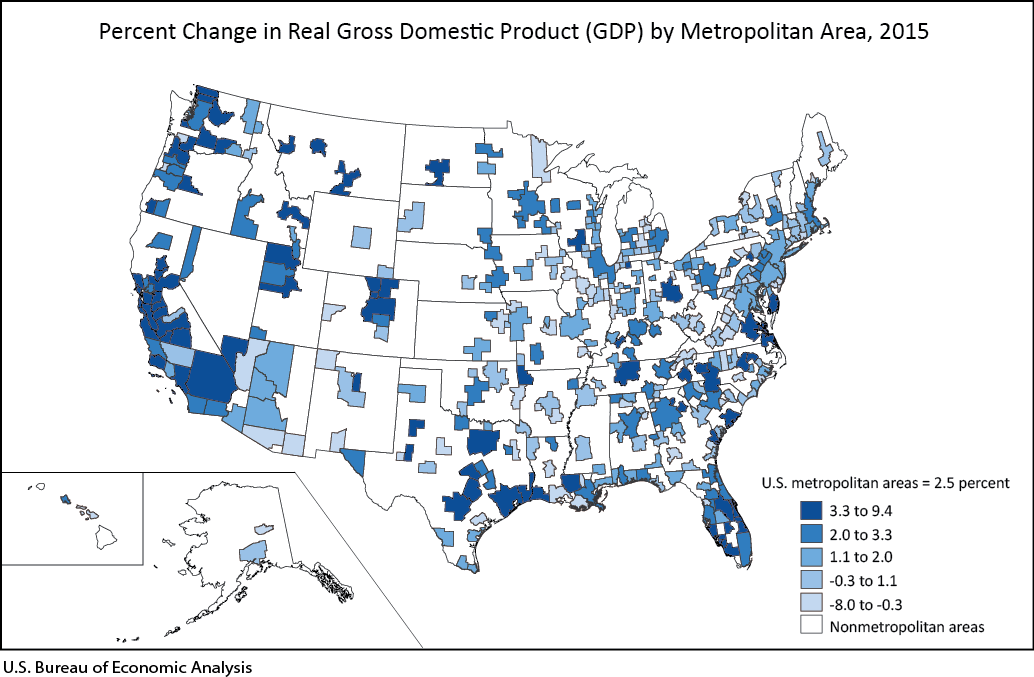
- Professional and business services contributed 0.61 percentage point to U.S. metropolitan area real GDP growth in 2015. This industry contributed to growth in 293 of the nation's 382 metropolitan areas. Growth in this industry accounted for more than half of real GDP growth in 32 metropolitan areas, and contributed more than one percentage point to growth in 25 metropolitan areas, most notably in San Jose-Sunnyvale-Santa Clara, CA (2.75 percentage points), the second fastest growing metropolitan area in the nation (8.9 percent).
- The wholesale and retail trade industry group contributed 0.40 percentage point to U.S. metropolitan area real GDP growth in 2015. This industry contributed to growth in 335 metropolitan areas and was the leading contributor to growth in 67 metropolitan areas. This industry contributed more than one percentage point to growth in 20 metropolitan areas, most notably in Hickory-Lenoir-Morganton, NC (1.44 percentage points)
- The finance, insurance, real estate, rental, and leasing industry group contributed 0.39 percentage point to U.S. metropolitan area real GDP growth in 2015. This industry contributed to growth in 246 metropolitan areas and was the leading contributor to growth in 86 metropolitan areas. This industry contributed more than one percentage point to growth in 48 metropolitan areas. This industry also had strong contributions to growth in three metropolitan areas in Florida where total growth was greater than four percent: Sebastian-Vero Beach, FL (3.22 percentage points); Naples-Immokalee-Marco Island, FL (2.91 percentage points); and Punta Gorda, FL (2.39 percentage points).
- Although natural resources and mining and nondurable-goods manufacturing were not major contributors to growth for the nation, these industries contributed to strong growth in several of the fastest growing metropolitan areas. Natural resources and mining led to notable growth in total real GDP for Midland, TX (9.4 percent) and Visalia-Porterville, CA (7.6 percent), the fastest and fourth fastest growing metropolitan areas, respectively. Nondurable-goods manufacturing led to growth in Lake Charles, LA (8.3 percent)–the third fastest growing metropolitan area.
- Transportation and utilities subtracted 0.14 percentage point from U.S. metropolitan area real GDP growth in 2015. This industry subtracted from growth in 311 metropolitan areas. The largest subtractions occurred in Houma-Thibodeaux, LA (5.50 percentage points) and Homosassa Springs, FL (3.37 percentage points).
Large Metropolitan Area Highlights
- Of the large metropolitan areas, those with population greater than two million, San Antonio-New Braunfels, TX (5.9 percent) and Austin-Round Rock, TX (5.0 percent) were the fastest growing large metropolitan areas. San Antonio-New Braunfels, TX was led by a strong contribution from natural resources and mining (2.51 percentage points), while growth in Austin-Round Rock, TX was led by professional and business services (1.57 percentage points).
- The slowest growing large metropolitan areas were Washington-Arlington-Alexandria, DC-VA-MD-WV (1.3 percent) and Cleveland-Elyria, OH (1.1 percent). Growth in Washington-Arlington-Alexandria, DC-VA-MD-WV was restrained by a decline in finance, insurance, real estate, rental and leasing (–0.17 percentage points), while durable-goods manufacturing restrained growth in Cleveland-Elyria, OH (–0.32 percentage points).
More metropolitan area highlights can be found on the regional highlights pages that accompany this release.
GDP by Metropolitan Area Statistics
The statistics of GDP by metropolitan area for 2015 are based on source data that are subject to further revision and are limited to 22 NAICS-based sectors. Revised statistics for 2014 are released for 22 NAICS-based sectors and, for the first time, more-detailed 61 NAICS-based subsectors. Statistics for 2001–2013 are also revised. More information on these statistics and the sources of the revisions will appear in the October 2016 issue of the Survey of Current Business, BEA's monthly journal.
Next release – September 2017 for: Gross Domestic Product by Metropolitan Area, 2016