
News Release
Gross Domestic Product by Industry: Second Quarter 2019
Annual Update: 2014 Through First Quarter 2019
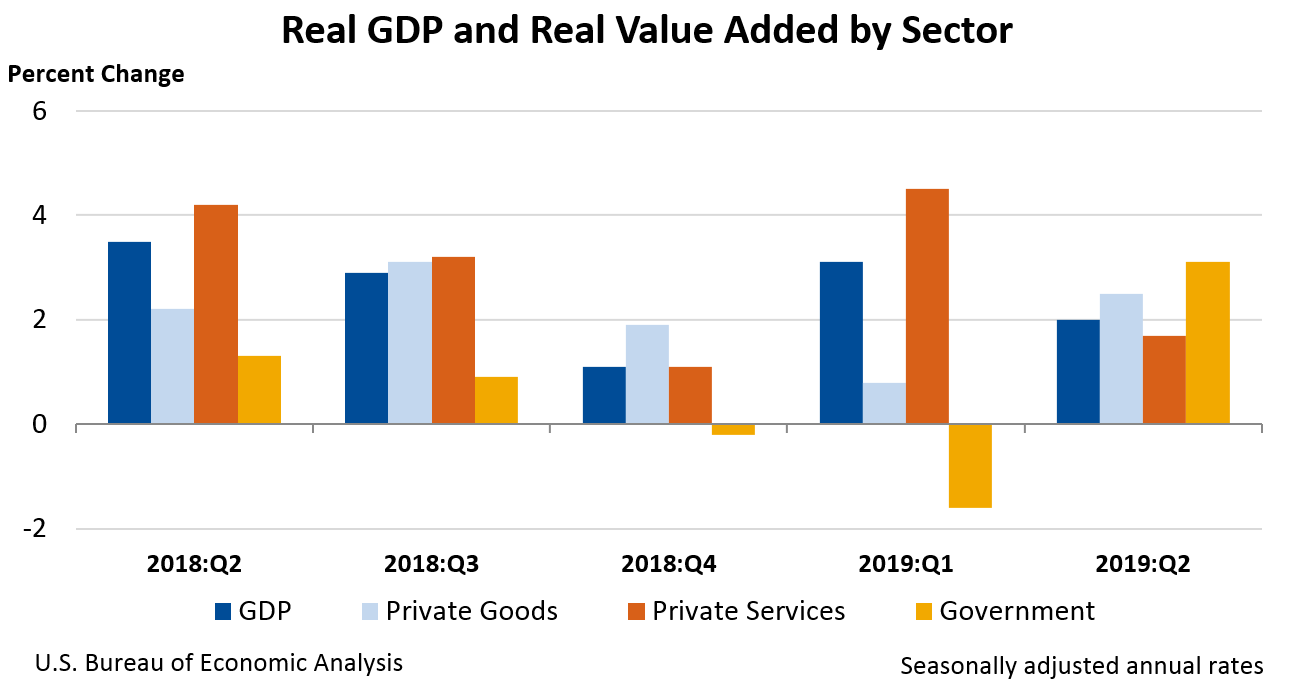
Professional, scientific, and technical services; real estate and rental and leasing; and mining were the leading contributors to the increase in U.S. economic growth in the second quarter of 2019, according to gross domestic product (GDP) by industry statistics released by the Bureau of Economic Analysis. The private goods- and services-producing industries, as well as the government sector, contributed to the increase. Overall, 14 of 22 industry groups contributed to the 2.0 percent increase in real GDP in the second quarter.
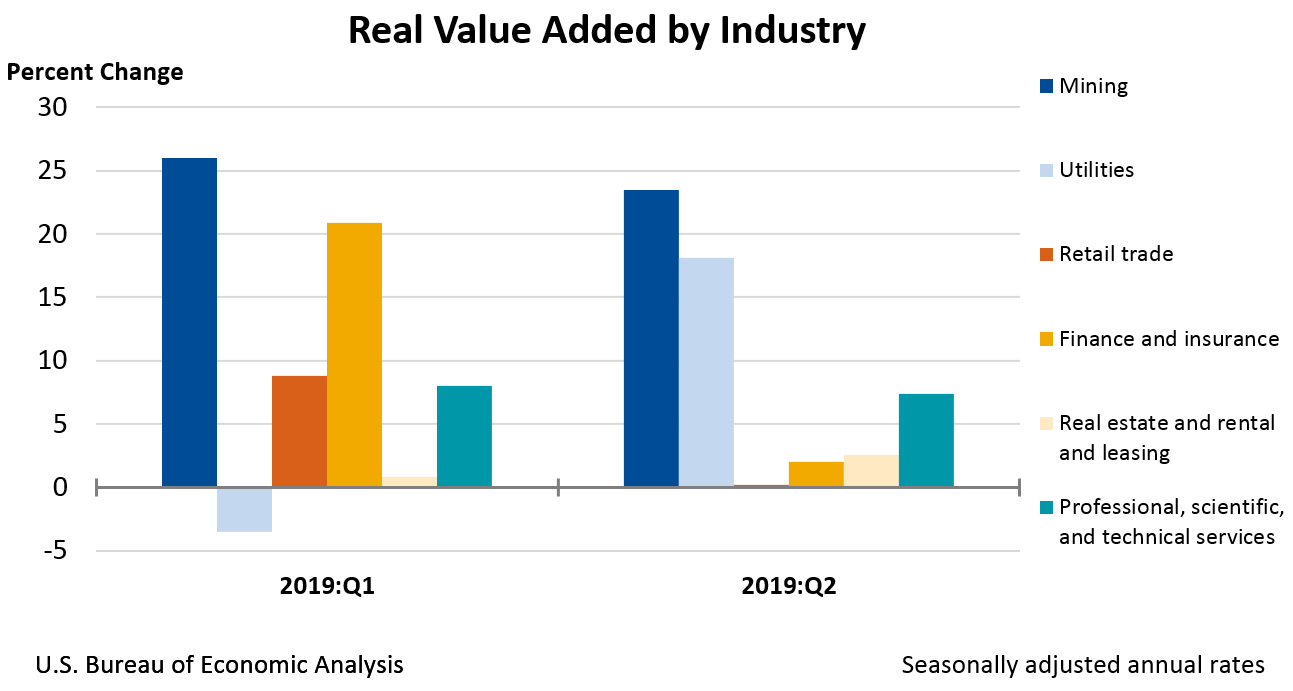
- For the professional, scientific, and technical services industry group, real value added—a measure of an industry’s contribution to GDP—increased 7.4 percent in the second quarter, after increasing 8.0 percent in the first quarter. The second quarter growth reflected increases to miscellaneous professional, scientific, and technical services, as well as computer systems design and related services.
- Real estate and rental and leasing increased 2.6 percent, after increasing 0.8 percent. The second quarter growth primarily reflected an increase in other real estate, which includes offices of real estate agents and brokers.
- Mining increased 23.5 percent in the second quarter, after increasing 26.0 percent. The second quarter growth primarily reflected an increase in oil and gas extraction.
Other highlights
- Real GDP growth slowed to 2.0 percent in the second quarter, from 3.1 percent in the first quarter. Finance and insurance was the leading contributor to the deceleration with real value added for the industry group increasing 2.0 percent in the second quarter, after increasing 20.9 percent in the first quarter.
- Retail trade increased 0.2 percent in the second quarter, after increasing 8.8 percent, and was the second leading contributor to the slowdown. The deceleration was primarily attributed to a slowdown in other retail, which includes gasoline stations as well as building material and garden equipment and supplies dealers.
- Utilities increased 18.1 percent in the second quarter, after decreasing 3.5 percent in the first quarter.
Gross output by industry
Economy-wide, real gross output—principally a measure of an industry’s sales or receipts, which includes sales to final users in the economy (GDP) and sales to other industries (intermediate inputs)—increased 2.0 percent in the second quarter. This reflected an increase of 2.9 percent for the private services-producing sector, and 4.4 percent for the government sector, while the private goods-producing sector decreased 1.4 percent. Overall, 15 of 22 industry groups contributed to the increase in real gross output.
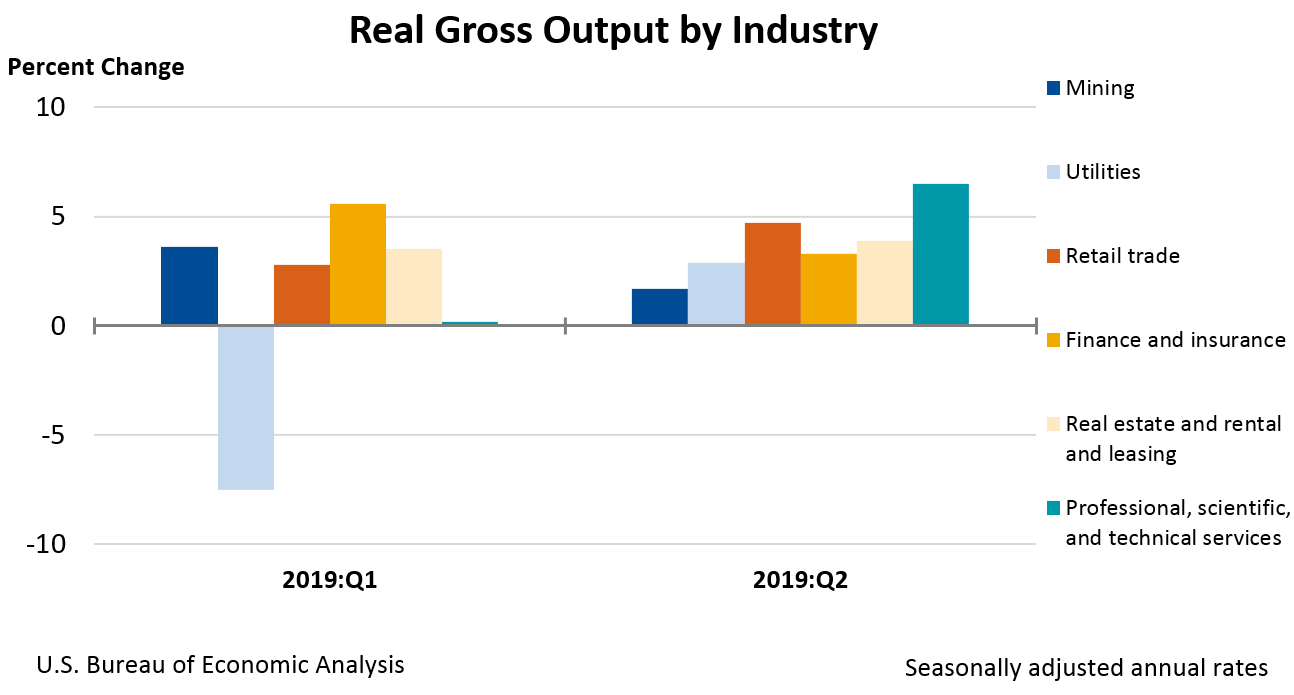
- Real gross output for retail trade increased 4.7 percent in the second quarter, after increasing 2.8 percent in the first quarter. The increase was primarily attributed to other retail, which includes nonstore retailers.
- Real estate and rental and leasing increased 3.9 percent, after increasing 3.5 percent in the first quarter.
- Professional, scientific, and technical services increased 6.5 percent in the second quarter, after increasing 0.2 percent in the first quarter. The increase was primarily attributed to an increase in miscellaneous professional, scientific, and technical services, which includes advertising, research and development, and engineering services.
Annual Update of the Industry Economic Accounts
The estimates released today reflect the results of the annual update of the Industry Economic Accounts. The update covers the first quarter of 2014 through the first quarter of 2019. Major improvements introduced with this update include:
- Incorporation of results from the 2019 annual update of the National Income and Product Accounts, including a new quality-adjusted price for cellular phones, as well as new private data on video streaming revenue that enhances the coverage of streaming providers.
- Incorporation of newly available and revised source data, including the Census Bureau’s Service Annual Survey, the Bureau of Labor Statistics’ Quarterly Census of Employment and Wages, and the Department of Treasury’s Statistics of Income.
Benchmark and annul supply-use tables, as well as the full results of the release can be found on the BEA Web site. Additional information will be available in an article in the November 2019 issue of the Survey of Current Business.
***
Next release – January 9, 2020 at 8:30 A.M. EST for:
Gross Domestic Product by Industry: Third Quarter 2019