
News Release
Gross Domestic Product by State and Personal Income by State, 1st Quarter 2025
Real gross domestic product decreased in 39 states in the first quarter of 2025, with the percent change ranging from 1.7 percent at an annual rate in South Carolina to –6.1 percent in Iowa and Nebraska, according to statistics released today by the U.S. Bureau of Economic Analysis (table 1).
Current-dollar gross domestic product (GDP) increased in 47 states and the District of Columbia, with the percent change ranging from 8.7 percent at an annual rate in North Dakota to –2.7 percent in Iowa.
Personal income, in current dollars, increased in all 50 states and the District of Columbia in the first quarter of 2025, with the percent change ranging from 12.7 percent at an annual rate in North Dakota to 3.2 percent in Washington state (table 3).
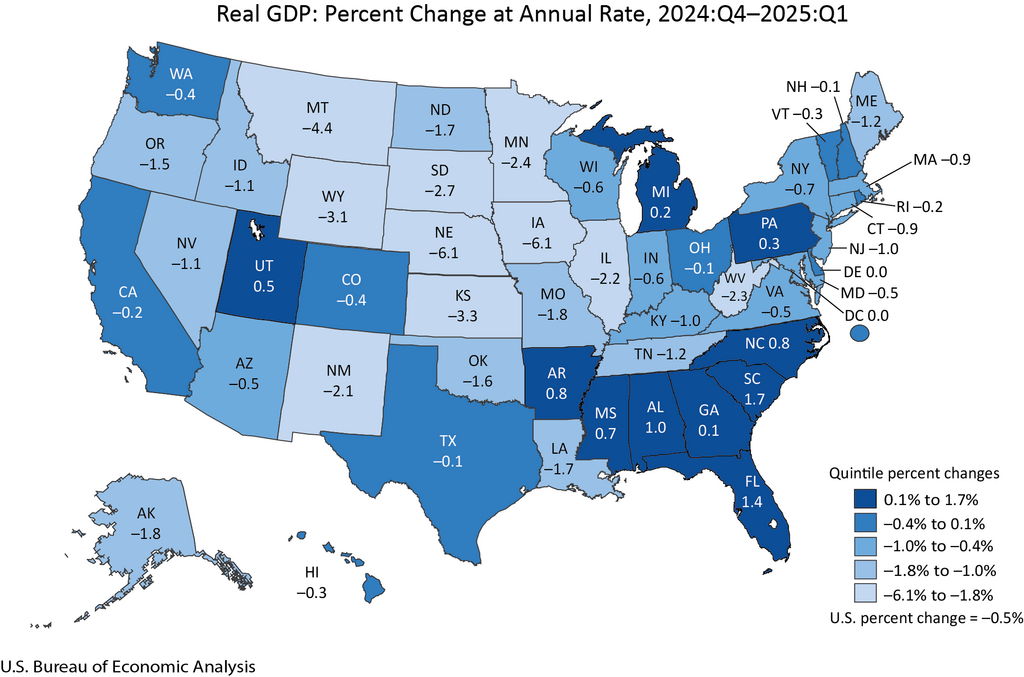

Real GDP
In the first quarter of 2025, real GDP for the nation decreased at an annual rate of 0.5 percent. Real GDP decreased in 16 of the 23 industry groups for which BEA prepares quarterly state estimates. Finance and insurance; agriculture, forestry, fishing and hunting; and wholesale trade were the leading contributors to the decrease in real GDP nationally (table 2).
- Agriculture, forestry, fishing, and hunting, which decreased in 39 states, was the leading contributor to the decreases in 11 states, including Nebraska, Iowa, Montana, and Kansas.
- Mining, which decreased in 43 states, was the leading contributor to the decreases in eight states, including Wyoming, the state with the fifth-largest decline in real GDP.
- Finance and insurance, which decreased in all 50 states and the District of Columbia, was the leading contributor to decreases in 18 states.
- Real estate and rental and leasing, which increased in all 50 states and the District of Columbia, was the leading contributor to growth in South Carolina, the state with the largest increase in real GDP.
Personal income
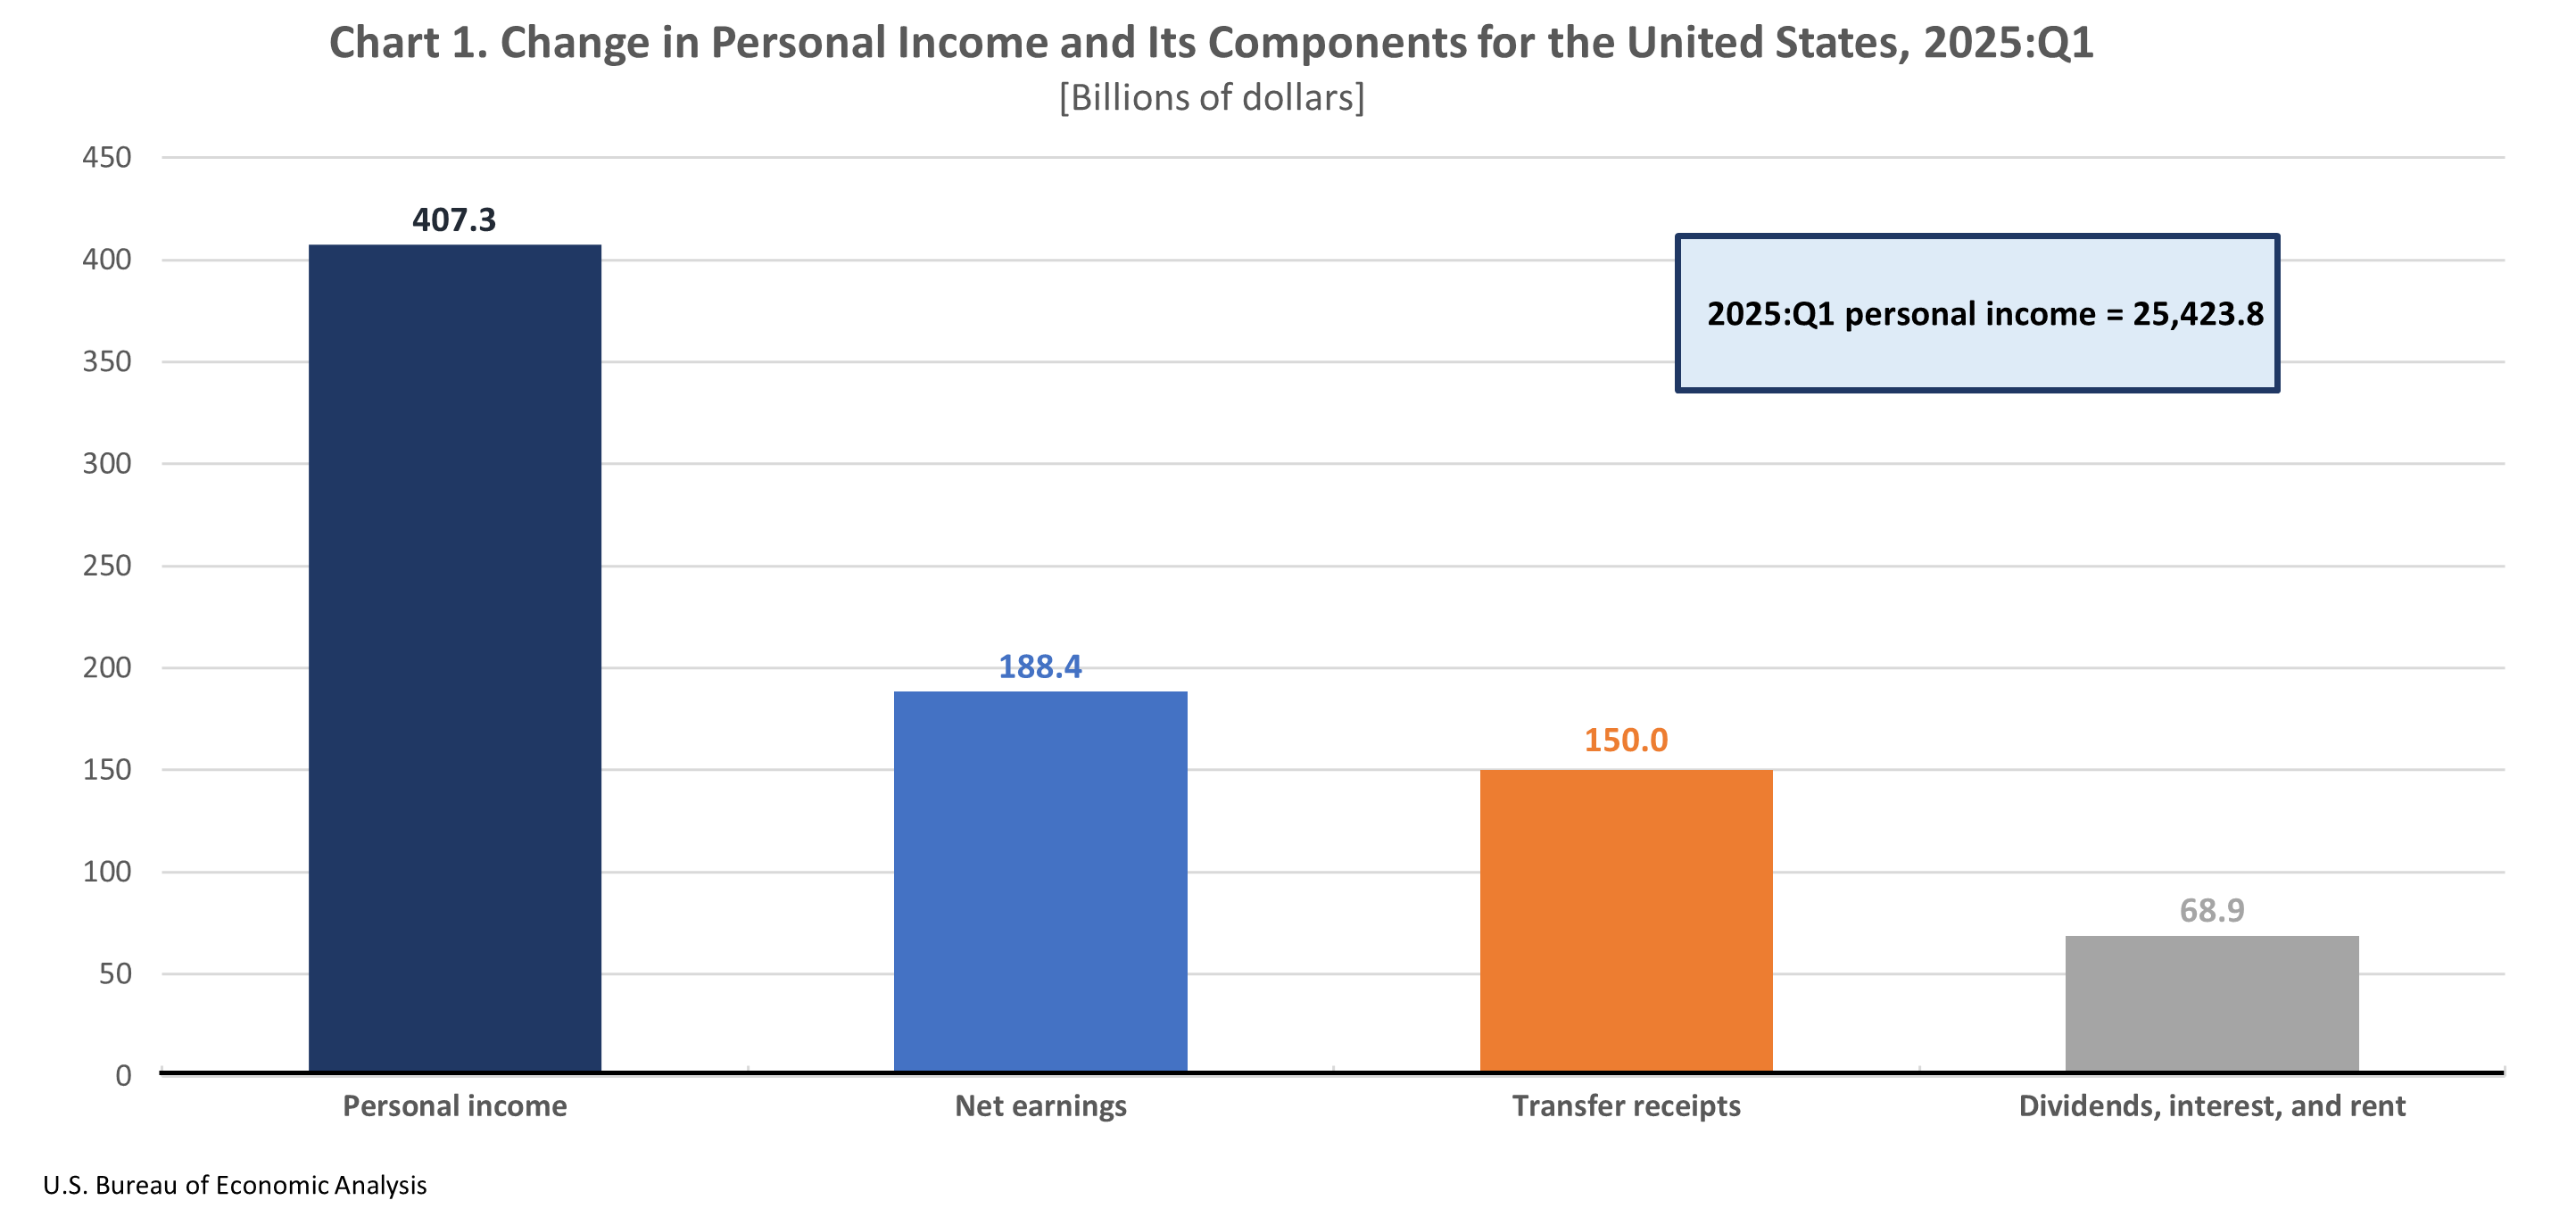
In the first quarter of 2025, current-dollar personal income increased $407.3 billion, or 6.7 percent at an annual rate (table 3). Nationally, increases in earnings, transfer receipts, and property income (dividends, interest, and rent) contributed to the increase in personal income (chart 1).
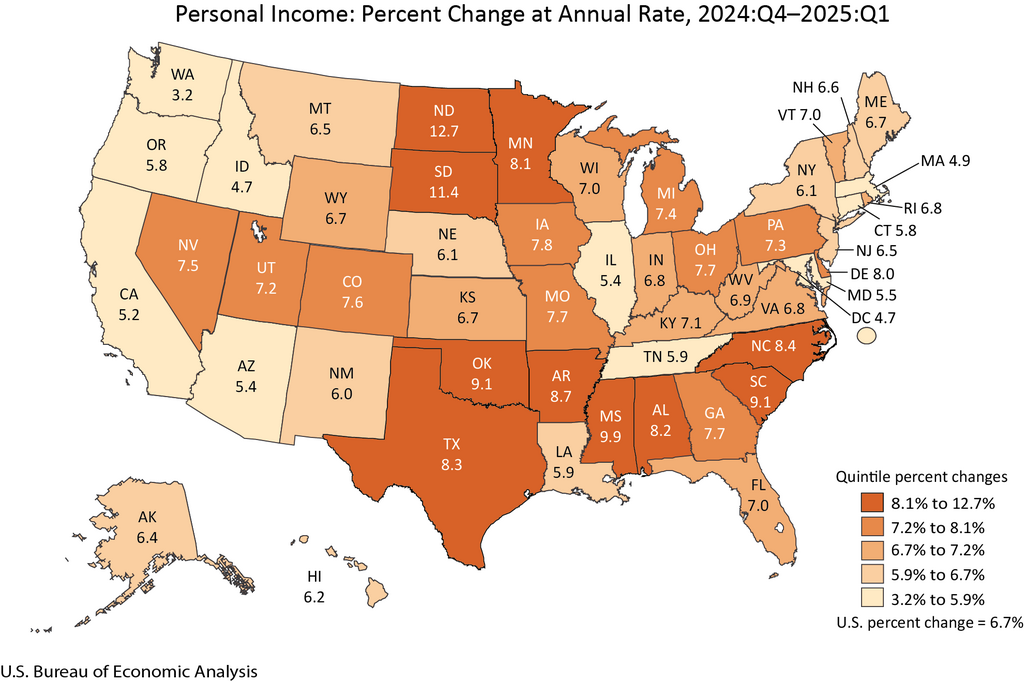


Earnings increased in all 50 states and the District of Columbia, while growing 5.0 percent nationally (table 4). The percent change in earnings ranged from 13.5 percent in North Dakota to 0.1 percent in Washington state. Earnings increased in 22 of the 24 industries for which BEA prepares quarterly state estimates and was the largest contributor to growth in personal income in 28 states (table 5).
- Farm earnings was the leading contributor to increases in North Dakota, South Dakota, and Mississippi, the states with the three largest increases in personal income, due in part to government payments from the Emergency Commodity Assistance Program.
- In South Carolina, the state with the fourth-largest increase in personal income, construction was the leading contributor to the increase in earnings.
- In Oklahoma, the state with the fifth-largest increase in personal income, mining was the leading contributor to the increase in earnings.
Transfer receipts increased in all 50 states and the District of Columbia, while growing 13.6 percent nationally. The percent change in transfer receipts ranged from 21.2 percent in Nevada to 9.1 percent in Florida (table 4). The increase in transfer receipts was due in part to an increase in Affordable Care Act premium tax credits and an annual cost-of-living adjustment for Social Security benefits.
Property income increased in all 50 states and the District of Columbia, while growing 5.6 percent nationally. The percent change ranged from 7.8 percent in Idaho to 3.8 percent in Alaska (table 4).
Update of state statistics
Today, BEA also released revised quarterly estimates of personal income by state for the first through fourth quarters of 2024. This update incorporates new and revised source data that are more complete and more detailed than previously available and aligns the states with the national estimates from the National Income and Product Accounts released on June 26, 2025.
New combined state news release
On September 26, 2025, BEA will publish quarterly GDP and personal income by state along with annual personal consumption expenditures by state in a single news release. This combined release will provide a fuller picture of the economies of all states and the District of Columbia and will replace the publication of two separate releases issued on different days. BEA will release revised annual state GDP and personal income estimates for 2020 to 2024, along with revised quarterly estimates for the first quarter of 2020 through the first quarter of 2025 and preliminary estimates for the second quarter of 2025. An upcoming article in the Survey of Current Business will describe the results.
Upcoming changes in the presentation of tables
BEA’s ongoing modernization and streamlining of news release packages will include changes in the presentation of tables starting with the September 26, 2025 release of GDP, personal income, and personal consumption expenditures (PCE) by state.
Data previously published as tables within the quarterly and annual news releases on GDP, personal income, and PCE by state will continue to be updated and available simultaneously with the release in BEA’s online Interactive Data Tables. However, tables will no longer be included in the body of the news release. This will reduce duplication, increase efficiency, and point data users directly to our most complete and flexible data tables, via links in the release. These customizable tables include full time series and can be downloaded as PDFs, in Excel, or in CSV format.
Next release: September 26, 2025, at 10:00 a.m. EDT
Gross Domestic Product by State and Personal Income by State, 2nd Quarter 2025 and Personal Consumption Expenditures by State, 2024