
GDP by State
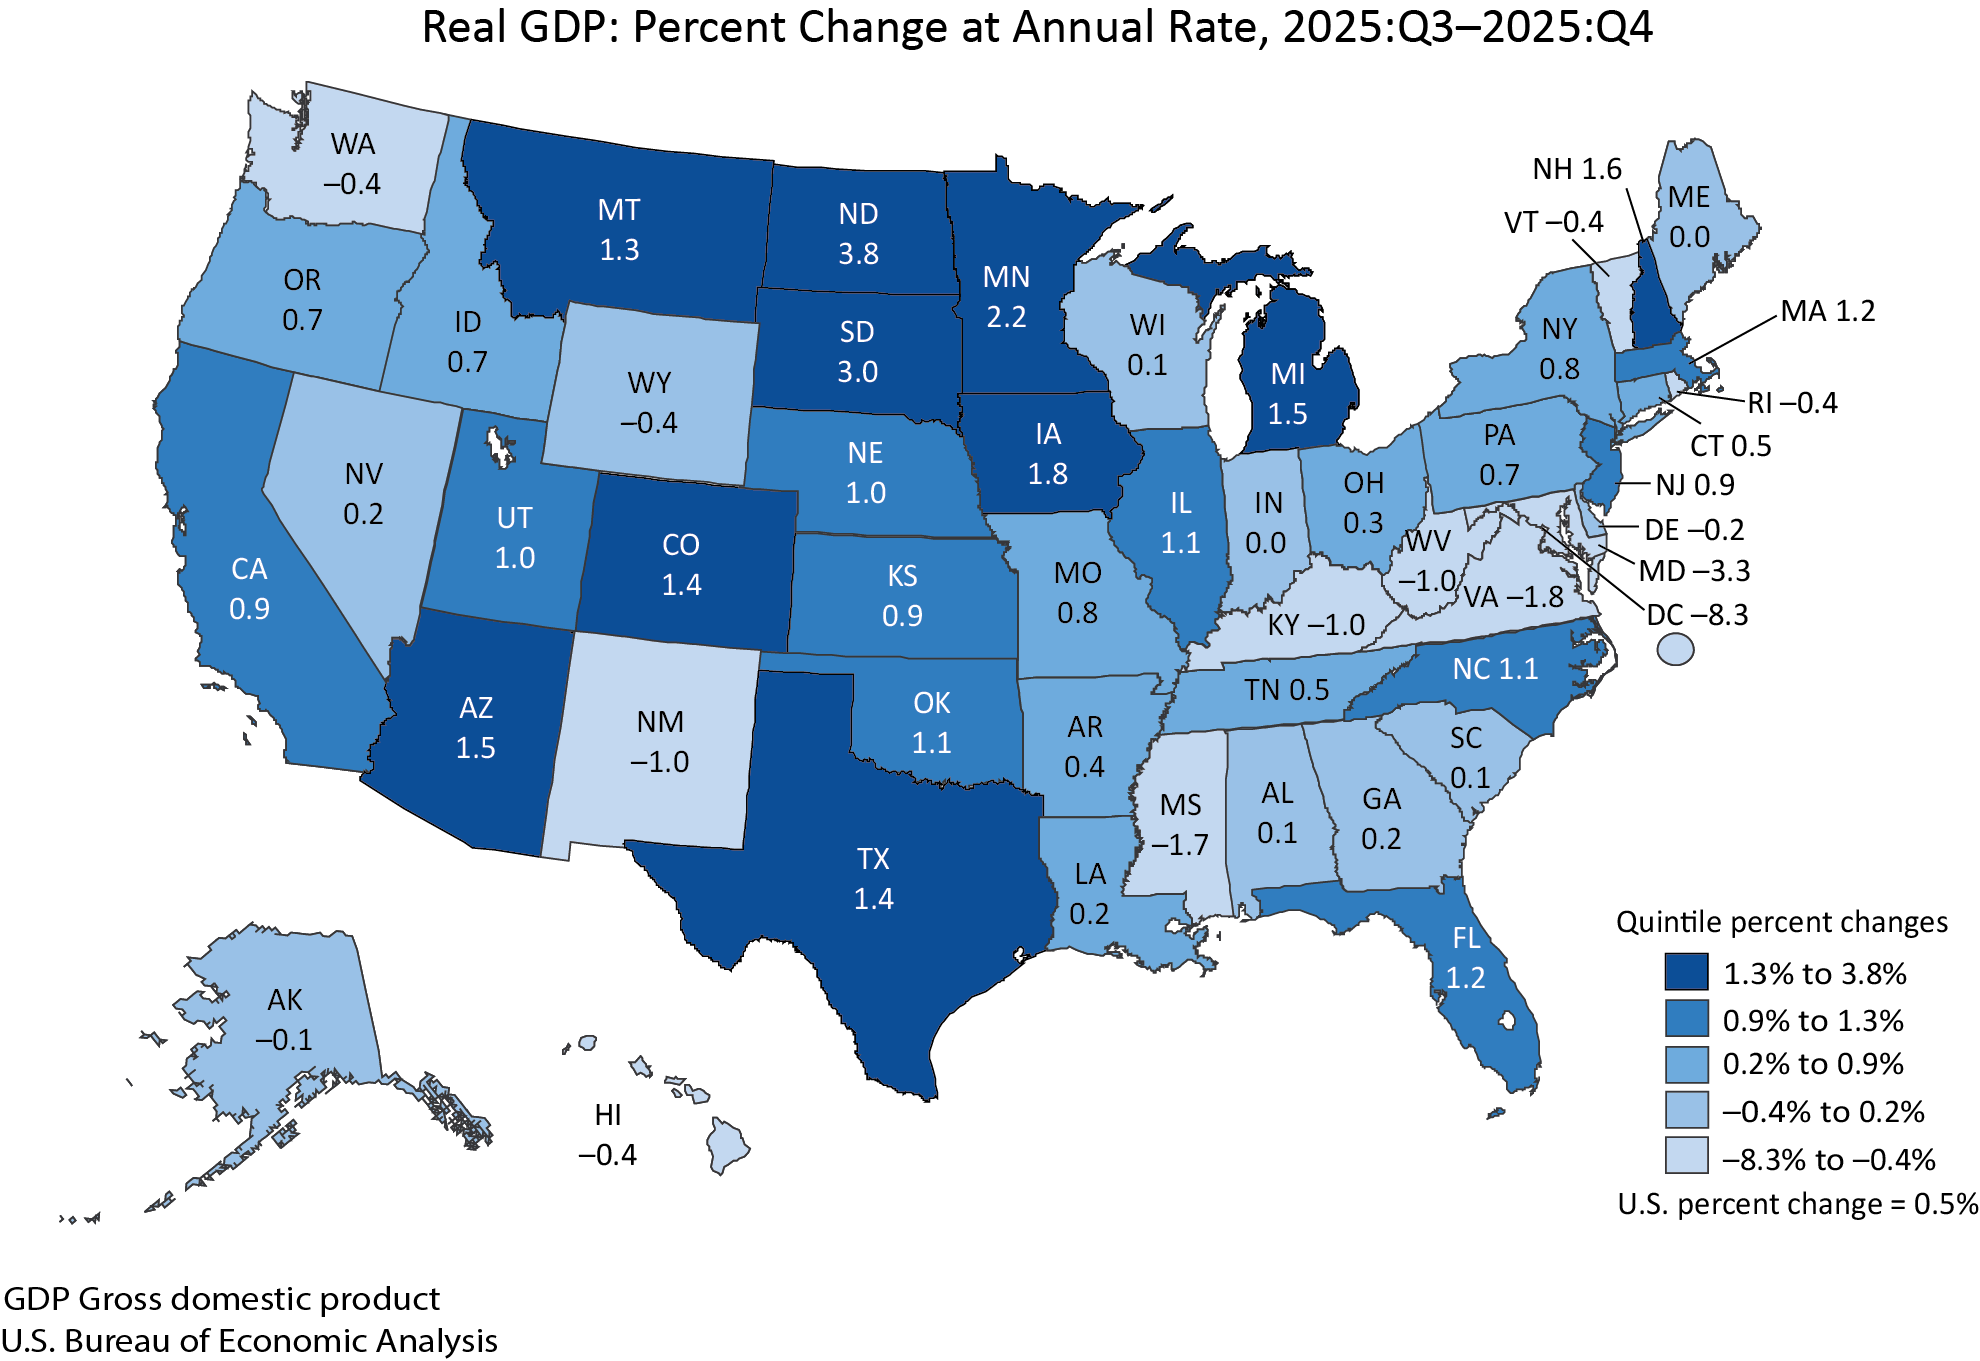
Real gross domestic product (GDP) increased in 35 states in the fourth quarter of 2025. State-level changes ranged from a 3.8 percent increase in North Dakota to a 8.3 percent decrease in the District of Columbia.
Current Release: April 9, 2026 | Next Release: June 25, 2026
- Interactive Tables: GDP by state
- Interactive Maps: GDP by state
- BEARFACTS BEA Regional Fact Sheet about personal income and gross domestic product.
- SCB, Results of the 2025 Annual Update of the Regional Economic Accounts, January 2026 HTM
- New and Updated Estimates of the Regional Economic Accounts: Results of the 2023 Comprehensive Update HTM | SCB, December 2023
- The 2022 Annual Update of the Regional Economic Accounts: New Statistics for 2021 and Updated Statistics for 2017–2020: Toward Regional Economic Recovery from the COVID–19 Pandemic HTM | SCB, November 2022
- Regional Quarterly Report, November 2020 HTM
- Regional Quarterly Report, May 2019 HTM
- Regional Quarterly Report, March 2019 HTM
- Data Archive HTML Previously published estimates contain historical data and have since been revised.
- News Release Archive
What is GDP by State?
A comprehensive measure of the economies of each state and the District of Columbia. GDP estimates the value of the goods and services produced in a state. The data include breakdowns of industries' contributions to each state economy.

Contact Personnel
-
GDP by StateTodd Siebeneck
-
MediaConnie O’Connell